


Environmental protection is an interdisciplinary scientific discipline that relies heavily on information and communication technology (ICT) to analyse heterogeneous data to research complex environmental issues. Simulation modelling is a popular methodology for parameterising and optimising processes [1]. The analysis, modelling, and optimisation of continuous-discrete water purification systems are based on describing system features' structure, entities, and relationships [2]. Mathematical models provide insight into the legality of system behaviour and the interdependence of entities [3], serving as the background for developing a system dynamics model.
One of the major problems associated with landfills is the type and number of pollutants present in leachates [4], which are dark colloidal solutions generated by the circulation of stormwater throughout the landfills and biochemical processes in the decomposing waste. These solutions are unpleasant smelling, highly conductive, and contain high concentrations of organic matter. Although effective purification methods exist, they are often not implemented for economic reasons. In Croatia, the common way of handling leachate at landfills is to recirculate it back into the body of the landfill. However, this method presents a danger of leakage into the environment, especially during periods of increased precipitation.
The water purification system belongs to the group of complex engineering systems in environmental protection. This paper focuses on the construction and management of complex engineering systems based on information and communication technologies (ICT) as well as methods and models of environmental informatics. Due to the investigated system's complexity, it is often impossible to be modelled with linear models. Instead, it requires more complex models that include multi-attribute functions, which is the model's credibility. Simulation modelling is one such method, which includes applying various mathematical and statistical models and tools necessary to shape individual entities' dynamics, behaviour, and attributes.
Complexity science deals with the nature of emergence, innovation, learning and adaptation of systems. In the early days of complexity research, the degree of complexity was defined by Kolmogorov [5] as "the amount of information needed to describe the system". In 1988, Hubka and Eder [6] classified complex technical systems for the first time. However, the classification focused on the technical system without humanistic-social complexity. "Why is a system complex and to what extent" [7] is one of the basic questions in the field of complex systems. It is important to note that there is no consensus on the best way to measure complexity. Lloyd [8] identified about 40 definitions of complex systems and grouped them according to the questions they address, such as the difficulty of describing or creating the system and the degree of organisation.
A proper measure of the system's complexity should consider its order rather than its randomness. In other words, the system's entropy should be small for a simple system with only a few dominant states. The complexity profile measures complexity by determining the amount of information required to describe the system at various observation scales [9].
In their research, Magee and de Weck [10] have highlighted the difference between engineering systems and other types of systems and the classification of engineering systems. The key difference between complex engineering systems and other complex systems lies in the humanistic-social component, which is present in engineering systems along with technical complexity (i.e., complex flow of information, energy, mass, and values). All complex engineering systems possess characteristics such as being real, open, artificial, dynamic, hybrid (i.e., a mix of continuous and discrete system management), having mixed control (i.e., autonomous and human-controlled elements or subsystems) and containing both technical and humanistic-social complexity.
The water purification system possesses all the characteristics of a complex engineering system. It exhibits technical complexity; it is real, it is open (it has a strong interaction with the environment), it is artificial (the work of people created it), it is dynamic (it can assume different states), it is hybrid (some parts work continuously and some discretely). Additionally, the system operates with mixed control, including the use of a process analyser and sampling by experts for current samples. The system is managed according to the hierarchically complex structure of employees, which encompasses the humanistic-social complexity of the system.
According to Soselia et al. [11], first of all, a conceptual framework for describing the simulated water treatment system must be chosen in developing a simulation model. This scheme should be based on a specific methodological approach describing the functional relationship of water purification systems [12]. Water treatment is a complex ongoing process. At the same time, in such a complex process, the presence of the operator (human) is unavoidable as a system chain. It requires using a system of comprehensive methodological approaches to survey water treatment systems.
In the case of modelling water treatment systems, according to van Gigch [13], the term "system" is a relative phrase because, in the system approach, a specific set of elements may only be seen as a small fraction of the broader system or subsystem. On the other hand, the same set may interest the researcher, and so this may be regarded as a system. In their research, Mesarovic and Takahara [14] claim that the scope of every simulation model dictates the characteristics of the challenge for which solutions have been developed. First, determining the scope of the wastewater treatment system is needed to identify all of its study and composition borders. The physical and causal link between its constituent fragments is determined while determining the system's boundaries.
Northrop [15] thinks that real-world complex systems modelling is a difficult task because three characteristics distinguish complex systems: 1) A complex system has many parts (or units, individuals, or subsystems); 2) These parts have many relationships and interactions, dependencies or competitions; and 3) The parts produce combined effects (emergence) that are not easily predicted and are frequently novel (desirable) or chaotic (undesirable). According to Bar-Yam [16], the main complexity elements in complex systems include emergence, self-organisation, behaviour, networks, evolution, adaptation, pattern formation and nonlinear dynamics.
A significant problem is developing an acceptable conceptual model to reflect a complex system's static structure and dynamic behaviour. It includes representing the system's entities' relevant qualities, functions, states, and inputs and outputs with interconnections and interfaces to exogenous systems. According to Mahmood et al. [17], combining such constructs into an effective, validated, and verified model cannot be easy.
Many complex systems in the actual world exhibit real-time, reactive, and probabilistic behaviour. Popovici and Mosterman [18] point out that the behavioural correctness of real-time systems is determined by the logical findings and the individual and collective physical time limitations for accessing, processing, and sending computed information. Aceto et al. [19] believe that reactive behaviour means that the system responds or reacts to external stimuli and progresses toward the desired goals. According to Olderog and Dierks [20], probabilistic systems display nondeterministic behaviour when representing random phenomena. A system with all these features is exceedingly complicated, and implementing models with verification and validation adds more complexity to the complex system.
Due to the variety of definitions for what constitutes integration and diverse modelling needs, numerous approaches have been developed to create models for a complex engineering system. The most common modelling approaches in environmental protection are [21]: system dynamics, Bayesian networks, coupled component models, agent-based models, and knowledge-based models. When choosing a modelling approach to be used, it is important to consider: the purpose of the model (such as prognostication, forecasting, decision-making, system understanding, social learning), the types of available data (qualitative, quantitative or both), and model's intended users. Knowledge-based or conceptual models for either approach can be a good starting for understanding the most important features of the system, as well as for identifying the key variables and factors.
Various modelling approaches have been used in the development of environmental management models. System dynamics was utilised to create models for coastal zone management, wastewater management and water resource management.
Chang et al. [22] present an example of using system dynamics for coastal zone management, demonstrating how the system dynamics model can solve the complex coastal zone management problem. For an integrated assessment of the problem, four socioeconomic, environmental, biological, and management subsystems collaborate with the system dynamic model configuration. The model identifies four critical management strategy variables: land development, wastewater treatment, and local fish consumption rate.
Fernández and Selma [23] provide an example of using system dynamics for wastewater management. They developed a dynamic model in their paper to analyse the key socioeconomic and environmental factors driving the entire system.
The system dynamics approach in system modelling and water resource management was used by Qin et al. [24]. They consider that existing water and environmental management models separately simulate socioeconomic, water infrastructure, and natural receiving water systems. Such models cannot effectively capture the interactions between economic and population growth, water resource supply and depletion, and environmental changes, particularly when analysing long-term urbanisation scenarios. In their paper, the authors developed a system dynamics and water environmental model to understand better the integrated socioeconomic and water management systems in a rapidly urbanising catchment. The socioeconomic component is an internal submodule of the overall system in their model. A water consumption and pollution load module, a water supply module, a wastewater treatment module, and a receiving water module are also included in the model.
Bayesian networks were employed in creating models for eutrophication, fish reduction and managing coastal lakes and estuaries. A Bayesian network is a graphical representation and probabilistic description of the relationships between variables in a system. The graphical structure explicitly expresses cause-and-effect assumptions, allowing a complex causal chain linking actions to outcomes to be factored into an articulated series of conditional relationships. These relationships can then be quantified independently using a submodel appropriate for the type and scale of information available. As Borsuk et al. [25] pointed out, this method is especially useful for ecological modelling because predictable patterns can emerge at different scales, necessitating various model forms.
According to Pollino et al. [26], Bayesian approaches can address environmental management modelling needs. However, many Bayesian networks developed for environmental management have been parameterised solely through knowledge elicitation. Unfortunately, data alone are frequently insufficient for parameterising Bayesian networks in environmental applications. As a result, researchers are becoming increasingly interested in parameterising Bayesian networks using data and elicited information. Pollino et al. [26] proposed a methodology for this process, focusing on parameterising and evaluating Bayesian networks using a risk assessment case study with native fish communities.
Increasing urban development and other human activities in coastal lake catchments can degrade them and cause conflicts between lake users and upstream communities. Many techniques, such as system dynamics, meta-modelling, and coupled component models, can be used to integrate the variables involved in such conflicts. Ticehurst et al. [27] describe a Bayesian network-based integrated framework model for assessing the sustainability of eight coastal lake-catchment systems off the coast.
Paired component models were used for regional development, watershed management, and nutrient reduction. The project of developing a spatial decision support system, which a regional council in New Zealand and several research organisations are co-developing, is described in the paper by Rutledge et al. [28]. The spatial decision support system integrates economic, environmental, and social factors, and it is concerned with biodiversity, economics, demography, land use change, and water resources. Climate change and external drivers at the global and national levels are also included to investigate their impact on future regional development.
River basin management entails deciding the desired levels of economic activity and ecosystem functioning in the catchment. As a result, data on measures' economic and ecological effects, and their spatial distribution, are required. In their paper, van der Veeren and Lorenz [29] propose the following tools to aid decision-making in river basins: 1) the linking of models and indicators to describe the economic and ecological effects of management actions, as well as their spatial distribution; and 2) a comprehensive evaluation framework to evaluate management actions on three objectives for sustainable river management. Cost-effectiveness, spatial equity, and environmental quality are examples of these. Environmental quality and cost-effectiveness are at odds, whereas spatial equity and cost-effectiveness are closely related. It necessitates a trade-off between costs and spatial equity on the one hand and environmental standards on the other.
Knowledge-based models were utilised in the development of water quality models, eutrophication models and water management models. A watershed is an intricate ecosystem; assessing it necessitates consideration of numerous issues and factors, and data are frequently lacking. According to Dai et al. [30], these characteristics indicate that a knowledge-based approximate reasoning approach is particularly useful for watershed assessment.
A bloom predictor model can be developed employing the fuzzy predictor based on the daily fluctuations of simple water quality parameters such as dissolved oxygen, oxidation-reduction potential, pH, and temperature. The fuzzy predictor's task is to recognise the possibility of a macroalgal population bloom based on the changing daily pattern of these variables. Such a predictor is built around fuzzy rules derived from experimental data and expert knowledge. The algorithm described in the paper by Marsili-Libelli [31] is general enough to be applied to any environmental classification problem in which short-term time patterns and long-term statistical variability should be considered together.
The development of a knowledge-based environmental decision support system to assist water managers with their decision-making tasks, according to Vellido et al. [32], entails assessing the impact of significant nutrient loads on the overall water quality and ecological status of stream ecosystems. Physical, chemical, and biological parameters are among the variables used in empirical data for the knowledge base. The data's complexity limits the amount and completeness of available information. The available data are explored and analysed using generative topographic mapping, a neural network-based model, for reconstruction, visualisation, and clustering.
According to the above, this research includes the development of a conceptual model for an entire, complex engineering system that purifies municipal wastewater to improve the quality of surface water based on models of system dynamics and knowledge-based models. This model is the basis for creating a conceptual system model for using municipal wastewater treatment systems to treat landfill leachate with adequate flow and water quality. The model of the newly formed system changes the quality of landfill leachate (transitional variable) based on the synergistic influence of independent variables that affect the transitional variables (concentration of pollutants in water), ultimately on the dependent variable (quality of surface water).
The model is designed to adapt to changes in independent, dependent and transitional variables. It enables the prediction of risks, such as areas where the system may completely fail, leading to material damage, environmental harm, and potential health impacts for individuals.
Research objectives are:
to design, optimise and validate the conceptual adaptive model of a system "sensitive" to changes in the operating regime,
to develop and validate a model of a water treatment system that cleans landfill leachate to surface water quality,
to establish a methodology for researching complex engineering systems, according to which two hypotheses were set:
H1: By introducing feedback into the newly developed adaptive model, the variability of the process is reduced,
H2: The values of the observed concentrations of organic matter at the exit from the system will not exceed the limit values defined by the legal regulations.
The development of the researched complex engineering system should be focused on achieving results that will reveal its sensitivity, that is, adaptation to changes in the system's operating regime and the variability of the concentration of the observed pollutants. In doing so, the aim is to create a model describing the water purification process by introducing feedback loops, which makes the system adaptive and self-regulating. The result of process implementation will lead (thereby) to a reduction in the variability of pollution concentrations and, thus, to improved quality of purified water.
In the vicinity of the waste disposal site is a system for purifying wastewater from the public drainage system. Using the existing system to treat landfill leachate is economically and ecologically profitable.
A conceptual model describes a part of the real world, an object system. Conceptual modelling starts from the specification of the data structure of the object system and the requirements for using the data. Conceptual models are created based on an idea about the structure and logic of the system or problem being modelled [33], and they are the basis for creating computer models. From the company for public water supply and public sanitation, actual water purification data for five years were obtained. This paper presents the water purification models from organic matter since the landfill's water is heavily contaminated.
Water oxidisability or total organic matter in water is considered an indicator of the level of organic matter present in water, i.e., water pollution. Because the amount of oxygen required to oxidise all soluble and particulate organic substances in water (chemical oxygen demand - COD) is calculated, its value is expressed in milligrams of oxygen per litre of water [mg/l]. Water organic matter oxidises with the strong oxidising agent potassium dichromate under acidic conditions. Dichromate consumption is proportional to the amount of organic matter in the water.
The results were reviewed and processed by the Listwise Deletion Method [34] because they belonged to the Missing at Random (MAR) data. According to Ibrahim et al. [35], the values are missing at random (MAR) when the missing data relates to a specific variable, such as an accidentally skipped answer from the questionnaire.
The Listwise Deletion Method, according to Gotal Dmitrovic et al. [36], provides very good matching results with the probability distributions for MAR data. For the credibility of the model, the actual behaviour of the system was embedded using mean weekly values of organic matter concentration at each control point, which were determined from a typical theoretical probability distribution obtained using the Stat::Fit package (ServiceModel v4.2.), Table 1.
Descriptive statistics and characteristic theoretical distributions of probability
| Parameter | The entrance (I) | The exit (S) |
|---|---|---|
| Theoretical distribution | Lognormal (-207; 6.63; 0.483) | Lognormal (4.68; 3.28; 0.576) |
| Data points | 261 | 260 |
| Minimum [mgO2/l] | 36.14 | 9.71 |
| Maximum [mgO2/l] | 1 947.43 | 146.86 |
| Mean [mgO2/l] | 641.14 | 36.09 |
| Median [mgO2/l] | 548.43 | 32.00 |
| Mode [mgO2/l] | 243.79 | 24.14 |
| Stand. deviation [mgO2/l] | 403.59 | 19.96 |
| Variance [(mgO2/l)2] | 162 882.00 | 398.53 |
| Coef. of variation [%] | 62.95 | 55.32 |
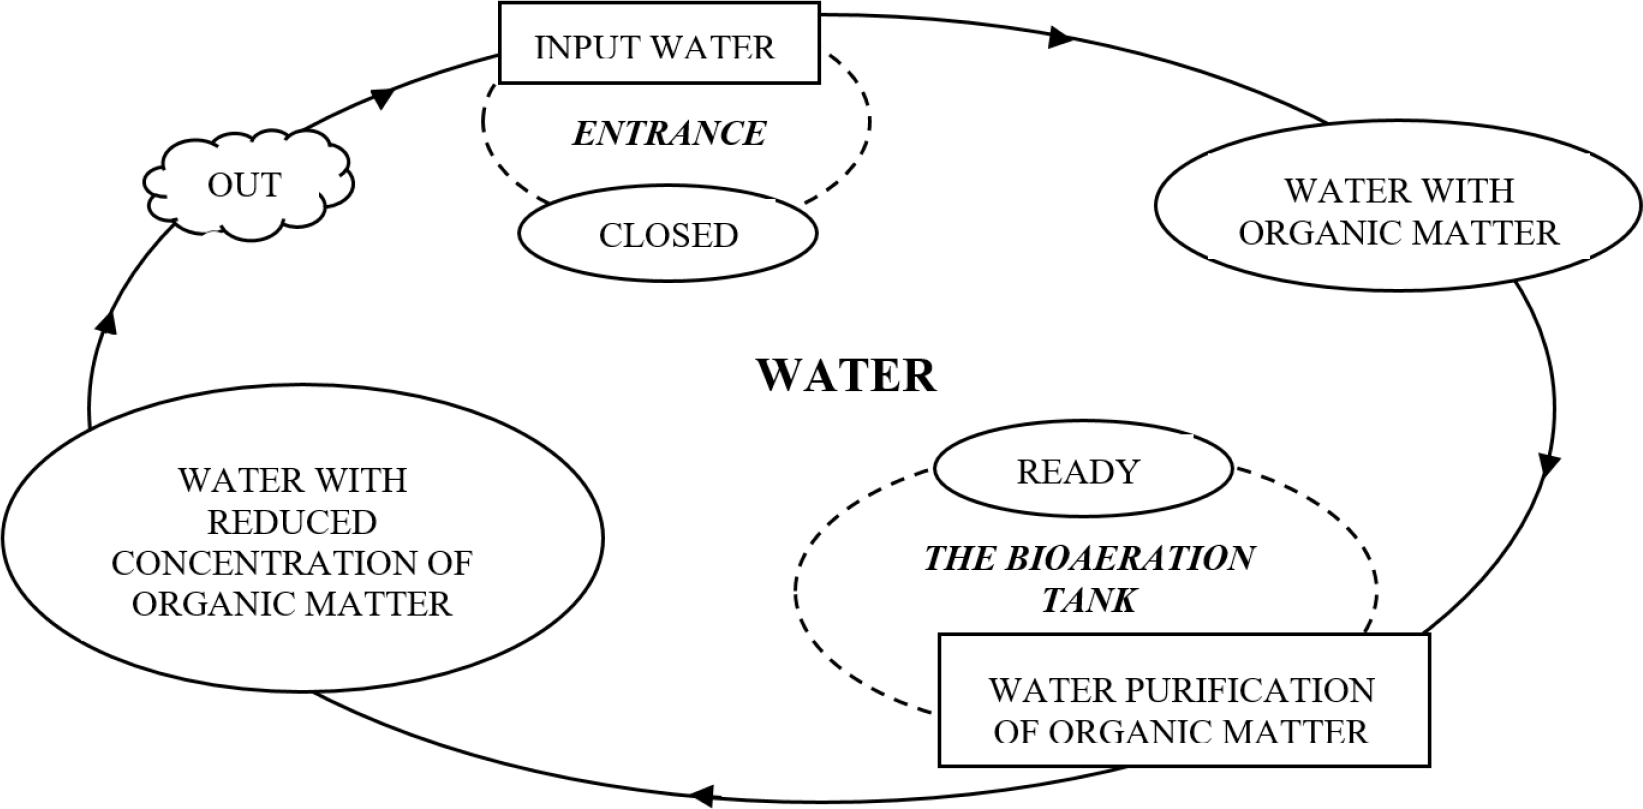
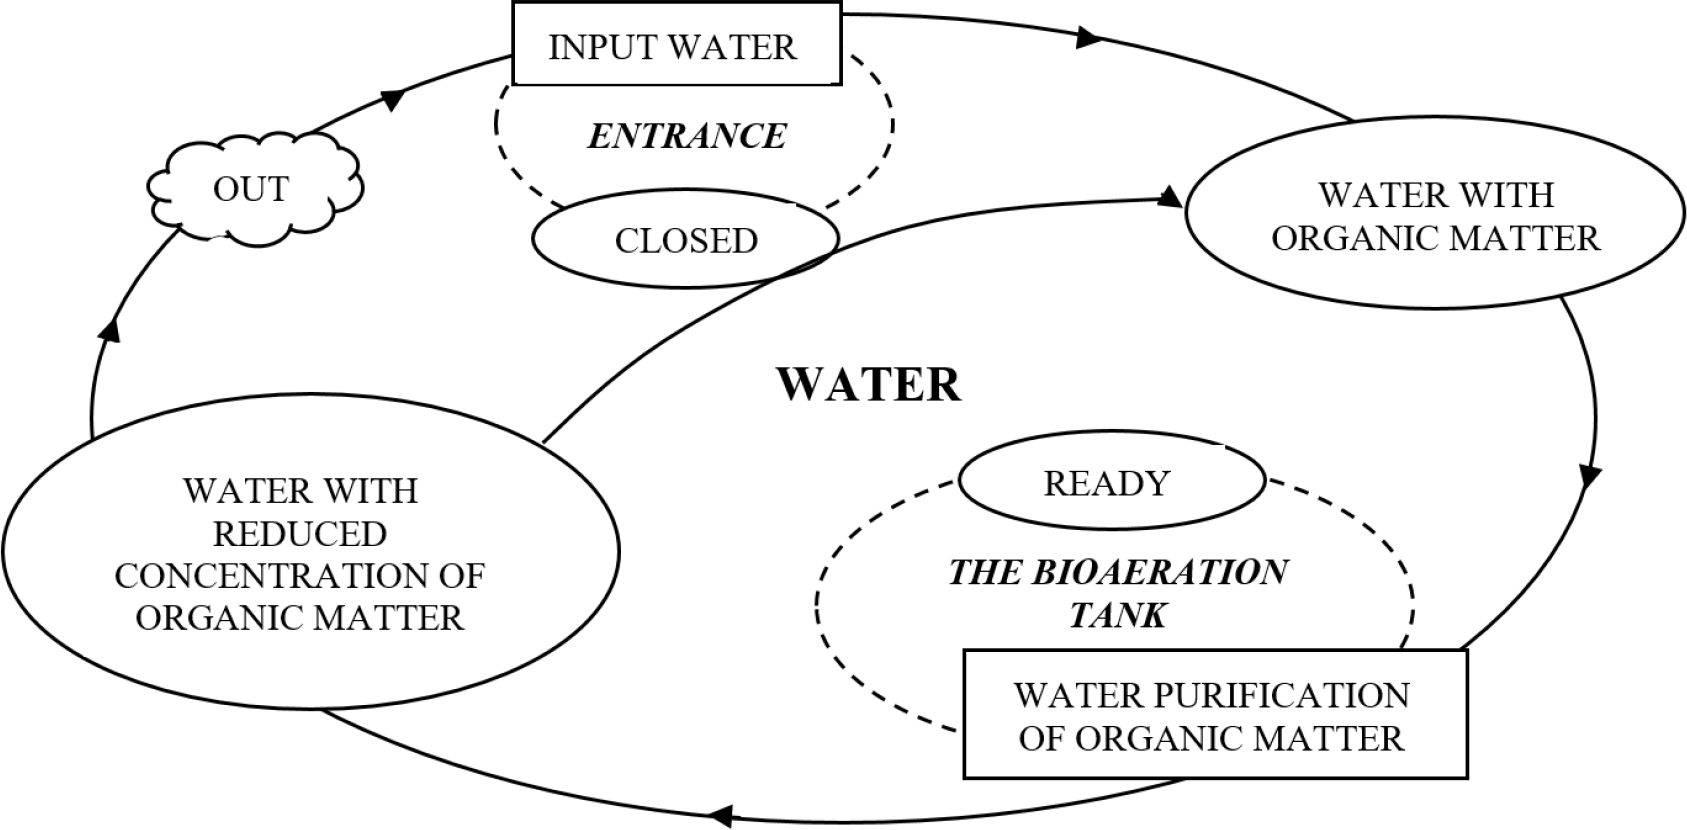
After data processing, a conceptual model of the real system was developed in the form of an Activity Cycle Diagram (ACD), Figure 1, and an Ishikawa diagram, Figure 2.
The Activity Cycle Diagram shows that water contaminated with organic matter enters the system when the entrance is open. In the bioaeration tank, the water is purified from organic matter. Water with a reduced concentration of organic matter leaves the system.
Activity Cycle Diagram (ACD)
Ishikawa diagram
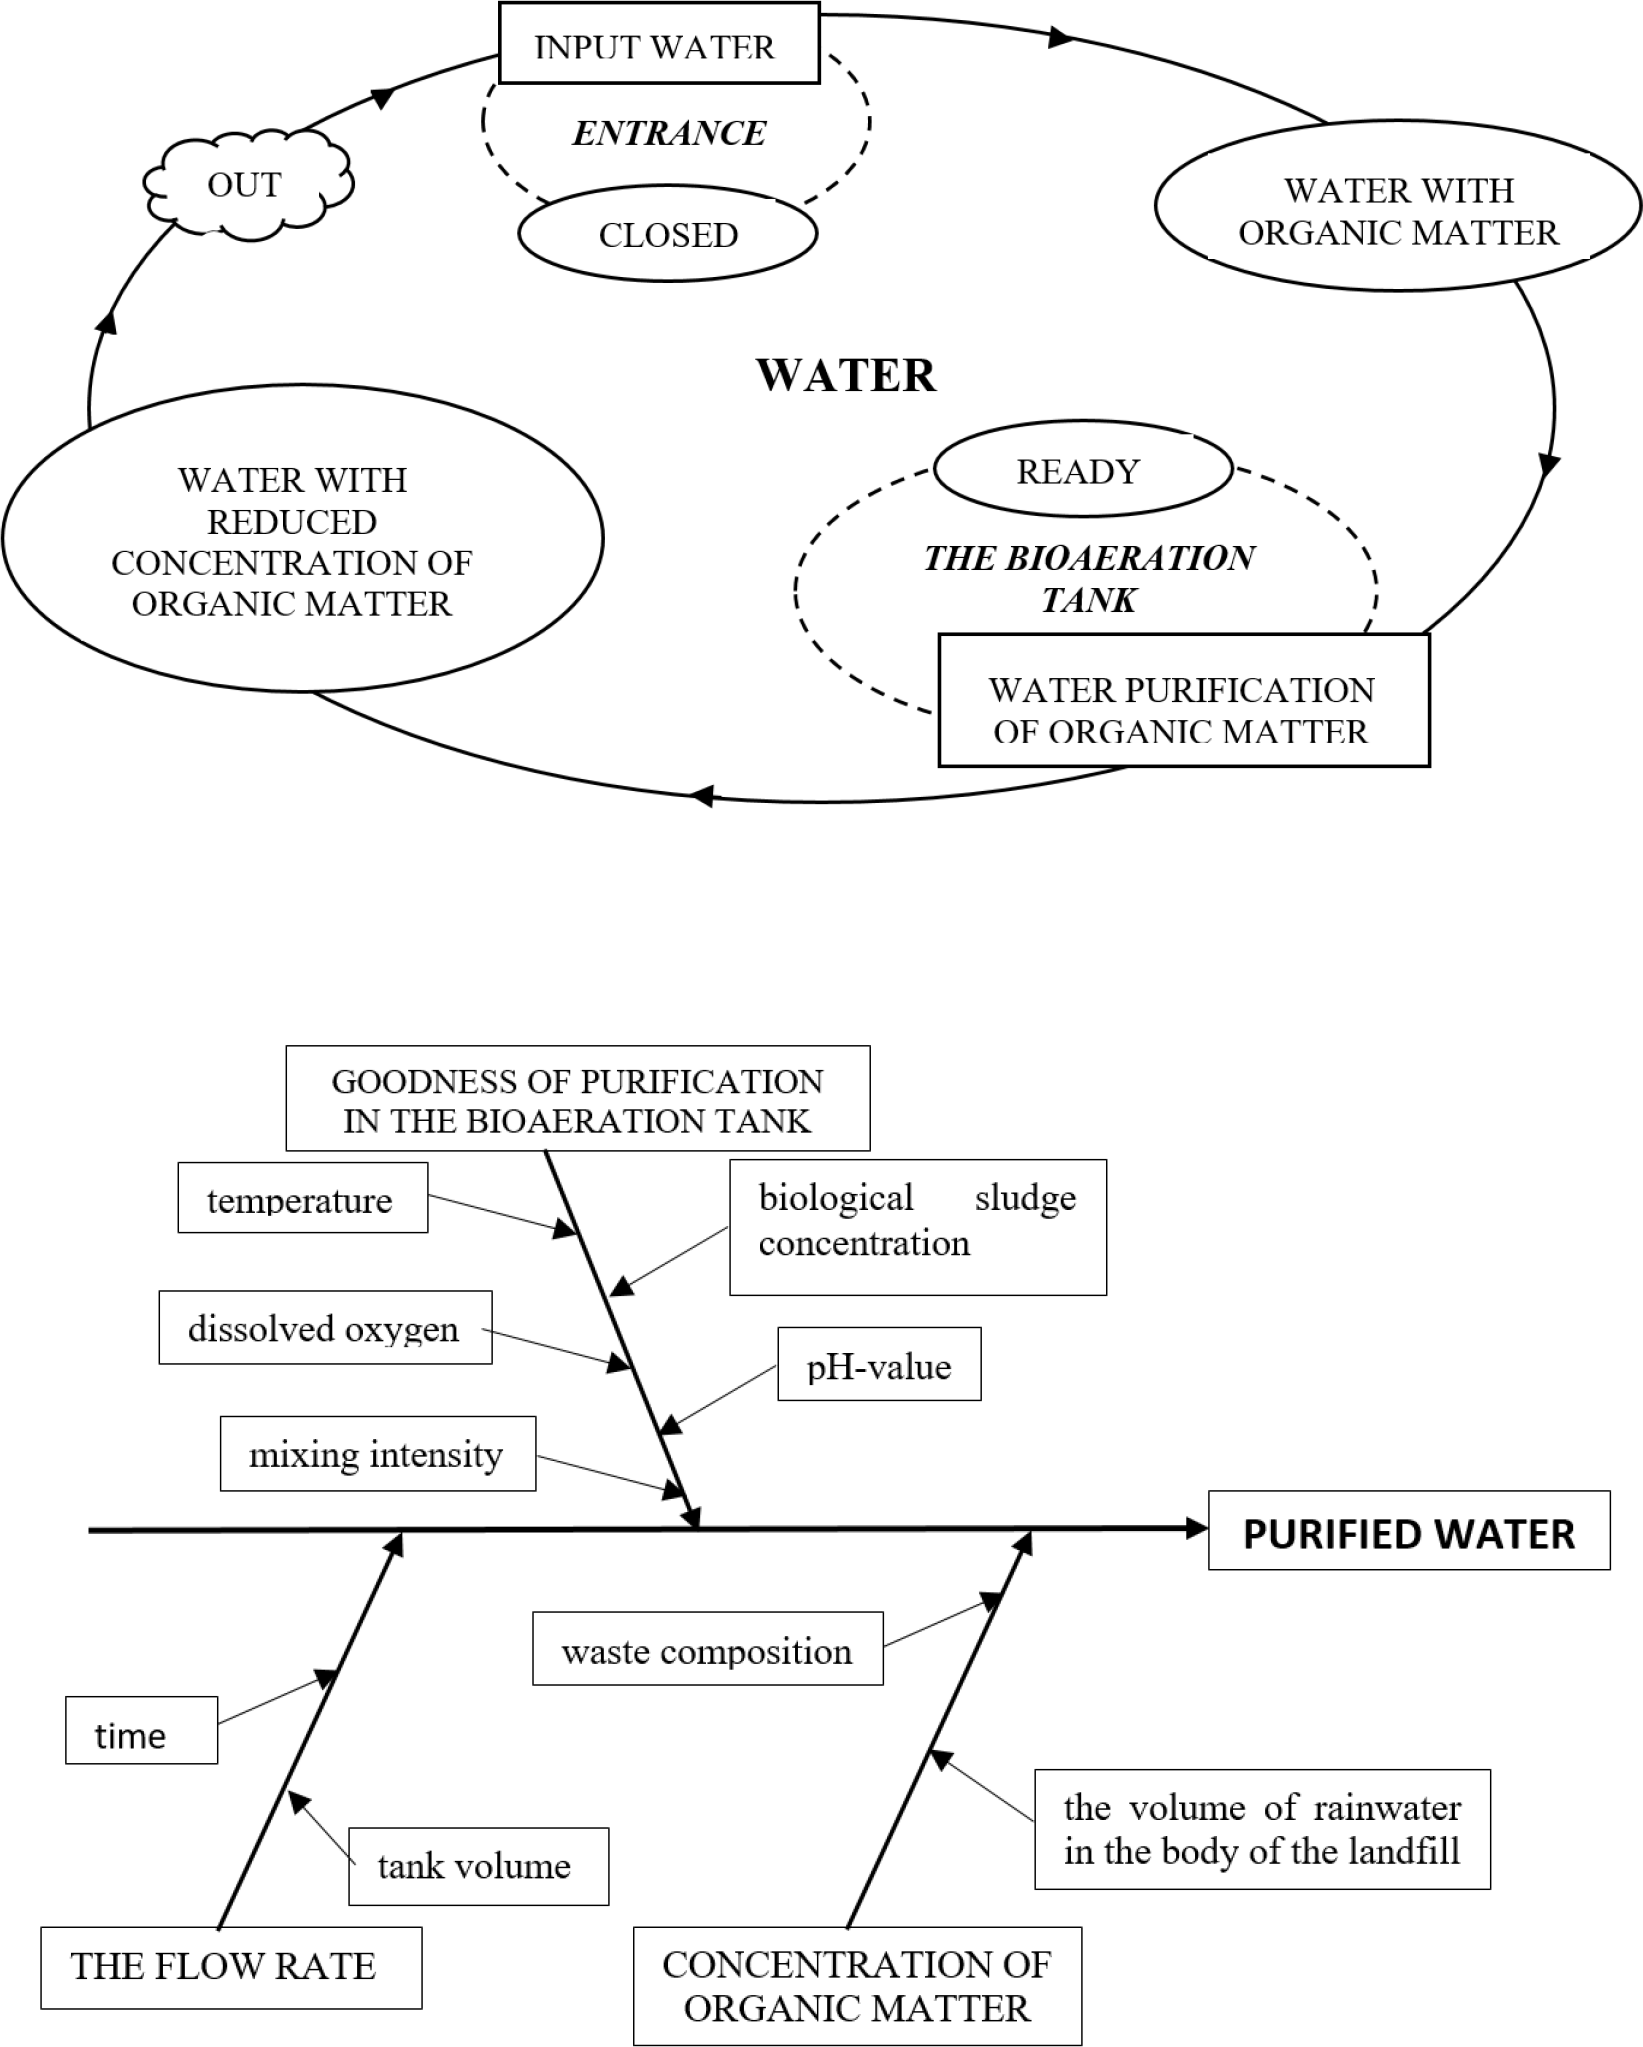
Ishikawa diagram (cause-and-effect diagram) is a causal diagram that shows a specific effect's causes [37]. Effect WATER PURIFICATION has the following causes: CONCENTRATION OF ORGANIC MATTER, THE FLOW RATE >and GOODNESS OF PURIFICATION IN THE BIOAERATION TANK. GOODNESS OF PURIFICATION IN THE BIOAERATION TANK has the most influence (cause) on water purification. Cause GOODNESS OF PURIFICATION IN THE BIOAERATION TANK has sub-causes: temperature, biological sludge concentration, dissolved oxygen, pH-value and mixing intensity. The composition of the waste (sub-cause waste composition) is mostly unchanged since it is mixed municipal waste, as well as the volume of the tank (sub-cause tank volume). It can be concluded from the Ishikawa diagram that the quality of water purification is most easily regulated by changing the time of purification (sub-cause time).
The mathematical model employing a system of differential equations solved by the Runge-Kutta method was developed based on the conceptual model. The differential equation of water purification [1] is presented as:
(1)
Where: I is input organic matter concentration [mg/l], S is output organic matter concentration [mg/l], dS/dt denotes changes in water cleanliness [mg/(l h)], K is the goodness of purification [1/h], 1/D is retention time [h] - the ratio of volume component [dm3] to flow rate [dm3/h] [38].
Initial equations in the system component are:
(2)
(3)
(4)
Written in the form of a difference equation:
(5)
The difference equation is generated using the Runge-Kutta method in each component of the developed system dynamics model. Under the assumption that t(0) = 0 and the output S(0) = 0, the Runge-Kutta (IV) method applies:
(6)
Where the details are as follows:
(7)
(8)
(9)
(10)
(11)
(12)
(13)
(14)
(15)
The goodness of purification is not constant due to seasonal changes, and it is displayed as a theoretical distribution (Table 2), showing the quotient of f(S) and S:
(16)
Theoretical probability distribution and descriptive statistics of the goodness of purification are presented in Table 2.
Parameters for the goodness of purification K
| Parameter | Value |
|---|---|
| Theoretical distribution | Lognormal (-21.3; 3.63; 0.239) |
| Data points | 260 |
| Minimum [1/day] | 0.86 |
| Maximum [1/day] | 55.72 |
| Mean [1/day] | 17.50 |
| Median [1/day] | 15.81 |
| Mode [1/day] | 15.12 |
| Stand. deviation [1/day] | 9.36 |
| Variance [1/day2] | 87.60 |
| Coef. of variation [%] | 53.47 |
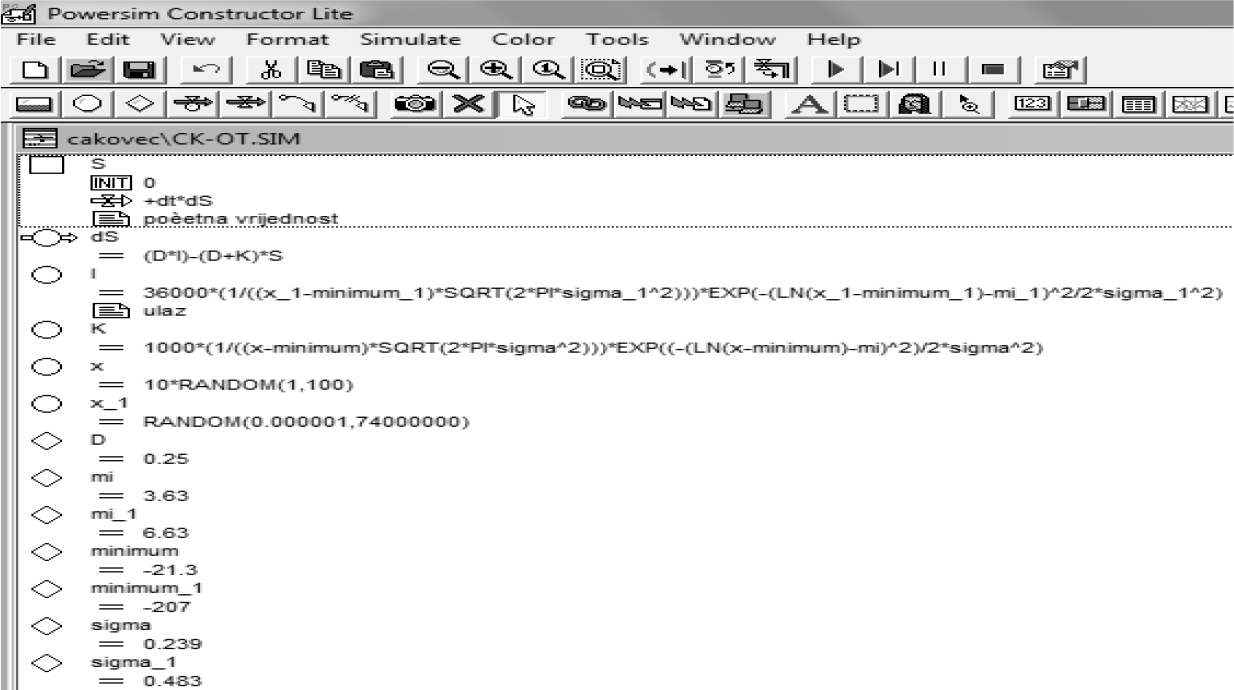
The model uses randomly selected values from a certain theoretical probability distribution (Lognormal (-207; 6.63; 0.483) for input concentration (I, Table 1) and Lognormal (-21.3; 3.63; 0.239) for the goodness of purification (K, Table 2)).
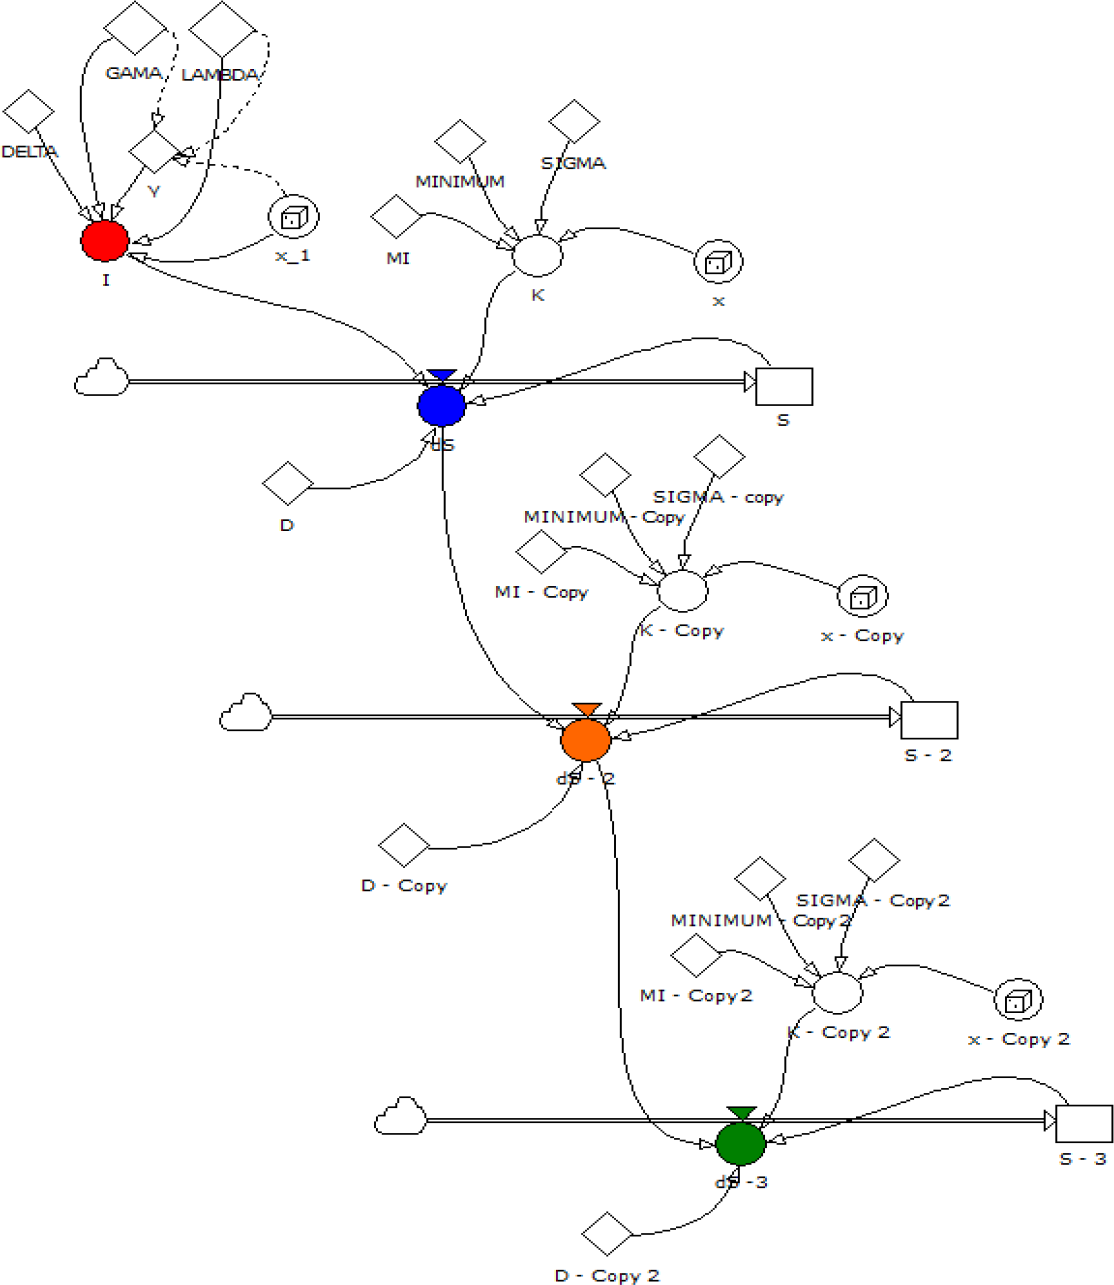
Simulation models of complex systems are being developed using system dynamics to reveal [39]: the long-term side effects of decisions, accelerate learning, develop an understanding of complex systems, and design structures and strategies for greater success. To develop the system dynamics model was used the Powersim Constructor program v. 2.51 (Figure 3 and Figure 4).
System dynamics model of the real system [1]
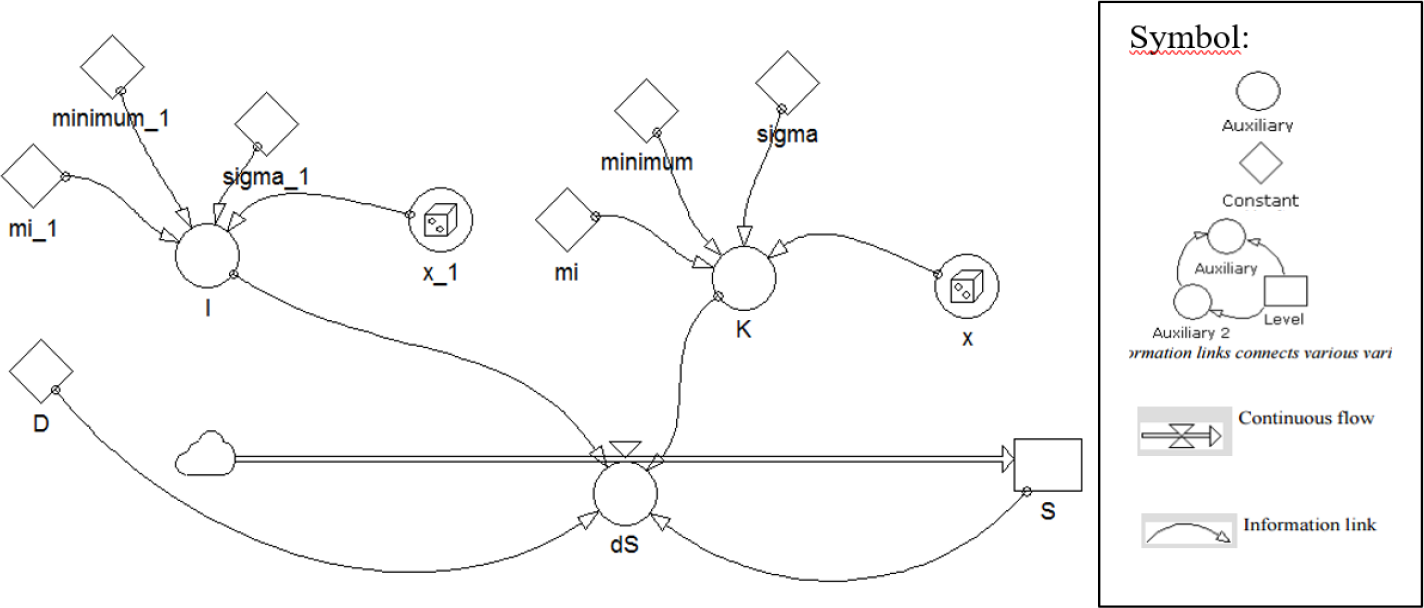
Each auxiliary variable (Auxiliary) is obtained using the values of the theoretical probability distribution and descriptive statistics (from Table 1 for input (I) and Table 2 for the goodness of purification (K)) and the random number generator. Retention time equals 1/D, where D is a constant, and in the real system, it is 0.25 days. Inside the output state change (dS) icon is a system of differential equations solved by the Runge-Kutta method (described in The Mathematical Model of the real system).
Pseudo code of the developed model [1]
A non-parametric Mann-Whitney U-test was applied to validate the model, given the presence of asymmetric non-Gaussian distributions because for analysing these, the Mann-Whitney U-test is effective [40]. Parameter Ui (i = 1, 2) is calculated according to [41]:
(16)
Where: ni is the size (in sample 1 or 2), and Ri is the sum of the ranks (in sample 1 or 2).
Parameters for the goodness of purification K [1]
| Bioaeration tank exit organic matter | Real system | Model | Mann-Whitney U test |
|---|---|---|---|
| Minimum [mgO2/l] | 9.71 | 10.09 | H0 |
| Maximum [mgO2/l] | 146.85 | 135.03 | Z = -1.62996 |
| Mean [mgO2/l] | 36.18 | 41.25 | p = 0.103106 |
A statistical non-parametric test (the Mann-Whitney U-test) has shown that the model mimics the real system well, i.e., there is no statistically significant difference between the set of real values and the values obtained by the model. The Mann-Whitney U-test was used to obtain the value of Z, which was compared with the critical value (from the table), and the test confirmed that there is no statistically significant difference.
After model validation, the actual system was designed to experiment with water purification from organic matter concentration in landfill leachate. The Pikornica landfill (in the north of Croatia) has two pools for collecting leachate from the landfill. The collected water is returned to the body of the landfill (recirculation). Parameters of leachate collected in pools are regularly monitored. The Pikornica landfill contains an inhomogeneous mixture of mixed municipal waste, which includes a very high organic component. The value of pH of water is neutral to slightly alkaline (up to 8.5). Some organic matter decomposes naturally in the body of the landfill. As the retention time increases, so does the degree of contamination with persistent organic compounds.
Anaerobic digestion progresses to methane production. Leachate contains a high degree of persistent organic compounds, and it needs to be purified for discharge into the recipient as this is the safest way to avoid environmental pollution. Descriptive statistics for the concentration of organic matter in pools over a year of testing were developed, and the theoretical probability distribution was determined (Table 4). Since the pools were filled alternately, the results of the chemical analysis were processed in total.
Descriptive statistics and characteristic theoretical distribution of probability in pools
| Parameter | Value |
|---|---|
| Theoretical distribution | Johnson SU (1.28×10+4; 4.89×10+3; 4.34; 3.86) |
| Data points | 24 |
| Minimum [mgO2/l] | 1 175 |
| Maximum [mgO2/l] | 9 770 |
| Mean [mgO2/l] | 5 815.71 |
| Median [mgO2/l] | 6 245.50 |
| Mode [mgO2/l] | 2 244.31 |
| Stand. deviation [mgO2/l] | 5 036 912.48 |
| Variance [mgO2/l]2] | 38.59 |
| Coef. of variation [%] | 24 |
Johnson SU is a continuous distribution with finite upper and lower bounds. The Johnson SU and the Lognormal (parameter of the real system) are transformations of the Normal distribution used to describe the most naturally occurring unimodal data set.
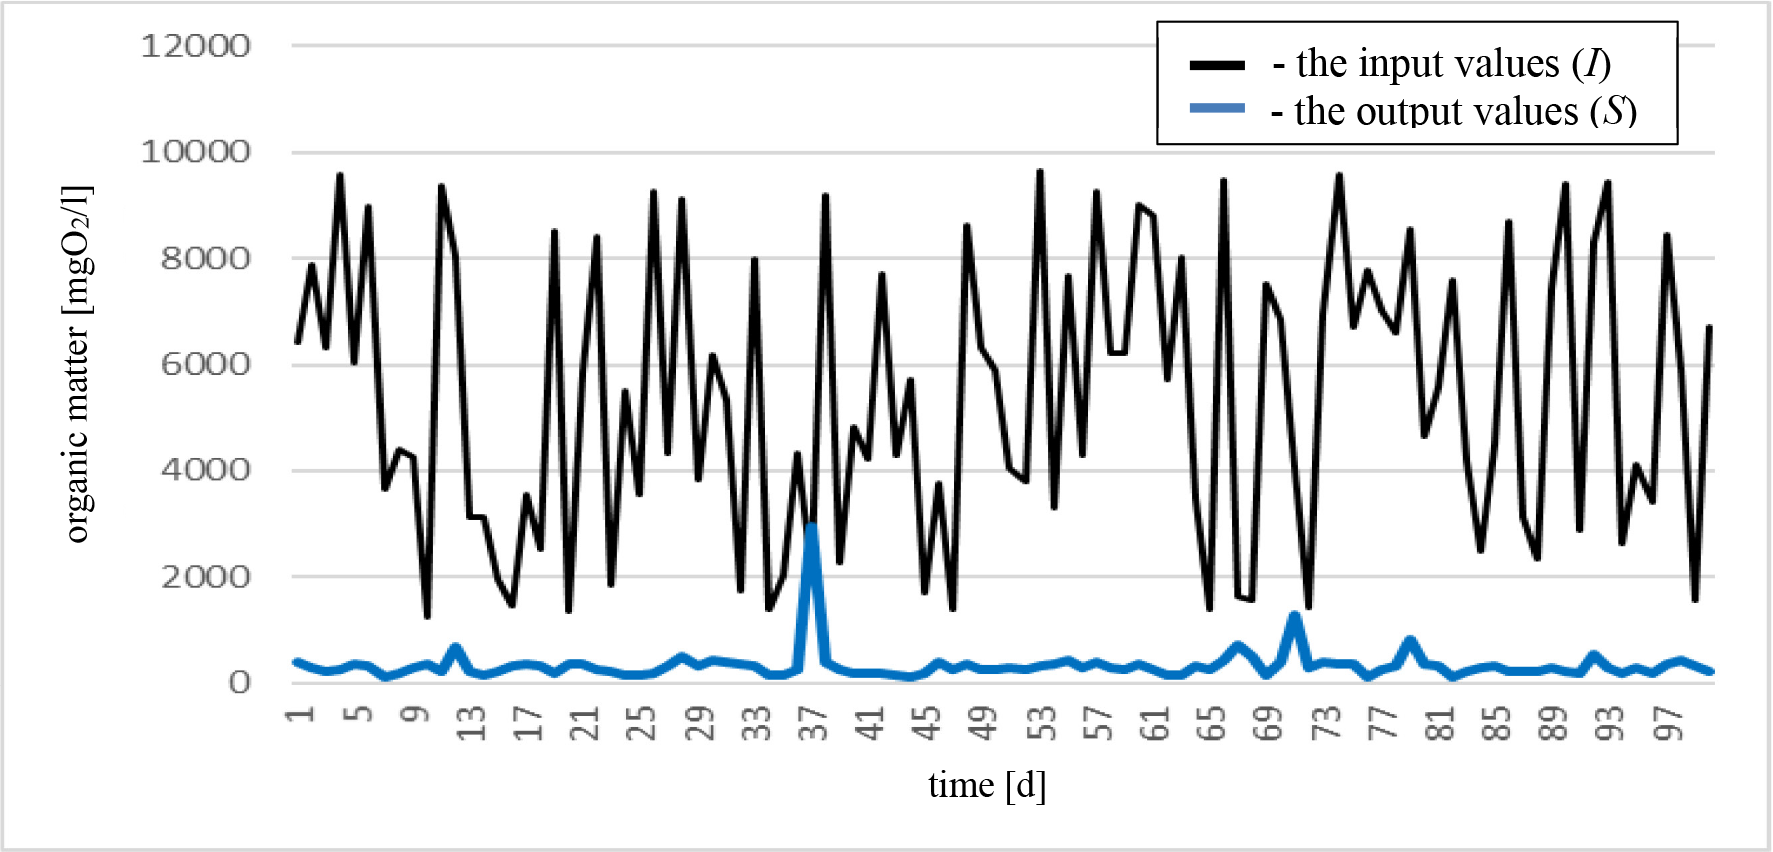
The input values in the model (I), according to the theoretical probability distribution (Table 4), are shown in Figure 5 (black line) and in the Table in the Appendix. The output values after the first purification (S), which were obtained based on the actual characteristics of the water purification system, are shown in Figure 5 (blue line) and in the Appendix.
Model results the input values (I) and the output values (S)
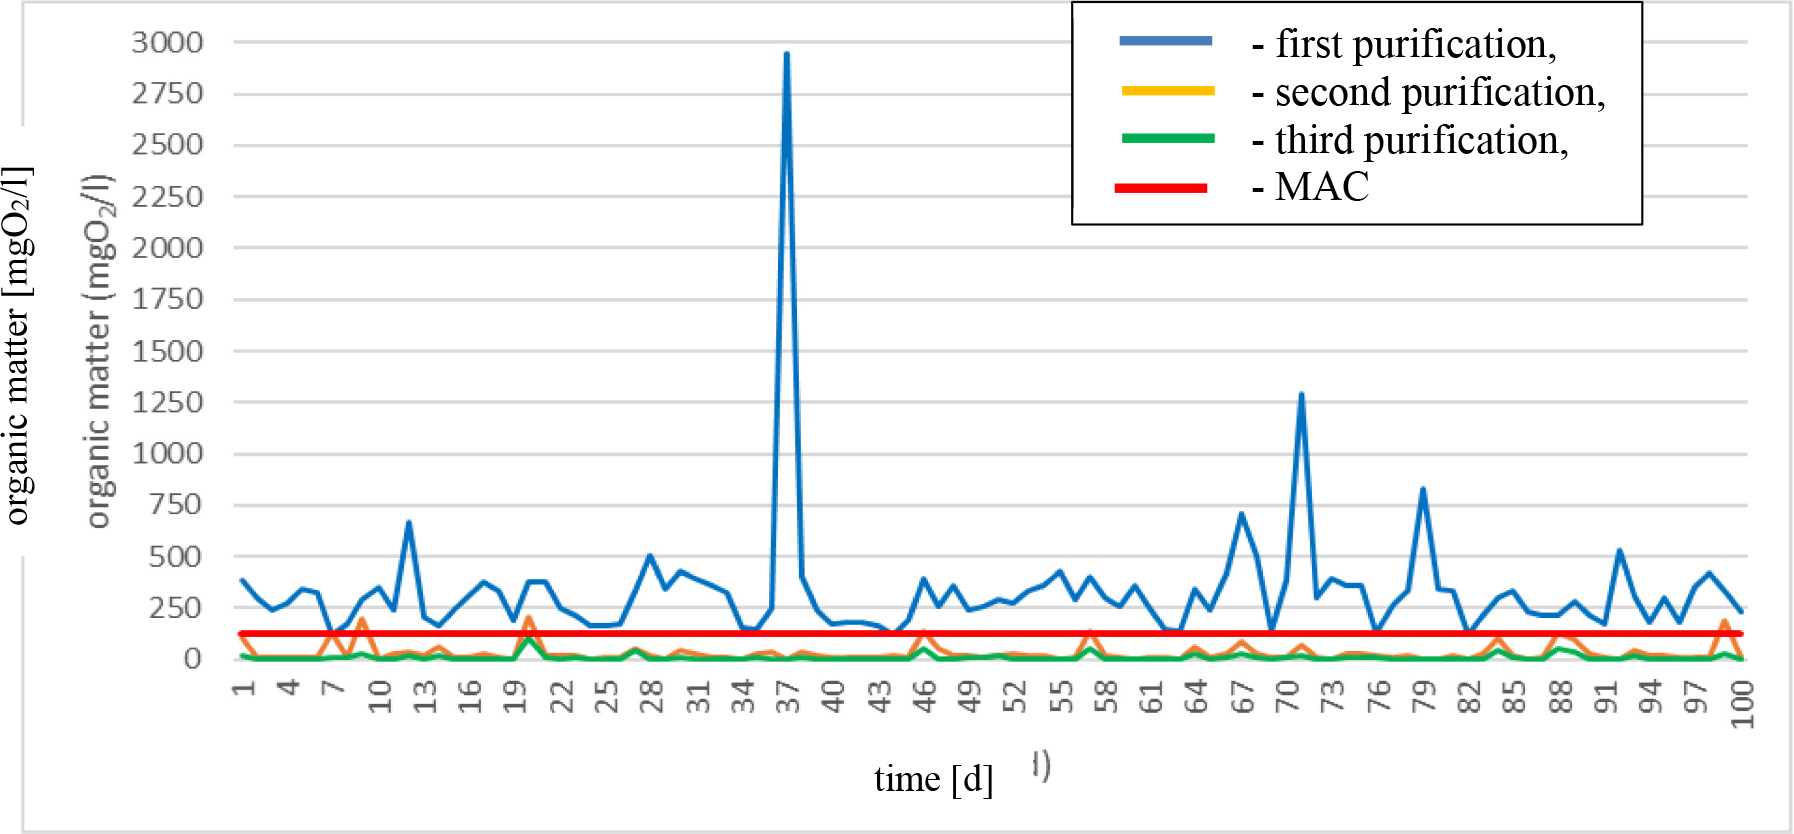
According to the Regulation on Limit Values of Wastewater Emissions of the Republic of Croatia, as well as Directive 2010/75/EU of the European Parliament and the Council of November 24, 2010, on industrial emissions (integrated pollution prevention and control), the maximum allowable concentrations value (MAC) is set at 125 mg O2/l. Based on these standards, the results indicate that a single leak through the bioaeration tank would not be sufficient. Figure 6 shows the output values for removing the organic matter after one, two, and three rounds of water purification in the bioaeration tank. The values are already mostly below the permissible limit after the second purification, but in 6% of cases, there is a "breach" of the border. Descriptive statistics of the results are given in Table 5.
Model results first, second, and third purifications
Descriptive statistics values of input concentrations (I), output concentrations after one purification in the bioaeration tank (S), after two purifications in the bioaeration tank (S-2), and after three purifications in the bioaeration tank (S-3)
| Parameter | I | S | S2 | S3 |
|---|---|---|---|---|
| Minimum [mgO2/l] | 1 262.78 | 117.06 | 0.34 | 0.04 |
| Maximum [mgO2/l] | 9 649.90 | 2 948.88 | 205.42 | 102.50 |
| Range [mgO2/l] | 8 387.12 | 2 831.82 | 205.08 | 102.46 |
| Mean [mgO2/l] | 5 407.97 | 332.83 | 30.38 | 9.11 |
| Median [mgO2/l] | 5 544.00 | 294.64 | 15.86 | 4.25 |
| Mode [mgO2/l] | 3 132.47 | - | 19.27 | 1.02 |
| Stand. deviation [mgO2/l] | 2 651.18 | 307.29 | 42.35 | 15.16 |
| Variance [(mgO2/l)2] | 7 028 743 | 94 424.86 | 1 793.38 | 229.93 |
| Coef. of variation [%] | 49.02 | 92.33 | 139.41 | 166.43 |
| The maximum allowable concentration (MAC)* [mgO2/l] | - | 125 | ||
| Above the maximum allowed concentration (MAC) [%] | 100 | 98 | 6 | 0 |
According to the Regulation on Limit Values of Wastewater Emissions of the Republic of Croatia, i.e., according to Directive 2010/75/EU of the European Parliament and the Council of November 24, 2010, on industrial emissions (integrated pollution prevention and control)
After the first passage through the bioaeration tank, the concentration of organic matter decreased to an average of 332.83 mg/l (median was 294.64 mg/l) from the initial 5 407.97 mg/l (median was 5 544.00 mg/l). Despite the substantial reduction in concentration, 98% of the remaining value still exceeds the legally permitted concentration for discharging into the watercourse.
The feedback is passed through the bioaeration tank once again, and the average value after the second pass was 30.38 mg/l (median is 15.86 mg/l). The difference between the arithmetic mean and the median suggests a right-skewed distribution, further confirmed by the high maximum value of 205.42 mg/l.
Adaptive, developed model (triple purification)
After the 2nd purification in the bioaeration tank, 6% of the value exceeds the legally permitted concentration for discharging into the watercourse. After the 3rd purification, the maximum value was 102.50 mg/l, meaning all the values were within the legal limit. The treatment of leachate from organic matter should consist of triple treatment through a bioaeration tank as it exists in the municipal wastewater treatment system (Figure 7).
According to the developed model, the existing system can purify the landfill water using feedback (Figure 8). The model is adaptive and adaptable to other values (and locations) and other types of pollution. The feedback has proved that an existing system for purifying urban municipal water can be used to purify leachate from organic matter.
Activity Cycle Diagram (ACD) of the developed model with feedback.
Databases and model development are crucial for analysis and data usage. The scientific community has highlighted the need for the conceptualisation and parameterisation of the system model before constructing the system itself [42].
Since only the purification of leachate from organic matter has been considered in the paper, it is also important to examine the possibility of purification from nitrogen and heavy metals. For such testing, the developed model can also be used to examine theoretical probability distributions for real data and incorporate these parameters in the model.
In addition to economic viability, since constructing a purification system is extremely expensive, there is also strong environmental cost-effectiveness. The existing large (city) treatment system has a lot of professional staff and is under constant supervision, and the possibility of an environmental incident has been minimised.
Untreated leachate poses a significant environmental risk, and any spillage on unprotected soil can result in pollution. Leachate recirculation, currently used as a disposal method at the Pikornica landfill, can only be a temporary solution due to the risk of spillage. Since moisture promotes the decomposition of mixed municipal waste, the recirculation of leachate, especially in summer, is useful indeed. However, there is a danger of leakage from the pool during the rainy season when large amounts of leachate are formed. Therefore, treating leachate to a level that allows for safe discharge into a natural recipient is essential. Building a new leachate treatment system is very expensive, especially when a nearby municipal wastewater purification system could be used instead.
Based on the originally developed model, the landfill water purifying system has been designed, demonstrating that data analysis and model development are crucial in researching complex technical systems. The advancement of computer sciences, particularly in data analysis and simulation modelling, has significantly improved technological methods.
This original model was developed to obtain information on landfill water purification. The input variables were used according to the results of the organic matter concentrations in the real wastewater. The model is adaptable and can also be used for other concentrations or studying other substances' contamination.
The methodology proposed in this paper for developing a landfill leachate purification model is based on simulation modelling as a useful method in environmental protection. After the development and validation, the adaptive model has shown that the existing real system can effectively purify landfill water of organic matter. This economically feasible approach demonstrates that simulation modelling and environmental informatics effectively contribute to solving environmental problems through computer-based solutions without posing unnecessary environmental risks.
To sum up, this research has achieved its goals:
A conceptual adaptive model of a system "sensitive" to changes in the operating regime has been designed, optimised, and validated,
A model of a water treatment system that cleans landfill leachate to improve surface water quality has been developed and validated,
A methodology for researching complex engineering systems has been established, which confirmed the hypotheses:
H1: By introducing feedback into the newly developed adaptive model, the variability of the process is reduced,
H2: The values of the observed concentrations of organic matter at the system''s exit will not exceed the limit values defined by the legal regulations.
- The Development of Conceptual, Mathematical and System Dynamics Model for Food Industry Waste-water Purifying System, 2015, https://jios.foi.hr/index.php/jios/article/view/984, Online
- ,
Tools for ThinkingModelling in Management Science ,Journal of the Operational Research Society , Vol. 48 (11),pp 11501150 , 1997, https://doi.org/https://doi.org/10.1057/palgrave.jors.2600969 - ,
Development of a complex system models in mixed municipal waste bales ,IOP Conf Ser Earth Environ Sci , Vol. 776 (1),pp 012008 , 2021, https://doi.org/https://doi.org/10.1088/1755-1315/776/1/012008 - ,
A combined treatment of landfill leachate using calcium oxide, ferric chloride and clinoptilolite ,Journal of Environmental Science and Health , Vol. 46 (3),pp 323328 , 2011, https://doi.org/https://doi.org/10.1080/10934529.2011.539118, Part A - ,
Combinatorial foundations of information theory and the calculus of probabilities ,Russian Mathematical Surveys , Vol. 38 (4),pp 2940 , 1983, https://doi.org/https://doi.org/10.1070/RM1983v038n04ABEH004203 - , , Theory of Technical Systems, 1988
- ,
, What is Complexity? - The philosophy of complexity per se with application to some examples in evolution, , 1995 - ,
Measures of complexity: a nonexhaustive list ,IEEE Control Systems Magazine , Vol. 21 (4),pp 78 , 2001, https://doi.org/https://doi.org/10.1109/MCS.2001.939938 - ,
MULTISCALE COMPLEXITY/ENTROPY ,Adv Complex Syst , Vol. 07 (01),pp 4763 , 2004, https://doi.org/https://doi.org/10.1142/S0219525904000068 - ,
3.1.3 Complex System Classification ,INCOSE International Symposium , Vol. 14 (1),pp 471488 , 2004, https://doi.org/https://doi.org/10.1002/j.2334-5837.2004.tb00510.x - ,
About Simulation Modelling of Water Purification Process. , , https://doi.org/https://doi.org/621.203(05)/1 - ,
Simulation Modeling in Operations Management: A Sampling of Applications , 2003, https://doi.org/https://doi.org/12771123 - , , System Design Modeling and Metamodeling, 1991
- ,
General systems theory: Mathematical foundations ,Adv Math (N Y) , Vol. 20 (2),pp 285 , 1976, https://doi.org/https://doi.org/10.1016/0001-8708(76)90196-1 - , , Introduction to Complexity and Complex Systems, 2014
- ,
General Features of Complex Systems ,UNESCO Encyclopedia of Life Support Systems , 2002 - ,
An Integrated Modeling, Simulation and Analysis Framework for Engineering Complex Systems ,IEEE Access , Vol. 7 ,pp 6749767514 , 2019, https://doi.org/https://doi.org/10.1109/ACCESS.2019.2917652 - , , Real-Time Simulation Technologies: Principles, Methodologies, and Applications, 2017
- , , Reactive Systems: Modelling, Specification and Verification, 2007
- , , Real-Time Systems: Formal Specification and Automatic Verification, 2008
- ,
Selecting among five common modelling approaches for integrated environmental assessment and management ,Environmental Modelling & Software , Vol. 47 ,pp 159181 , 2013, https://doi.org/https://doi.org/10.1016/j.envsoft.2013.05.005 - ,
A system dynamic based DSS for sustainable coral reef management in Kenting coastal zone, Taiwan ,Ecol Modell , Vol. 211 (12),pp 153168 , 2008, https://doi.org/https://doi.org/10.1016/j.ecolmodel.2007.09.001 - ,
The dynamics of water scarcity on irrigated landscapes: Mazarrón and Aguilas in south-eastern Spain ,Syst Dyn Rev , Vol. 20 ,pp 117137 , 2004, https://doi.org/https://doi.org/10.1002/sdr.290 - ,
An integrated model for water management in a rapidly urbanising catchment ,Environmental Modelling & Software , Vol. 26 (12),pp 15021514 , 2011, https://doi.org/https://doi.org/10.1016/j.envsoft.2011.07.003 - ,
A Bayesian network of eutrophication models for synthesis, prediction, and uncertainty analysis ,Ecol Modell , Vol. 173 (23),pp 219239 , 2004, https://doi.org/https://doi.org/10.1016/j.ecolmodel.2003.08.020 - ,
Parameterisation and evaluation of a Bayesian network for use in an ecological risk assessment ,Environmental Modelling & Software , Vol. 22 (8),pp 11401152 , 2007, https://doi.org/https://doi.org/10.1016/j.envsoft.2006.03.006 - ,
A Bayesian network approach for assessing the sustainability of coastal lakes in New South Wales, Australia ,Environmental Modelling & Software , Vol. 22 (8),pp 11291139 , 2007, https://doi.org/https://doi.org/10.1016/j.envsoft.2006.03.003 - ,
Choosing Regional Futures: Challenges and choices in building integrated models to support long-term regional planning in New Zealand ,Regional Science Policy & Practice , Vol. 1 (1),pp 85108 , 2008, https://doi.org/https://doi.org/10.1111/j.1757-7802.2008.00006.x - ,
Integrated economicecological analysis and evaluation of management strategies on nutrient abatement in the Rhine basin ,J Environ Manage , Vol. 66 (4),pp 361376 , 2002, https://doi.org/https://doi.org/10.1006/jema.2002.0556 - ,
A knowledge-based model of watershed assessment for sediment ,Environmental Modelling & Software , Vol. 19 (4),pp 423433 , 2004, https://doi.org/https://doi.org/10.1016/S1364-8152(03)00158-0 - ,
Fuzzy prediction of the algal blooms in the Orbetello lagoon ,Environmental Modelling & Software , Vol. 19 (9),pp 799808 , 2004, https://doi.org/https://doi.org/10.1016/j.envsoft.2003.03.008 - ,
Exploring the ecological status of human altered streams through Generative Topographic Mapping ,Environmental Modelling & Software , Vol. 22 (7),pp 10531065 , 2007, https://doi.org/https://doi.org/10.1016/j.envsoft.2006.06.005 - ,
Applied Simulation Modeling , 2003 - ,
Missing data ,Eur Radiol , Vol. 16 ,pp 966 , 2005, https://doi.org/https://doi.org/10.1007/s00330-005-0141-x - ,
Missing-Data Methods for Generalised Linear Models ,J Am Stat Assoc , Vol. 100 (469),pp 332346 , 2005, https://doi.org/https://doi.org/10.1198/016214504000001844 - ,
Missing data problems in non-Gaussian probability distributions ,Informatologija , Vol. 49 , 2016 - ,
Guide to quality control, kaoru ishikawa, the asian productivity association, revised English edition, 1984, No. of pages: 226 (Available in Western Europe and North America from Unipub, New York) ,Qual Reliab Eng Int , Vol. 1 (3),pp 215215 , 1985, https://doi.org/https://doi.org/10.1002/qre.4680010318 - ,
Appliance of Simulation Modelling in Waste-water Treatment ,International Journal of Environmental Science and Development , Vol. 10 (12),pp 435439 , 2019, https://doi.org/https://doi.org/10.18178/ijesd.2019.10.12.1212 - Business Dynamics, System Thinking and Modeling for a Complex World, 2000, http://lst-iiep.iiep-unesco.org/cgi-bin/wwwi32.exe/[in=epidoc1.in]/?t2000=013598/(100)
- ,
On a Test of Whether one of Two Random Variables is Stochastically Larger than the Other ,The Annals of Mathematical Statistics , Vol. 18 (1),pp 5060 , 1947, https://doi.org/https://doi.org/10.1214/aoms/1177730491 - , , Biostatistical analysis,, 1999
- ,
The Perspectives of Environmental Informatics and Systems Analysis ,Journal of Environmental Informatics , Vol. 1 (1),pp 17 , 2003, https://doi.org/https://doi.org/10.3808/jei.200300001