


Both passive and active control methods can be used to change the orientation of a mechanical system [1]. Each system has pros and cons, especially when it comes to how much it costs, how reliable it is, how much energy it uses, how much maintenance it needs, and how well it works overall [2]. Passive devices are stable by nature and don't need any outside energy to work. They are easy to set up, usually have a simple structure, cost less, and require less equipment to set up [3]. However, the passive control performance is less than optimal because it cannot adapt to the ever-changing excitation [4].
Active control systems, on the other hand, have to get all of their power from outside to run their actuators and control systems. In many situations, these systems need a lot of resources, so they are expensive and can be unstable when sensors break, especially in systems with centralized control [1].
Orientation control using active control generally uses an electric motor as the primary actuator. Active control systems are the right choice for orientation control that requires high speed and precision, such as rocket direction and stability control [5], [6], track settings, and satellite synchronization [7]. In addition, active control systems are also widely used in orientation control with low speed and do not require high accuracy, such as orientation control of solar panel platforms. Some orientation control techniques have been applied to single-axis and dual-axis solar tracking systems to improve performance, particularly from energy gain [8]. For instance, Huang et al. created a 1-axis, 3-position solar tracking system in which the trackers can only operate at three different angles. This tracker design uses a DC motor to rotate the solar panel platform. The movement of the platform is regulated by time using IC [9].
Chin CS et al. developed a single-axis orientation control system with an east-west rotation. This platform system consists of a PV panel, servo motor, battery, charger, two light sensors (LDR), an external load, and a microcontroller. The platform rotates automatically based on sunlight detected using two LDR sensors at night; the system does not operate to reduce energy consumption. This orientation control system was pre-modeled using MATLAB™/ Simulink™ [10].
Al-Mohamad used a programmable logic controller (PLC) to make a system for controlling the orientation of a single-axis solar panel platform. The PLC is used to control the movement mechanism of the platform. Monitoring the operation process of this solar panel platform orientation system can be done with a personal computer [11].
Oner et al. designed a platform control system for a two-axis solar tracker. A spherical motor, which is under the control of a microcontroller, moves the platform. This spherical motor has the ability to move across the horizontal and vertical axes. When compared to using other motors, a minimum of one motor is required for each axis [12]. Yao et al. also used a two-axis orientation control system. Automatic tracking dual axis system with hybrid strategy, i.e., normal tracking strategy and daily adjustment strategy using time-based control as well as sensor-based control. A high degree of accuracy is not important, so a simple daily adjustment strategy is used [13].
The amount of energy that the orientation control system uses is a big part of its development. The control strategy must reduce energy costs while maintaining service quality [14]. The use of a control system oriented towards low energy consumption is the reason for developing a passive control system. But on the other hand, passive controllers have disadvantages, especially the inability to respond to disturbances that arise and the low ability to change orientation at large deviations [15], [16].
One of the main reasons for the high amount of power used is that electric motors are used as the main actuators in active control. The average daily energy consumption of single-axis actuators is estimated to be about 2%-3% of the energy generated [17]. Several studies have shown that single-axis solar tracking can increase the energy produced by 12-20% compared to fixed PV systems [2]. This energy consumption will be required for each weather condition [18]. The use of actuators as prime movers needs to be a concern, especially in controlling extensive mass mechanical systems, which will require actuators that have tremendous power.
Based on this fact, it is very important to come up with a new way to control the orientation of a mechanical system using a low-energy mechanism. The new plan is to use semi-active control with ways to control mass, stiffness, and damping [19]. Active control devices use more energy than semi-active devices, but semi-active devices don't need an outside power source because they can store energy locally, like in batteries.
Semi-Active Stiffness Dampers (SASD) adjust valve openings to control oil flow. and adjust the damping coefficient in real time [20], [21]. A semi-active control system has also been applied to orientation control using additional mass. The test is carried out on a solar panel platform, the additional mass is placed on the platform, and the value is fixed by changing the additional mass’s position. The use of this mechanism requires very little energy consumption [22].
This study proposes a semi-active control strategy for low speed control of the platform orientation. It focused on coarse positioning of the platform orientation by employing a low-power secondary driver, therefore making it more simple and energy-efficient. In order to implement a low-power secondary driver, additional moment approaches are implemented. The additional moment is generated from a changes in the location of the platform center of gravity. Therefore, the platform become unbalanced and resulting in a change in the platform orientation. The supporting spring are used to support and stabilize the platform dynamic during the orientation change.
This section will describe a semi-active control system model, equipment design and specifications, simulation, as well as experimental procedures to control the orientation of the solar panel platform. Control is done by adjusting the additional mass weight.
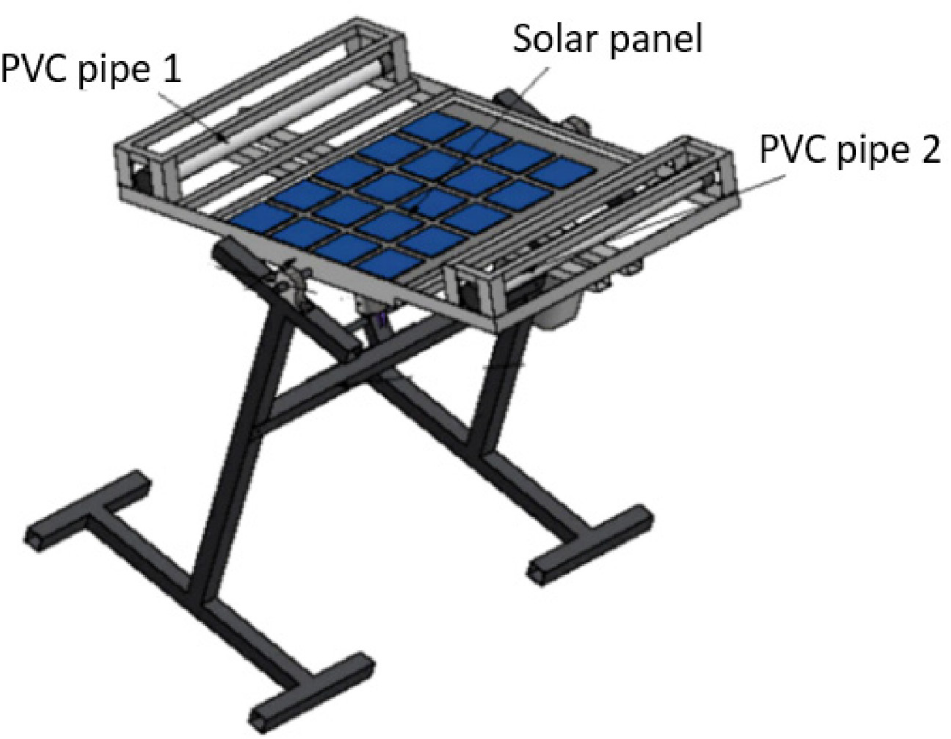
The model of a semi-active control system applied to control the orientation of the solar panel platform is shown in Figure 1. Several dynamic parameters must be controlled, namely mass, stiffness, and damping. The mass used is water that can be weighed and placed in a PVC pipe as a reservoir on both sides of the solar panel platform.
Solar panel platform orientation control model
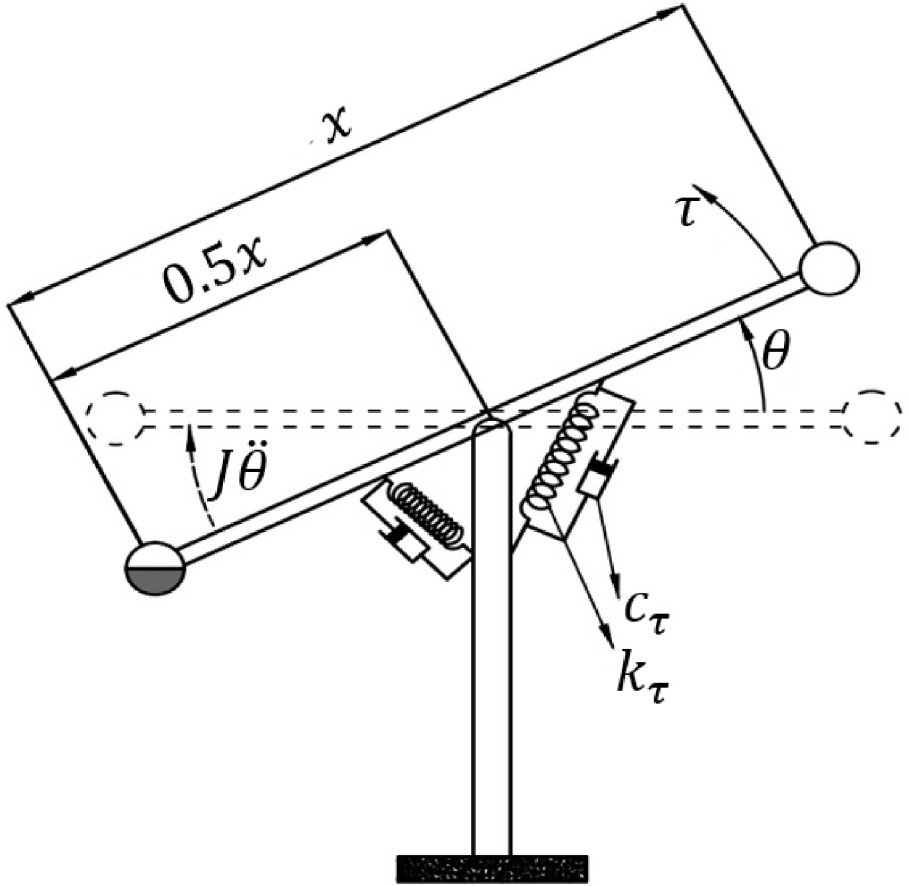
Assuming the mass moves with a small θ angle, the equation of motion can be expressed as in eq. (1):
(1)
(2)
J, cτ, kτ, and τ, respectively, are moment of inertia in kgm2, equivalent rotational damping coefficient in Nm/rad/s, equivalent rotational stiffness in Nm/rad, and driving torque in Nm. While , and respectively are angular acceleration and angular velocity respectively. From eq. (2), mam as the value of the additional mass in kg, x is platform length in m, and g as the acceleration of gravity in m/s2. The driving torque is affected by the additional mass.
The additional mass is water and was placed in reservoirs at the left and right sides of the solar panel. The solar panel platform with a fixed position from the equilibrium point which is 0.5x. The moment of inertia of the solar panel platform whose value is obtained based on eq. (3):
J = Jplatform + Jadditional mass
(3)
mpf in kg is the mass of the platform, x in m is the length of the platform, and y in m is the width of the platform. kτ as the equivalent rotational stiffness can be calculated analytically from the linear spring stiffness value. Figure 2 shows θ as the deflection angle (degree) of the platform Fk is the resultant spring force in N. Fkx is the spring force on the horizontal axis in N, and Fky is the spring force on the vertical axis in N. The torque value τs produced by the spring can be calculated using eq. (4):
(4)
Orientation control system free body diagram
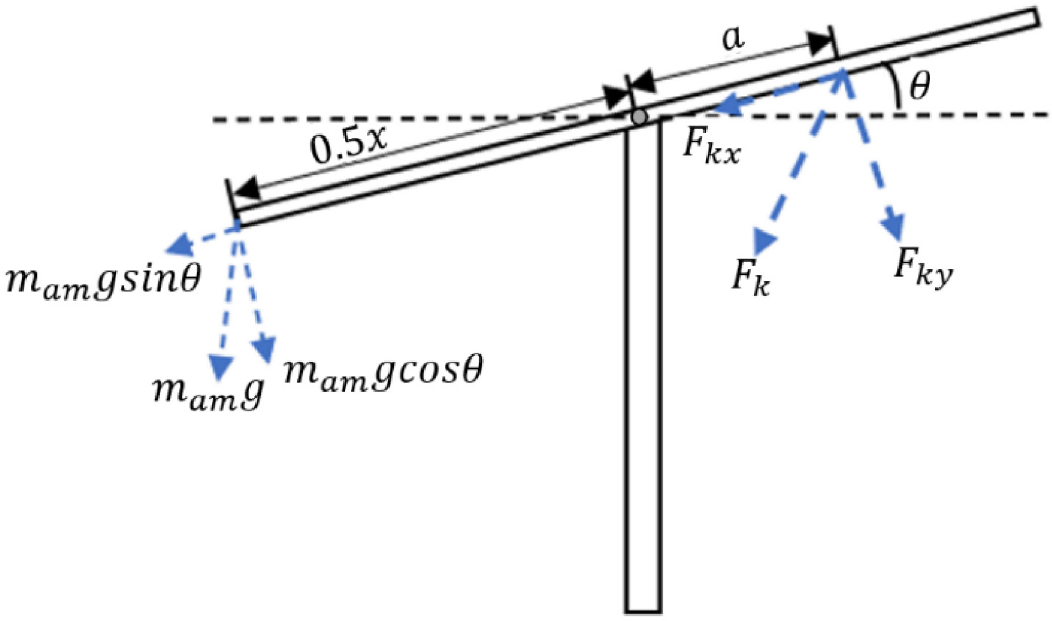
The distance between the platform’s center and the additional mass’s position is 0.5x. a is the position of the spring’s end of the platform’s horizontal frame, and b is the position of the end of the spring on the solar panel support pole, as shown in Figure 3.
Geometry model of spring condition
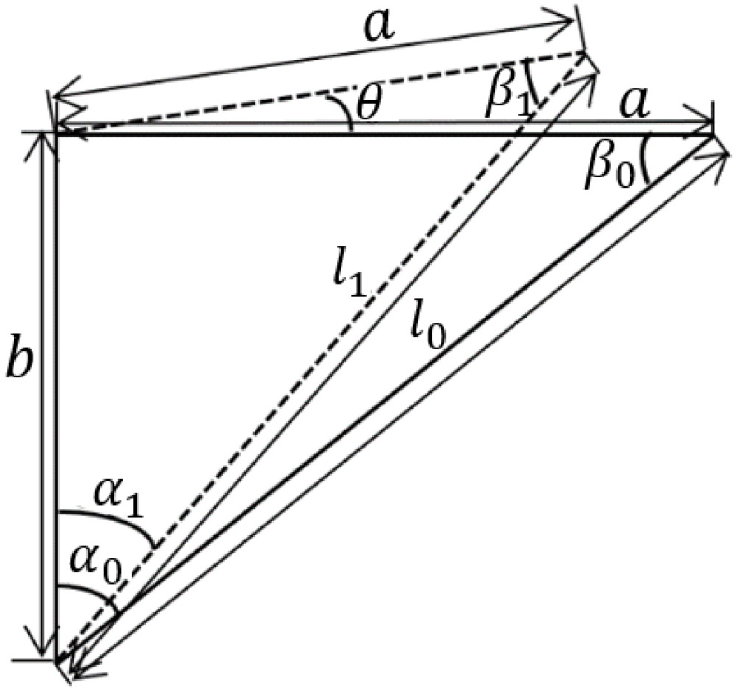
Based on Figure 3, α0 and α1 is the angle between the spring and the platform support post before and after the platform position shift occurs. The angles before and after the platform moves to the horizontal are β0 and β1. l0 is the initial length of the spring, and l1 is the length of the spring after it moves by θ. From Figures 2 and 3, Fky can be decomposed into eq. (5):
(5)
with
(6)
and
(7)
The designed solar panel platform consists of 4 springs, two springs for each side of the solar panels, so eq. (5) and eq. (6) become eq. (8):
(8)
for rotation system with displacement θ ≪, so
(9)
maximum θ = 20° and with that assumption the maximum error obtained is approx. 0.1. From eq. (7) and eq. (9) then eq. (8) becomes
(10)
If
(11)
according to eq. (11), eq. (10) can be written as eq. (12):
(12)
The value of k is calculated by measuring the change in the length of the linear spring due to the loading. cτ as the equivalent rotational damping coefficient, obtained from the inherent damping from friction and other energy dissipation mechanisms.
Platforms installed in open spaces will always get external disturbances, such as wind. The effect of wind on the platform structure depends on the pressure or force generated by the wind and the structure’s shape, size, and orientation [23]. The procedure for determining wind loads on solar panel platforms is based on standards such as EN 1991-1-4 [24] and ASCE/SEI 7-02 [25]. qp or wind pressure, can be calculated using eq. (13):
(13)
vp is the wind speed and ρ is the air density at the installation site of the platform. The force exerted by the wind Fw, on a structure with a height of fewer than 15 m can be calculated by the eq. (14) [23]:
(14)
cf is the coefficient of force, and A in m2 is the area of the platform structure. If the pressure is considered constant at the surface, then the force coefficient has the same value as the pressure coefficient, cf = cp. If the platform orientation model is considered, as shown in Figure 4, then the force coefficient can be calculated based on the boundary pressure coefficients cp1 and cp2 as eq. (15):
(15)
Pressure distribution on sheds roofs [23]
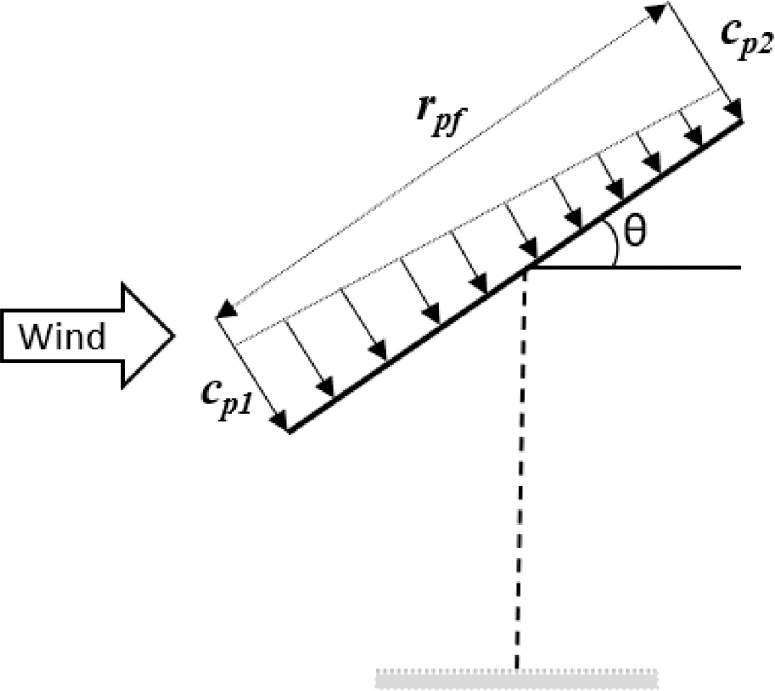
The values of cp1 and cp2 as models of the influence of the wind on an identical open surface inclined plane for the solar panel platform system are shown in Table 1.
cp values for sheds roofs [23]
|
Tilt angle, θ |
||||||
|---|---|---|---|---|---|---|---|
0° |
10° |
20° |
30° |
40° |
50° |
60°-90° |
|
cp1 |
0 |
0.8 |
1.2 |
1.6 |
1.6 |
1.4 |
1.2 |
cp2 |
0 |
0 |
0.4 |
0.8 |
0.8 |
1.0 |
1.2 |
An additional driving torque called τw was generated due to the wind force on the surface of the platform. This external torque is represented by force acting at a certain distance (rwp) about the rotating point of the solar panel platform, as shown in eq. (16):
(16)
and
(17)
An additional mass control method is designed by moving water from one side of the platform to the other using two direct current (DC) motors as a driver of water flow and a solenoid valve as a flow direction control. The platform design is shown in Figure 5.
Platform design with additional mass weight variation
Motor power is selected based on the value of the water flow and the head of the pump, as shown in eq. (18):
(18)
Pis the value of the power used for the operation of the motor as a water pump, ρw is the density of water at a pressure of 1 atm and a temperature of 20 °C, and q is the flow rate in the channel. hp is the total head of the pump, which can be calculated using eq. (19):
(19)
∆z is the difference in height from the water flow, hf is the major flow loss, namely the flow loss that occurs due to friction. The height difference can cause the water flow to continue from a high position to a low position even though the water pump is off. Therefore, a solenoid valve is used as an on-and-off water flow. The results of calculations using eq. (18) and eq. (19) obtained a minimum head of 1.18 m and the minimum power required for a water pump is 1.7 watts, then the specifications of the water pump used are shown in Table 2.
Complete specifications of the pump used
Specifications |
Indicator |
|---|---|
Dimension |
92 mm × 46 mm × 35mm |
Operating voltage |
6 -12 volt |
Average current |
0.5 - 0.7 A |
Maximum flow |
700 ml/30 s |
Maximum suction |
2 m |
Head |
3 m |
Outer diameter |
8 mm |
Inner diameter |
4.8 mm |
The variable mass condition was obtained by moving the water from one reservoir to another reservoir at the left and right sides of the panel using an electrical pump. The reservoir uses a PVC pipe. The length of the PVC pipe is 680 mm, and the nominal diameter is obtained based on the results of the calculations using eq. (20) on several standard pipe diameters (as shown in Table 3). The selection of reservoir volume also takes into account the weight and strength of the solar panel platform. The mass of the water inside the pipe is calculated as follows:
(20)
Specifications of PVC pipe
Dnom (mm) |
Dout (mm) |
Din (mm) |
l (mm) |
ρ (kg/m3) |
mw (kg) |
|---|---|---|---|---|---|
50 |
63 |
37 |
680 |
998 |
0.729 |
Where Dnom is the nominal diameter in mm, Din is the inside diameter in mm, and Dout is the outside diameter in mm of the reservoir. Length of the reservoir is l in mm and mw is water weight in kg. The solar panel platform is designed with a tiny and negligible frictional force at the pivot point, allowing the system to rotate continuously. This movement can be overcome using four identical springs with a calculated value of kτ according to eq. (11). The specifications of the solar panels are shown in Table 4.
Specifications of solar panels
Performances |
Indicator |
|---|---|
Peak Power (Pmax) |
50 W |
Cell Efficiency |
16.93% |
Max. Power Voltage (Vmp) |
17.8 V |
Max. Power Current (Imp) |
2.81 A |
Open Circuit Voltage (Voc) |
21.39 V |
Short Circuit Current (Isc) |
3.03 A |
Power Tolerance |
± 3% |
Max. System Voltage |
1000 V |
Operating Temperature |
-4 °C to 85 °C |
The test was carried out in the equatorial region, which has excellent sunlight intensity every year, namely in the city of Padang, Indonesia, with 0.9° south latitude and 100.4° east longitude. There were five positions in the platform movement design, and those positions changed every two hours using a time setting. The position change is based on the angle of altitude α and the angle of inclination of the solar panel platform β. Figure 6 illustrates that solar radiation falls on the surface of the solar panel at an angled position.
The direction of the sun's radiation falling on the tilted position of the solar panel [26]
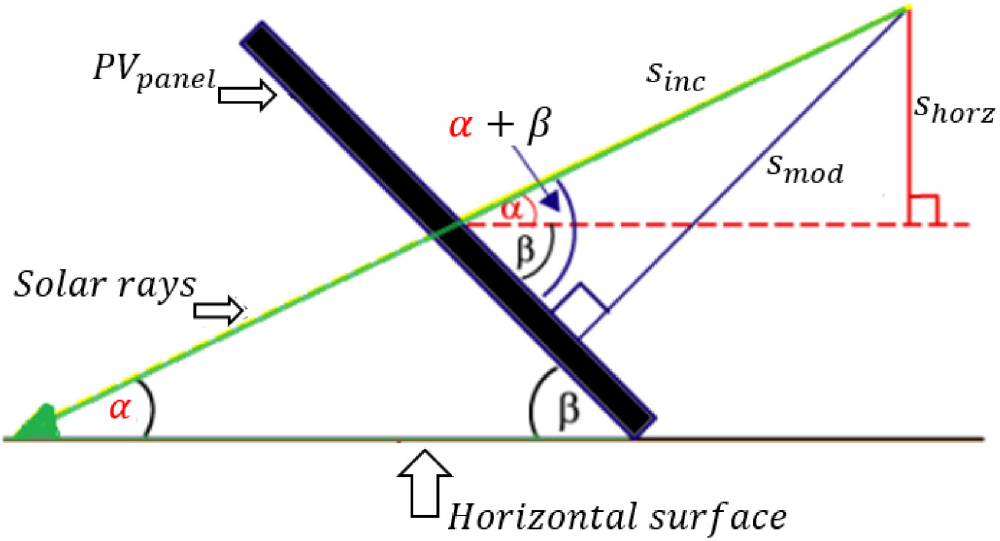
The altitude angle at the test location obtained from the Sun Position Demo application shows that the average altitude angle from 07.00 am to 05.00 pm was 10.6° every hour or 20.1° every two hours, and the solar panel platform changed position by 15° every two hours. This shows that changes in the sun's position differed with a change in platform orientation of no more than 10°. Based on the reference, the system can still produce 98.5% output of the maximum radiation value if the platform is right in the direction of the sun's rays [17]. The testing location for optimal performance can be carried out in the equatorial region, because the system being developed is only one axis and is based on solar position data throughout the year.
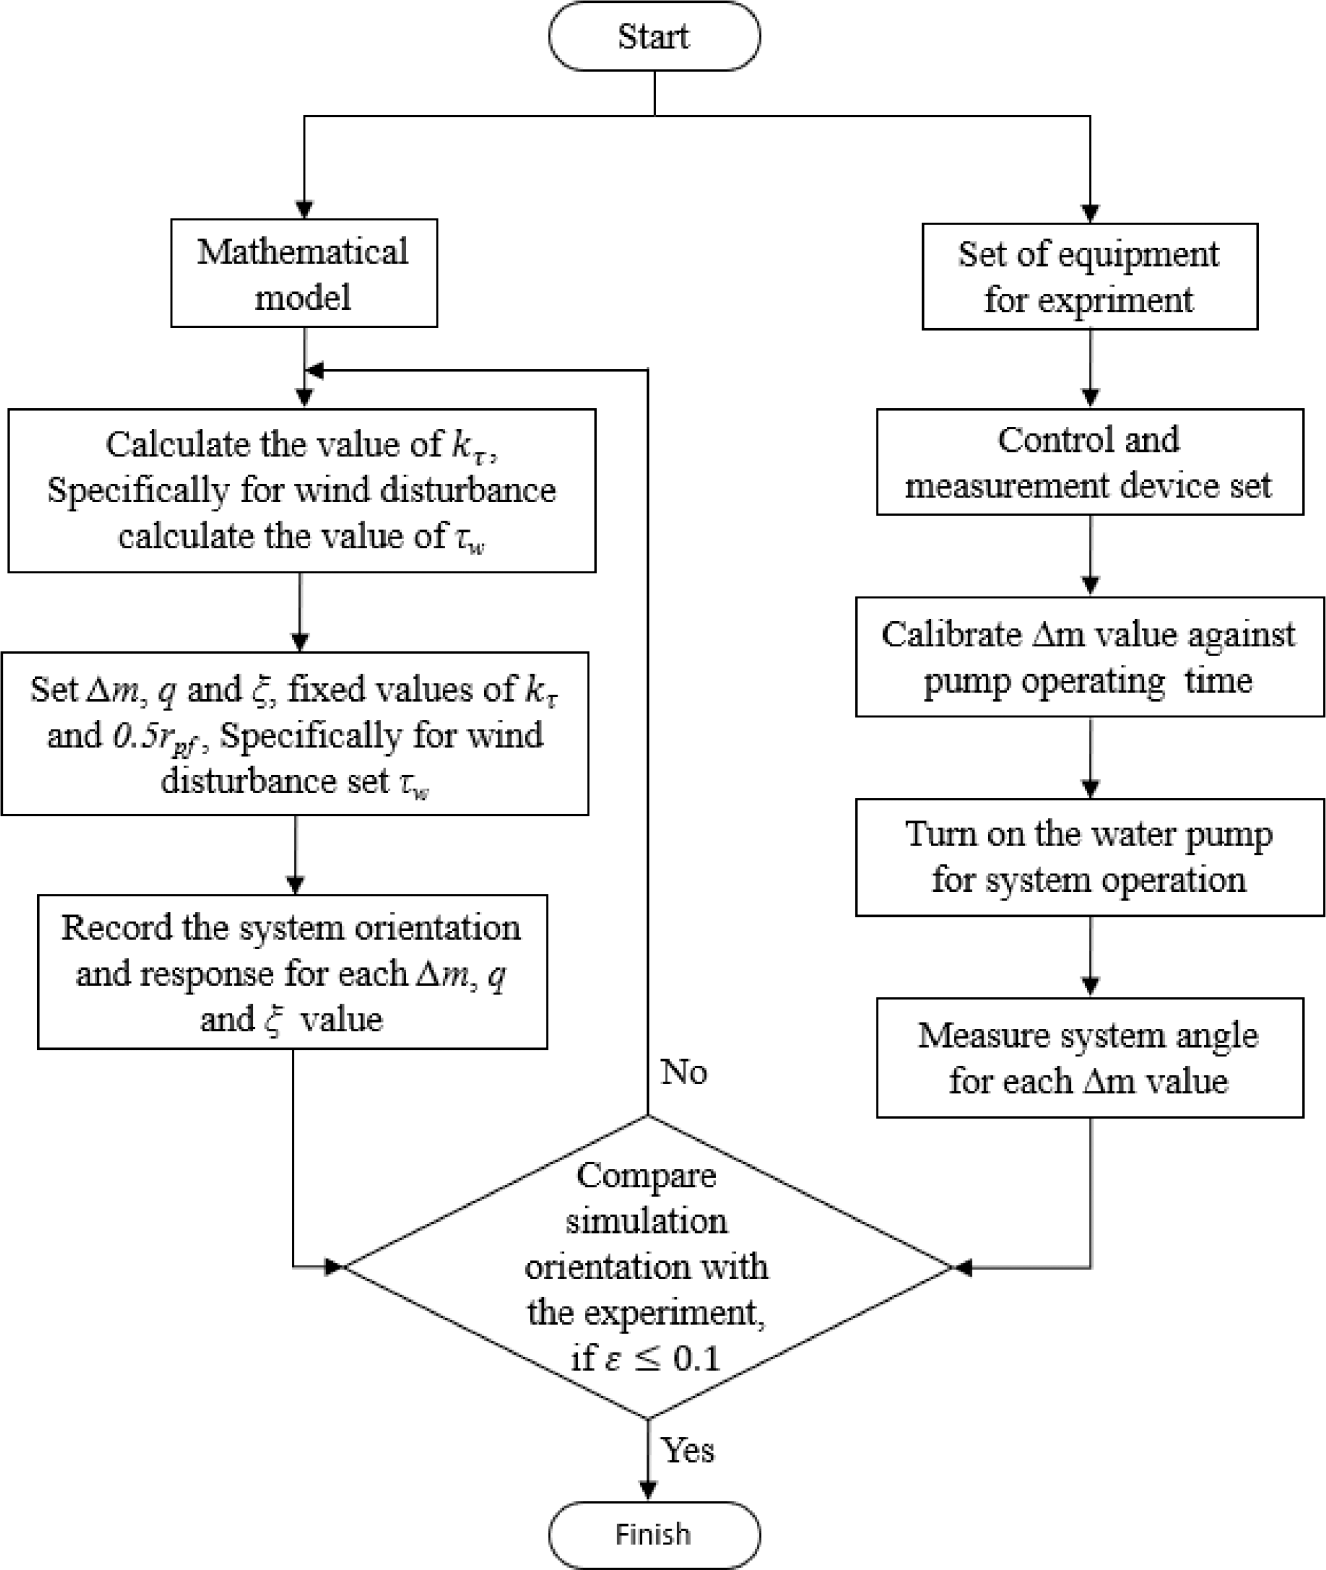
The simulation used MATLAB software, and it analyzed the effect of mass variation on the platform’s orientation angle and transient response for two external input (wind) conditions, i.e. without or with an external disturbance. The validation of the simulation model has been tested experimentally using the initial angle deviation and the simulated and experimental acceleration responses have been compared. The results of this comparison show an error of 0.04. The orientation angle of the simulation results will be compared with the experimental results. Figure 7 shows the research flowchart that consists of simulation and experimental study. The value of ∆m is the difference in the weight of water in reservoir 1 (m1) and reservoir 2 (m2), in the initial conditions, full m1 = 0.69 kg while m2 = 0 or ∆m1 = m1. Then ∆m2 = 0.45 kg, ∆m3 = 0, ∆m4 = ∆m2 (opposite direction) and ∆m5 = m2 (m2=0.69 kg and m1=0), water flow speed is set time t.
Simulation and experimental study flowchart
The experiment was carried out from 07.00 am to 05.00 pm using an initial weight of 0.69 kg and 0 kg for water in reservoir 1 (mw1) and reservoir 2 (mw2), respectively. The platform was initially directed to the east. A change in panel orientation was obtained by moving water from reservoir 1 to reservoir 2 using a water pump. The difference between mw1 and mw2 is ∆m, initial position as position 1, ∆m = mw1 (mw1 = 0.69 kg, mw2 = 0 kg), position 2 ∆m = 0.45 (mw1 = 0.575 kg, mw2 = 0.125 kg) position 3 ∆m = 0 (mw1 = mw2 = 0.345 kg), position 4 ∆m = 0.45 to the west (mw1 = 0.125 kg, mw2 = 0.575 kg) and position 5 ∆m = 0.69 kg also to the west (mw1 = 0 kg, mw2 = 0.69 kg), as shown in Figure 8.
Five position of platform solar panel
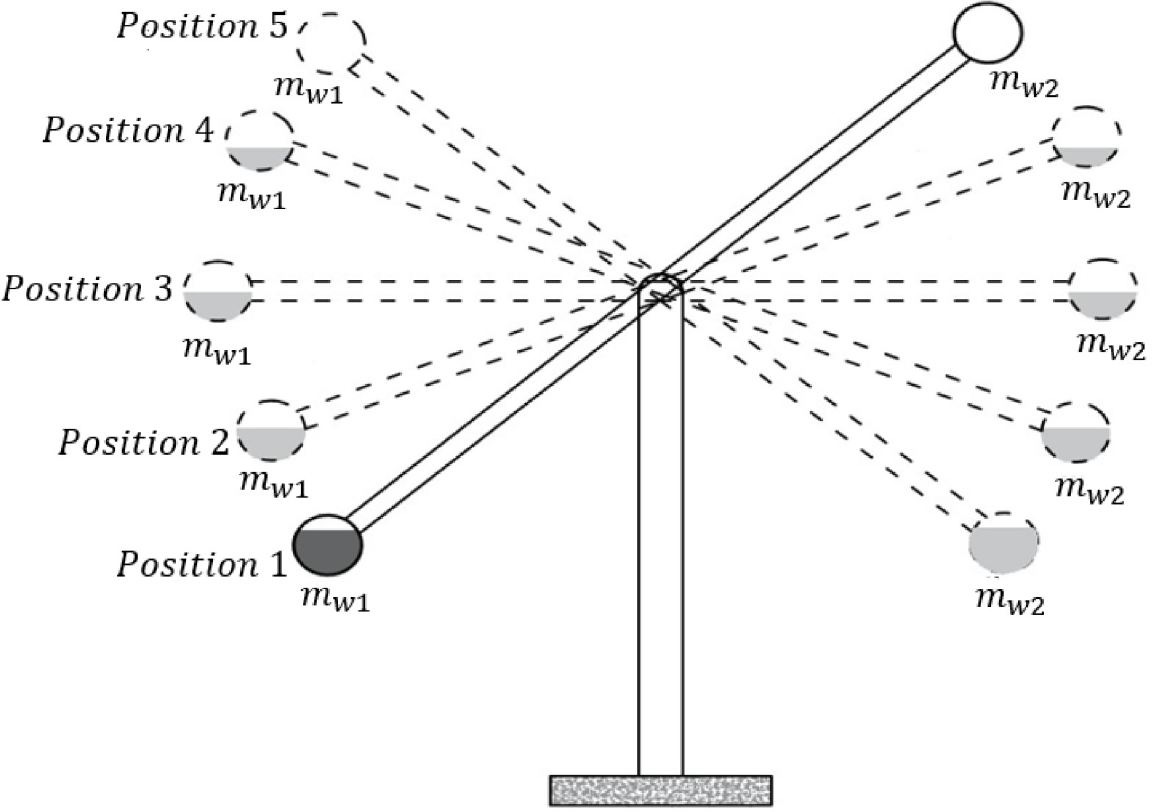
Figure 9 shows how the experiment was set up to compare how much power the proposed method and the fixed panel method produced. Table 5 shows the mechanical and electrical parts that were used in the experimental study.
Figure 10 and Table 6 show that the control system has some control devices and measuring tools. The 12-volt water pump working voltage is supplied directly from the battery. The fluid flow was regulated using a water pump and a solenoid valve working simultaneously and was active every 2 hours for 10 seconds. When the water pump and solenoid valve were active, water would flow from reservoir one to reservoir two. The measurement instrument used a data logger system with a working voltage of 5 volts supplied from the battery and used a buck converter to reduce the voltage to 5V.
Experimental setup with an additional mass controller
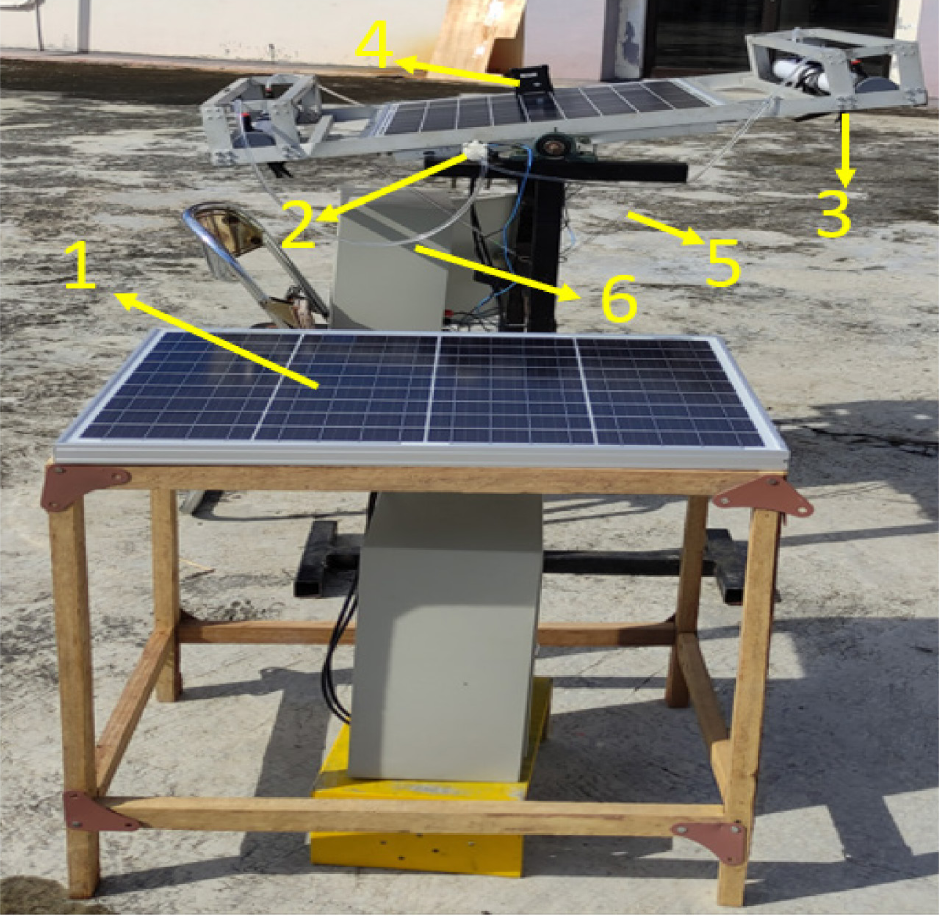
Components of additional mass controller
No. |
Component |
|---|---|
1 |
Solar panels |
2 |
Water pump |
3 |
PVC pipe |
4 |
Digital protractor |
5 |
Spring |
6 |
Controller and measuring instrument box |
Water pump control and measurement instruments
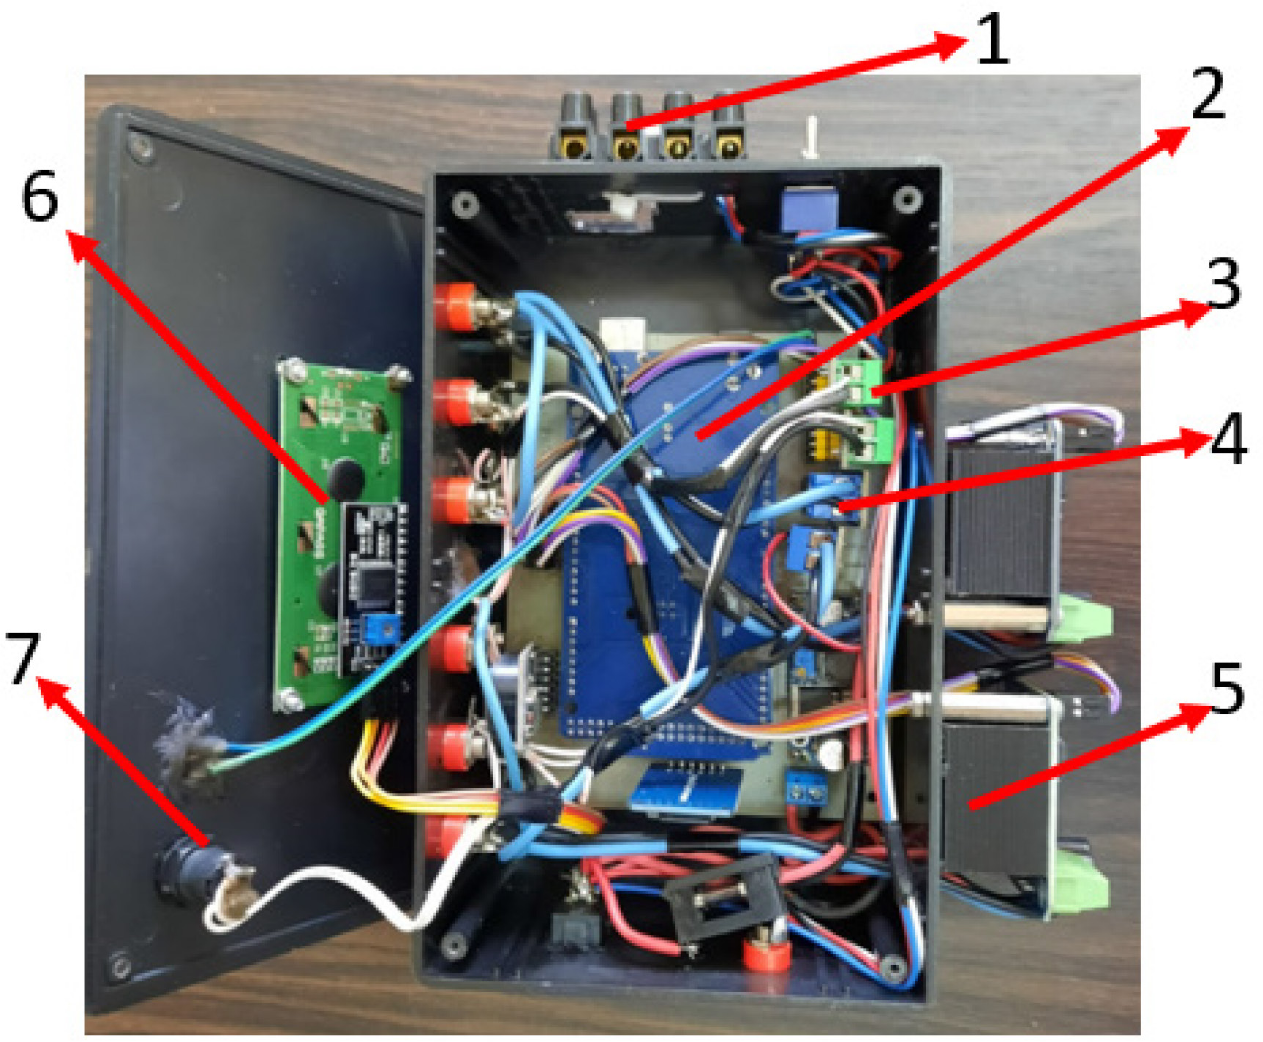
Components of control devices and measuring instruments
No. |
Component |
|---|---|
1 |
Power supply terminals |
2 |
Arduino mega |
3 |
Current sensor |
4 |
Voltage sensor |
5 |
BTS drivers |
6 |
LCD |
7 |
On-off switch |
A simulation study intended to determine the effect of water flow on the response of orientation angle. The simulation used some water mass differences (∆m) between reservoirs 1 and 2. Table 7 shows the parameter data for the simulation. The value of J consists of the solar platform’s inertia moment and the reservoir’s additional inertia moment. The inertia moment from the reservoir system is calculated from the difference in mass values between two reservoirs that changes due to the water flow from each reservoir. The value of the damping ratio (ξ) is given by low damping, medium damping and high damping. The value of t (s) was the time required for water to flow from reservoir one to reservoir two. The simulation results obtained without external disturbance from wind pressure are shown in Figure 11.
Simulation parameter value
No. |
Parameter |
Value |
Unit |
Explanation |
|---|---|---|---|---|
1 |
J |
1.21 |
kgm2 |
variable |
2 |
ξ |
0.05, 0.5, 0.85 |
- |
variable |
3 |
kτ |
10.45 |
Nm/rad |
constant |
4 |
∆m |
0.69, 0.45 |
kg |
variable |
5 |
t |
10, 7.5, 5 |
s |
variable |
6 |
τw |
0.132, 0.264 |
Nm |
variable |
7 |
0.5x |
0.525 |
m |
constant |
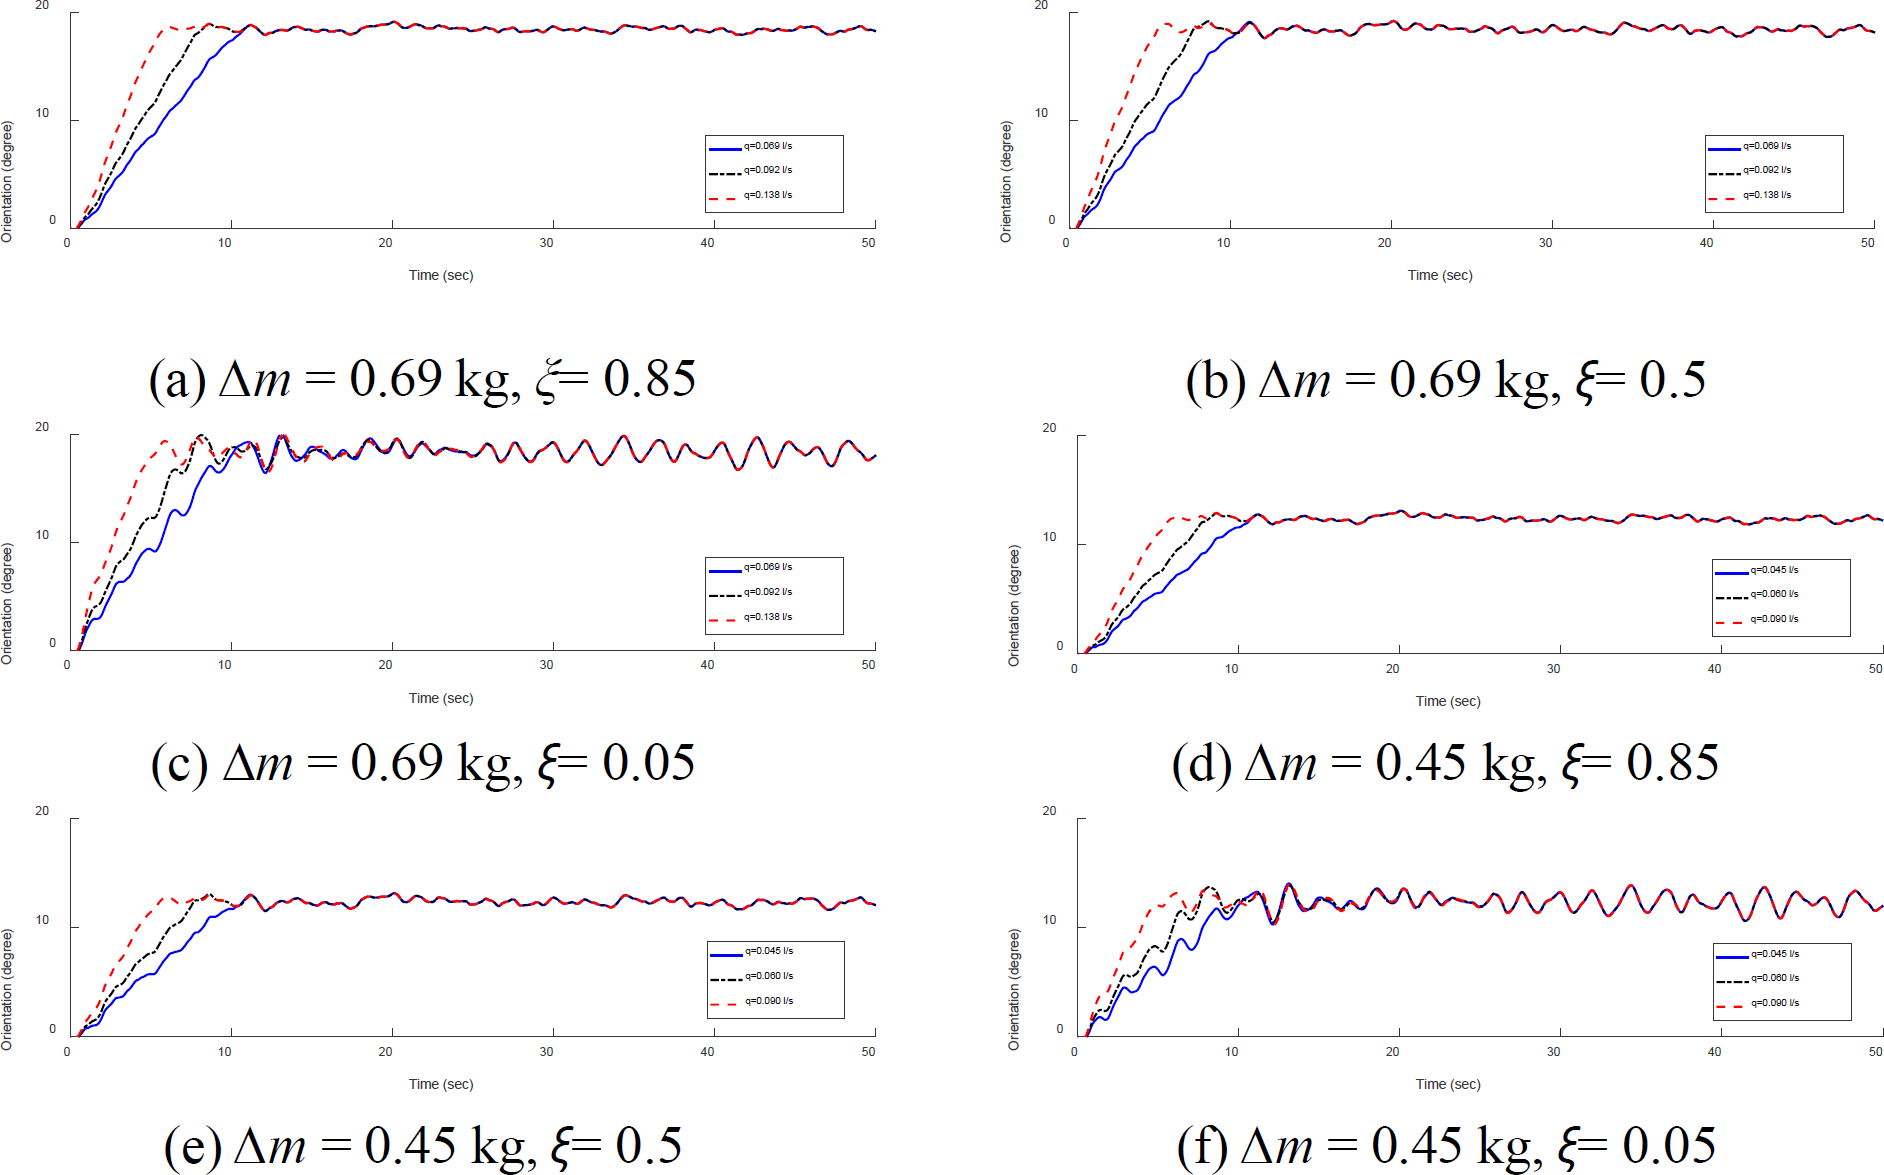
Orientation and response of the system without external disturbances for variations in the value of q (l/s), kτ = 10.45 Nm/rad
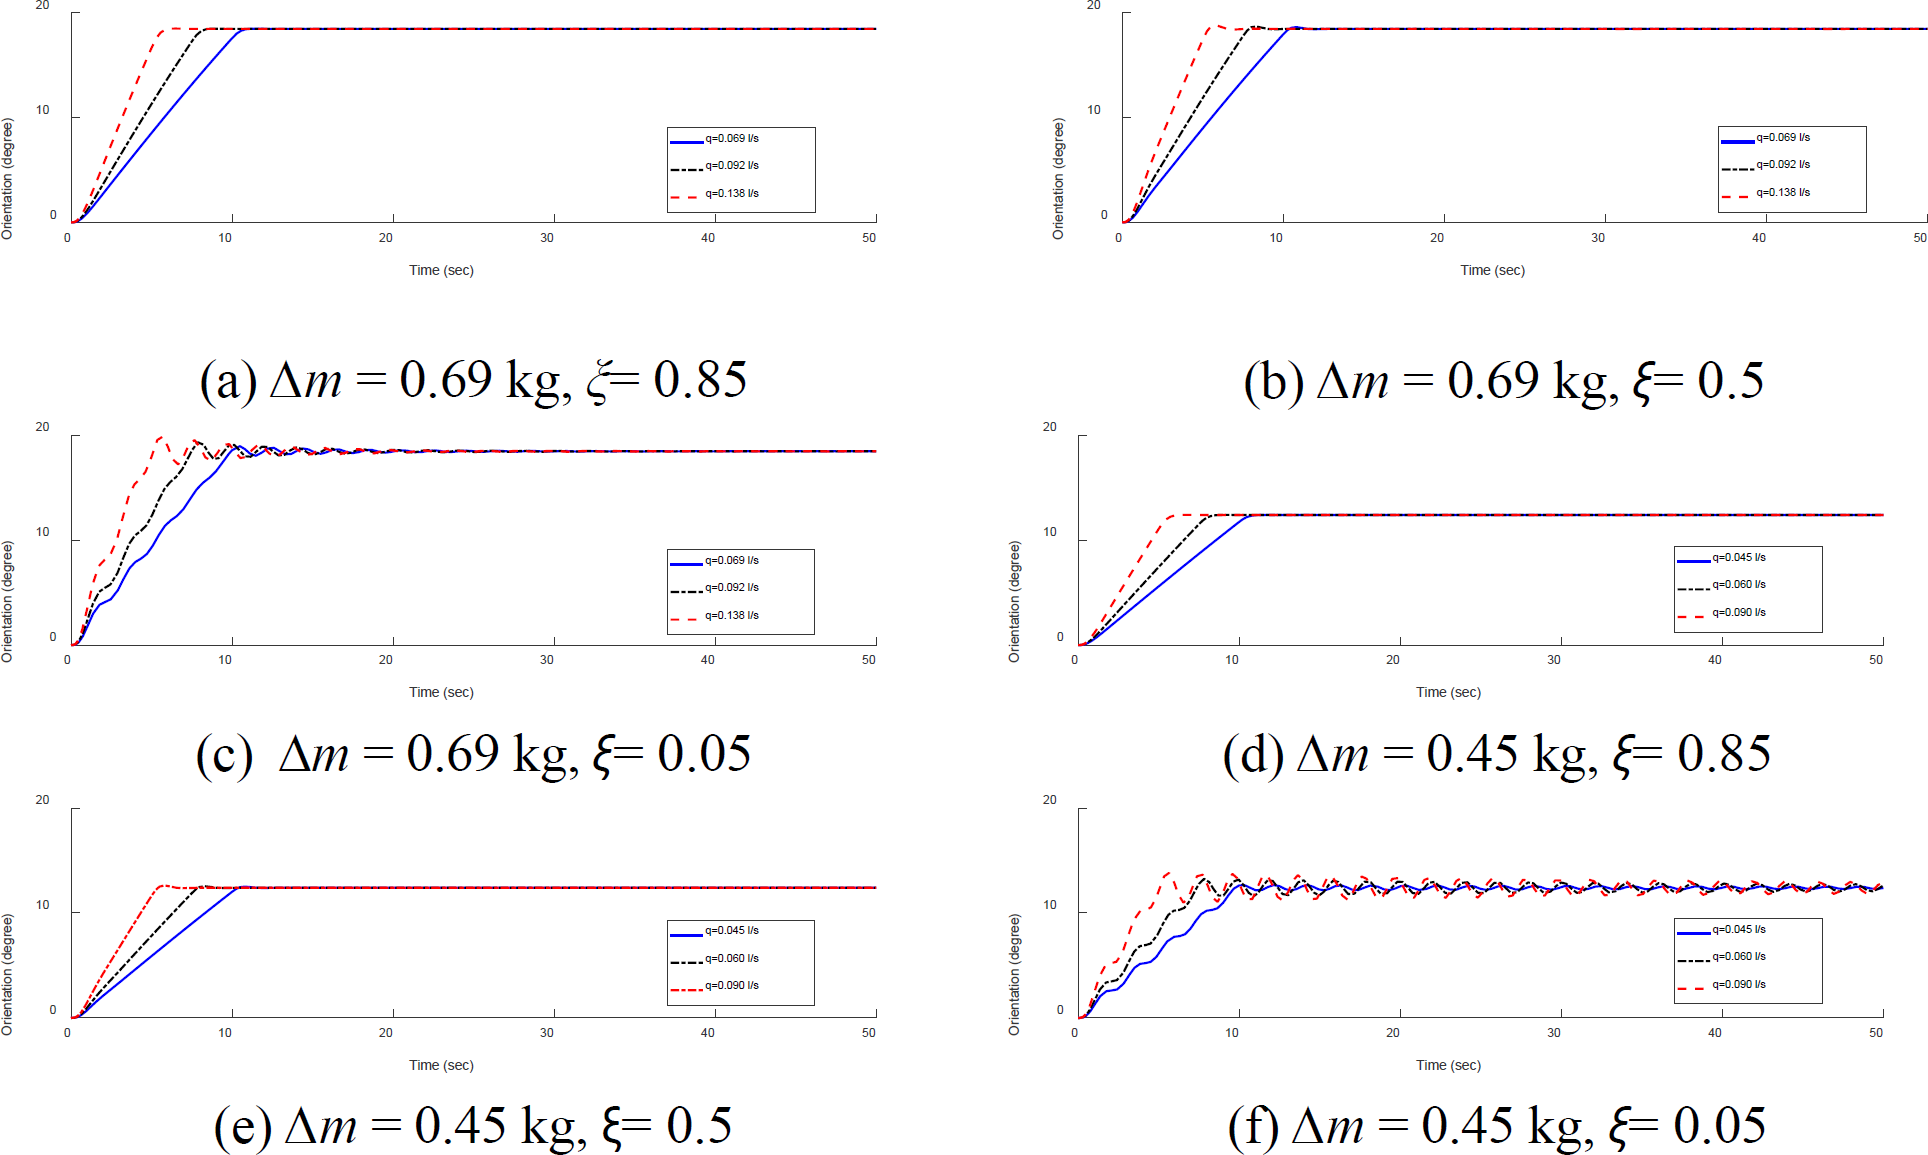
The simulation results in Figure 11, it show that the value of ∆m influenced the platform’s orientation, the steady-state orientation for ∆m = 0.69 kg is 18.86°, 0.45 kg is 11.83° as shown in Table 8. Variations in the t value of 10 s, 7.5 s, and 5 s had the main effect on water flow compared to changes in water mass. The relationship between water flow and the percentage of overshoot was linear. Variations in water flow q of 0.09 l/s, 0.06 l/s, 0.045 l/s provide different system responses. Water flow q of 0.045 l/s is the best water flow to avoid excessive oscillation due to changes in the value of ∆ m. The value of ξ = 0.85, as the best damping ratio in this simulation, could reduce oscillations due to water flow changes. Maximum overshoot always occurred at the initial peak of the oscillation while the highest percentage value of overshoot happened at the value of ξ = 0.05.
Simulation result system inclination
|
∆m (kg) |
||||
|---|---|---|---|---|---|
|
0.69 |
0.45 |
0 |
-0.45 |
-0.69 |
Orientation (°) |
18.62 |
11.83 |
0 |
11.83 |
18.62 |
The simulation with a wind pressure disturbance as an external disturbance was carried out by first determining the external torque value caused by the wind force that occurs on the platform. The external force and torque value were calculated using eq. (14) and eq. (17). Eq. (16) is used as the equation of motion of the system. The system’s response to changes in the value of additional mass and external disturbances is shown in Figures 12 and 13.
Orientation and response of the system with external disturbance conditions τw = 0.132 Nm, for variations in the value of q (l/s), kτ = 10.45 Nm/rad
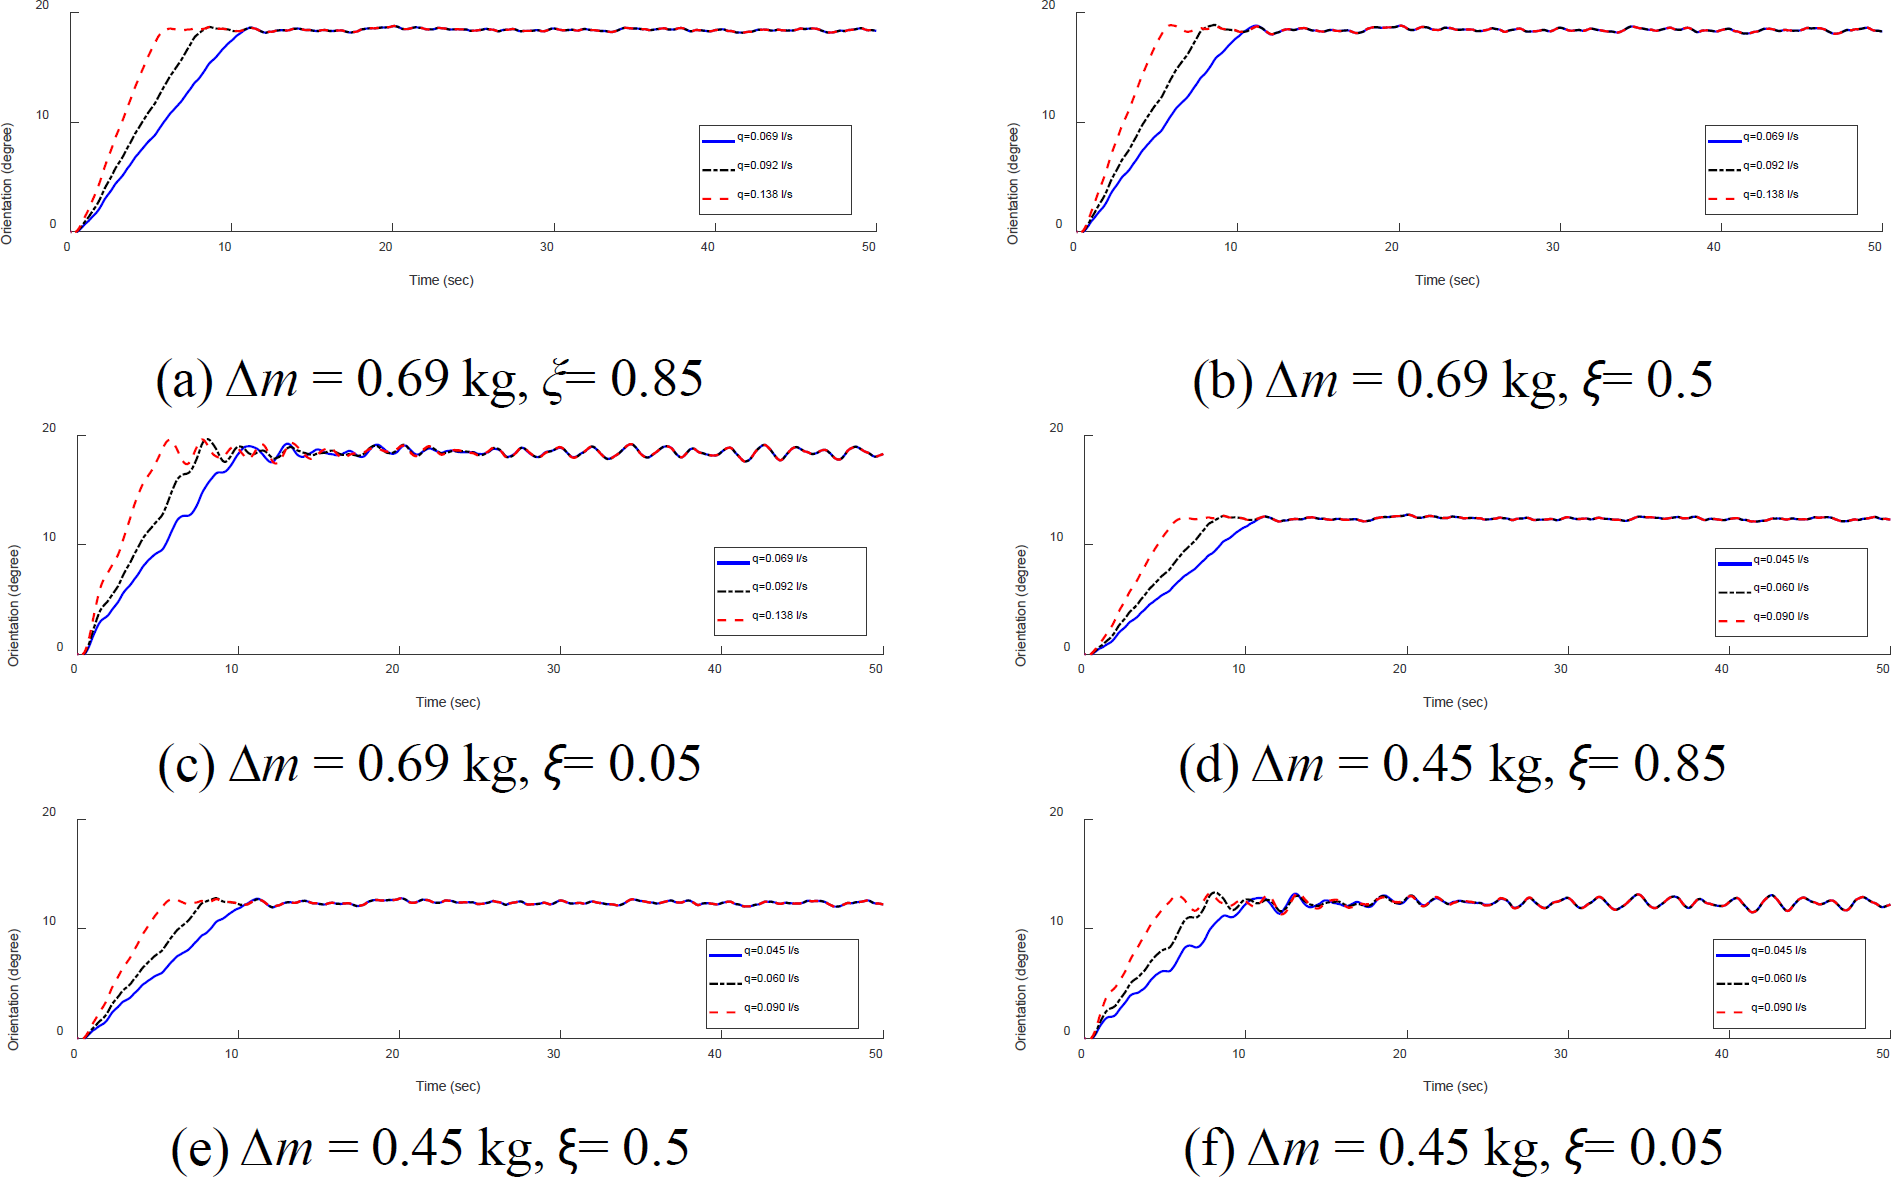
System orientation and response to external disturbance conditions τw = 0.264 Nm, for variations in the value of q (l/s), kτ = 10.45 Nm/rad
Figures 12 and 13 show that external disturbances only affect the maximum overshoot value, but did not significantly affect the response value at steady-state conditions. The maximum overshoot value when an external disturbance was not always at the initial peak of the oscillation. The orientation angle at steady state conditions with and without external disturbances was the same and this indicated that the given kτ value could maintain the desired orientation angle. Value ξ = 0.85, in this simulation, could reduce the percentage of overshoot for different values of τw and ∆m.
The test results show that the maximum orientation of the solar panel platform system was 20.74° in the east and 20.76° in the west. The orientation of each ∆m is shown in Table 9.
Inclination and direction of experimental solar panel platform
|
Position |
||||
|---|---|---|---|---|---|
1 |
2 |
3 |
4 |
5 |
|
∆m (kg) |
0.69 |
0.45 |
0 |
-0.45 |
-0.69 |
Degree |
20.74° |
11.08° |
0.16° |
10.02° |
20.76° |
Direction |
east |
east |
east |
west |
west |
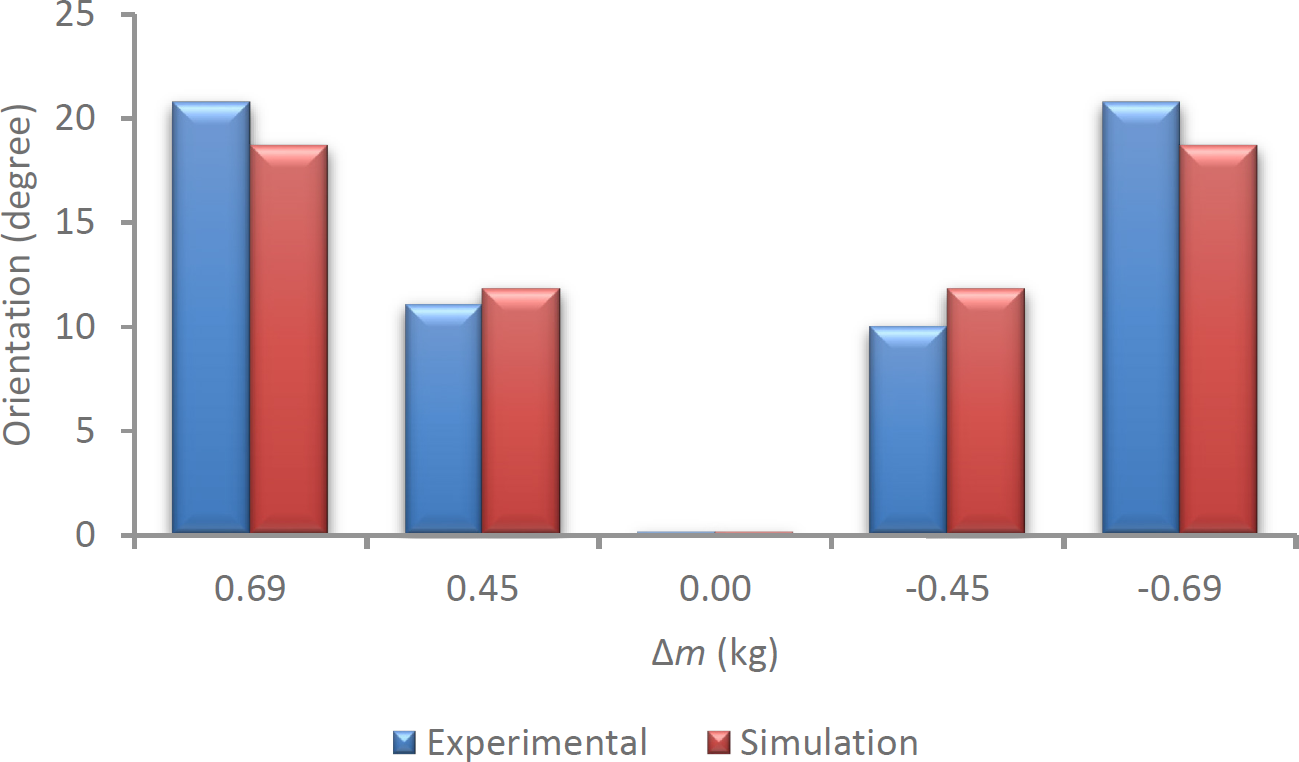
Figure 14 shows how the simulation and experiment both led to the same orientation for the solar panels. It can be seen that the orientation angles obtained in the simulation and experiment have a difference of ≤10% or an average of 8.9%. These results indicate that, an external disturbances like wind load and mass differences do not significantly affect the steady-state response of solar panels. In detail, the orientation changes in Table 9 which are not precise between east and west orientations show limitations system.
Comparison of the inclination
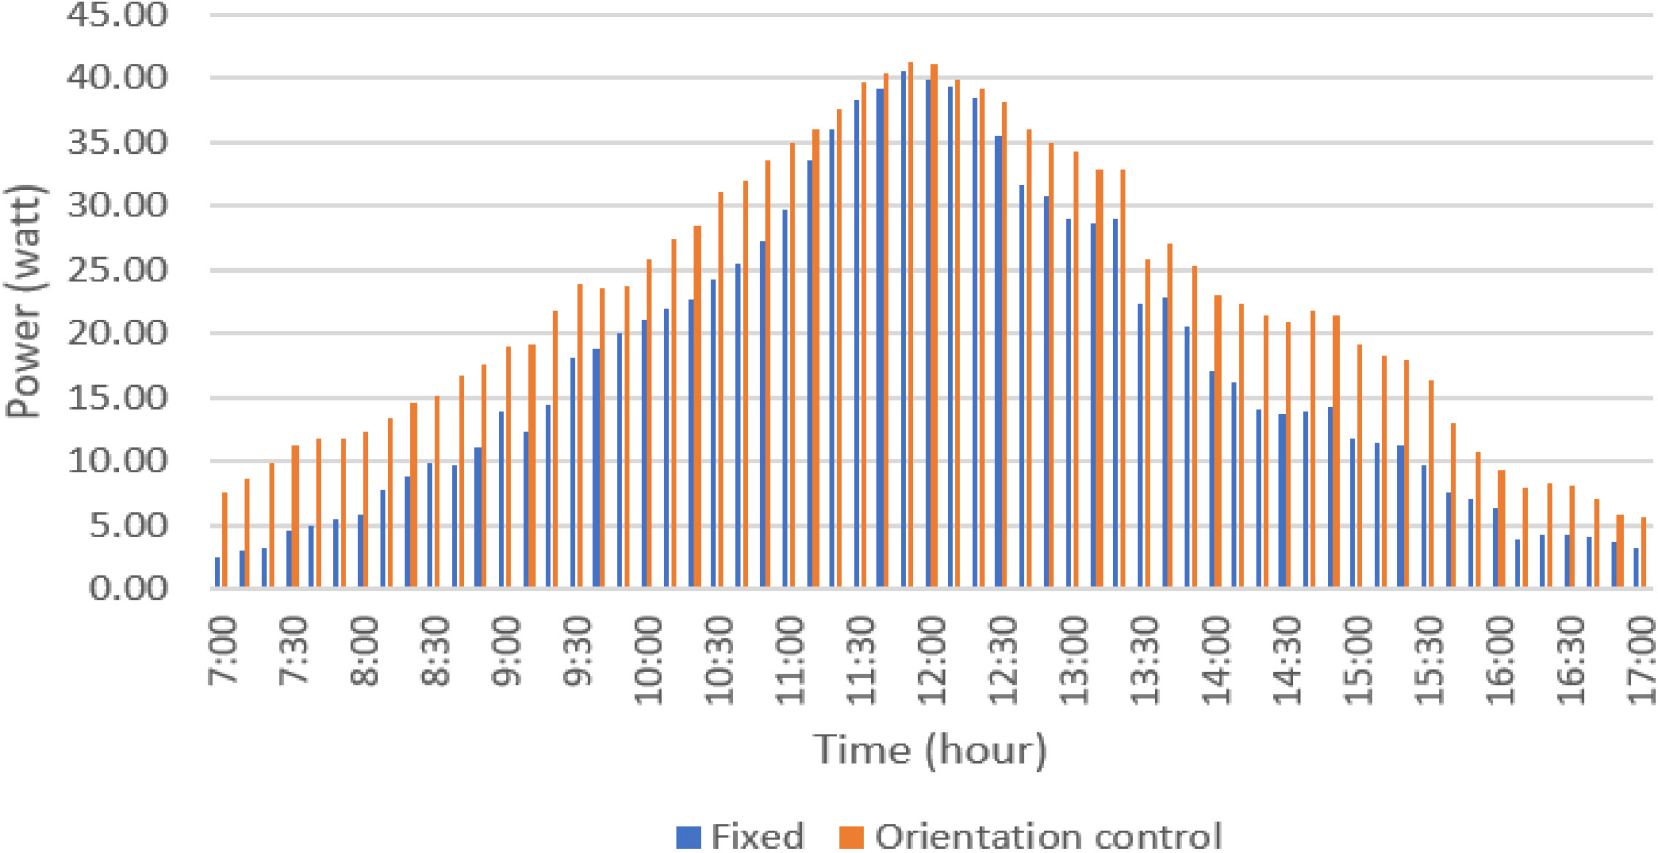
The results of the measurement of the power obtained during the measurement period are shown in Figure 15. Based on the measurement results of testing the water mass control system on the orientation control, a significant increase in output power was obtained compared to the fixed system in the measurement period, which is 21.56%. This value was excellent compared to some references. Generally, the power generated using a single-axis tracker compared to a fixed system was around 12%-20%.
Power measurement result
The energy consumption of the actuator in this study was important as an indicator of the performance of the solar panel platform orientation system, as shown in Table 10. The amount of energy consumed by the DC motor as a water pump during the operating period was 1.78 Wh or 0.79% for the ratio of ∆m to platform weight = 8.85% and kτ = 10.45 Nm/rad. Based on several references, the actuator energy consumption for controlling the orientation of solar panels was generally 2% - 3%. The use of water weight control in this system shows that changing the orientation of the solar panels required the energy consumption of the DC motor as a water pump to be minimal compared to the power generated by the solar panel platform.
Water pump power when operating
|
Position |
||||
|---|---|---|---|---|---|
1-2 |
2-3 |
3-4 |
4-5 |
5-1 |
|
Pump power 1 (W) |
2.81 |
2.79 |
2.72 |
2.73 |
- |
Pump power 2 (W) |
- |
- |
- |
- |
3.29 |
Time (s) |
10 |
10 |
10 |
10 |
40 |
This study used a semi-active control system consisting of a variable mass system and a torsion spring. The system offered a low-speed orientation control mechanism with a variable mass control technique. Variable mass is obtained by moving water from one reservoir to another on the left and right sides of the solar panel using an electric pump and a solenoid valve as a regulator of the flow direction. For the ratios of ∆m to platform weight = 8.85% and k
Based on the simulation results, changes in water flow were the main factors for the emergence of oscillations, while ∆m had no significant effect on the occurrence of oscillations. In general, external disturbances only affected the maximum overshoot, not the steady state. The maximum overshoot during external disturbances only sometimes occurred at the initial peak of the oscillation. The orientation of the solar panel platform at a steady state is not affected by external disturbances. The enormous overshoot value in the event of an external disturbance also indicates that a lighter system is more easily excited.
Based on the test, the increase in output power produced was quite large compared to the fixed system during the measurement period, which was 21.56%. On the other hand, the amount of energy consumed by the water pump as an actuator during the operating period was tiny, namely 1.78 Wh or 0.79%. The findings of this test reveal that a variable mass system-based solar panel orientation system had a convincing performance in terms of the enhanced power generated and energy consumed during the measurement time.
In the future work, this platform orientation control can be developed as a low-speed orientation control using an additional mass position change mechanism. In the framework of economic studies of platform orientation control systems and optimization studies of two crucial factors, namely the energy provided by solar panels relative to the energy utilized by actuators, the next intriguing study can be conducted.
- , Semi active control of civil structures for natural hazard mitigation: analytical and experimental studies, PhD Thesis, University of Notre Dame, 2001
- ,
Recent advancements and challenges in Solar Tracking Systems (STS): A review ,Renew. Sustain. Energy Rev. , Vol. 81 (April 2017),pp 250–279 , Jan. 2018, https://doi.org/https://doi.org/10.1016/j.rser.2017.06.085 - ,
Design of a novel passive solar tracker. Solar Energy ,Sol. Energy , Vol. 77 ,pp 269–280 , 2004, https://doi.org/https://doi.org/10.1016/j.solener.2004.06.009 - ,
A state-of-the-art review of structural control systems ,JVC/Journal Vib. Control , Vol. 21 (5),pp 919–937 , 2015, https://doi.org/https://doi.org/10.1177/1077546313478294 - ,
Stability analysis and flight control design of the winged reusable launch vehicle ReFEx ,CEAS Sp. J. , Vol. 13 (1),pp 51–64 , 2021, https://doi.org/https://doi.org/10.1007/s12567-020-00319-3 - ,
Active Control Stabilization of High Power Rocket ,Department of Mechanical Engineering, Santa Clara University , 2018 - ,
Control and Synchronization Chaotic Satellite using Active Control ,Int. J. Comput. Appl. , Vol. 94 (10),pp 29–33 , 2014, https://doi.org/https://doi.org/10.5120/16380-5887 - ,
Solar tracking methods to maximize PV system output – A review of the methods adopted in recent decade ,Renew. Sustain. Energy Rev. , Vol. 74 (February 2016),pp 130–138 , 2017, https://doi.org/https://doi.org/10.1016/j.rser.2017.02.013 - ,
Long-term field test of solar PV power generation using one-axis 3-position sun tracker ,Sol. Energy , Vol. 85 (9),pp 1935–1944 , 2011, https://doi.org/https://doi.org/10.1016/j.solener.2011.05.001 - ,
Design , modeling and testing of a standalone single axis active solar tracker using MATLAB/Simulink ,Renew. Energy , Vol. 36 (11),pp 3075–3090 , 2011, https://doi.org/https://doi.org/10.1016/j.renene.2011.03.026 - ,
Efficiency improvements of photo-voltaic panels using a sun-tracking system. ,Appl. Energy , Vol. 79 ,pp 345–354 , 2004, https://doi.org/https://doi.org/10.1016/j.apenergy.2003.12.004 - ,
Design of a new three-degree of freedom spherical motor for photovoltaic-tracking systems ,Renew. Energy , Vol. 34 (12),pp 2751–2756 , 2009, https://doi.org/https://doi.org/10.1016/j.renene.2009.04.025 - ,
A multipurpose dual-axis solar tracker with two tracking strategies ,Renew. Energy , Vol. 72 ,pp 88–98 , 2014, https://doi.org/https://doi.org/10.1016/j.renene.2014.07.002 - ,
Adaptive model-based control for cost-aware household appliances ,J. Sustain. Dev. Energy, Water Environ. Syst. , Vol. 6 (3),pp 547–558 , 2018, https://doi.org/https://doi.org/10.13044/j.sdewes.d6.0206 - ,
Performance of a solar dryer with limited sun tracking capability , Vol. 74 ,pp 247–252 , 2006, https://doi.org/https://doi.org/10.1016/j.jfoodeng.2005.03.018 - ,
Semi-Passive Solar Tracking Concentrator ,Energy Procedia , Vol. 57 ,pp 275 – 284 , 2014, https://doi.org/https://doi.org/10.1016/j.egypro.2014.10.032 - ,
A review of principle and sun-tracking methods for maximizing solar systems output , Vol. 13 ,pp 1800–1818 , 2009, https://doi.org/https://doi.org/10.1016/j.rser.2009.01.022 - ,
Comparative analysis of fixed and sun tracking low power PV systems considering energy consumption ,ENERGY Convers. Manag. , Vol. 92 ,pp 143–148 , 2015, https://doi.org/https://doi.org/10.1016/j.enconman.2014.12.046 - , Semi-active damping control for vibration isolation of base disturbances, PhD Thesis, Faculty of Engineering, Science and Mathematics, University of Southampton, 2004
- ,
A Primer on Design of Semiactive Vibration Absorber (SAVA) ,J. Eng. Mech. , Vol. 125 (9),pp 1095–1098 , 1999, https://doi.org/https://doi.org/10.1061/(ASCE)0733-9399(1999)125:9(1095) - , Vibration Suppression with Resettable Device, J. Eng. Mech., no. September 2002, 2003
- ,
Improvement of A Solar Panel Tracking System Using Additional Mass Position Adjustment , Vol. 21 (86),pp 92–99 , 2021, https://doi.org/https://doi.org/10.21660/2021.86.j2293 - Modeling Wind Action On Solar Tracking Pv Platforms, 2010, https://www.researchgate.net/publication/267779610, [Accessed: 07.05.2023]
- , European Committee For Standardization, EN 1991-1-4: Eurocode 1: Actions on Structures, General Actions - Part 1-4: Wind Actions. Avenue Marnix 17, B-1 000 Brussels, 2010
- , ASCE/SEI7-02 :Minimum Design Loads for Buildings and Other Structures, 2002
- ,
Estimation of solar radiation on PV panel surface with optimum tilt angle using vortex search algorithm ,IET Renew. Power Gener. , Vol. 12 (10),pp 1138–1145 , 2018, https://doi.org/https://doi.org/10.1049/iet-rpg.2017.0830