


Water is one of the vital necessities of human beings [1]. Humans consume (appropriate) water to sustain life, which is used or managed in almost every production process in our society. That is why many authors have focused on quantifying the volume of water appropriation (for example, Pirouz and Maiolo [2] estimated the amount of water consumption in heating, ventilation, and air conditioning (HVAC) systems) or on providing alternatives to reduce the consumption (for example, Pereira et al. [3] provided a model to improve the irrigation of crops to save water).
Human appropriation of water can generate two impacts [4]: (i) a volumetric impact, in which the consumption of water at one point prevents another user from accessing this resource at a later point [5]; and (ii) a quality impact, in which there is volumetric availability of water, but its quality does not allow the user to consume it [6]. Furthermore, both impacts may adversely affect water ecosystems [7] as they change the conditions of the water bodies [8].
The water footprint (WF) is a useful tool for assessing these two impacts. Considering the methodology defined by the Water Footprint Network (WFN) [4], the WF is divided into three colours: blue, green, and grey. The blue WF consist of the volumetric consumption of surface and ground freshwater. At the same time, the grey WF assesses water pollution by relating it to the volume of water needed to assimilate pollutants [4]. Hence, the quality impact of the human appropriation of water can be estimated using the grey WF.
Depending on the technology, electricity generation requires large amounts of water [9]. In the case of thermal power plants, water is necessary for the plant's construction, operation, and fuel extraction and processing [10]. Of the three, the largest water appropriation occurs during the cooling process of certain thermal power plants [11]. In these cases, the appropriation can affect the volumetric availability and the quality of the water [12].
Many studies have used the WF to quantify the impact of different human activities on bodies of water. For instance, there is the work of Hoekstra and Mekonnen [13] that estimated the WF of human activities per sector and suggested possible impacts. Moreover, more detailed studies estimated the WF of a few construction materials [14] and the production of poultry, pork and beef [15]. The electricity sector has also been part of these estimates, with studies covering countless power plants in various locations (for example, the assessment made by Semertzidis et al. [16], which estimated the water consumption for electricity generation in Brazil). More specifically, the study of thermal power plants has been carried out by multiple researchers. Some of them, e.g., the authors of [10], assessed thermal power plants’ average life-cycle water usage. In contrast, others were more detailed and assessed this usage for specific countries, e.g., Spain [17] and China [18]. Most studies of this type, e.g., [19] have focused on estimating the WF's blue component to suggest water-efficient technologies for the decision-making process. However, they have not considered the grey WF component for these suggestions.
As mentioned before, the lack of water quality may have an important effect on water availability in water bodies and could harm water ecosystems. Thus, it is paramount to complement the estimations of the consumption of water (blue WF) of thermal power plants with studies that quantify the impact of water pollution (grey WF) [20]. Many pollutants in the electricity generation and distribution processes can produce a grey WF [21]. Nonetheless, the most significant for thermal power plants, and yet to be assessed in the scientific literature extensively, is thermal pollution [22].
This study aims to fill that void by estimating the thermal pollution-related grey WF of Ecuadorian thermal power plants, providing a more detailed assessment of the thermal grey WF using first-hand data and identifying the possible impacts of the grey WF on the quality of the country's water bodies.
Ecuador is considered a suitable case study for this study, as it has available data, and its energy mix consists of several power plant technologies. Besides, previous work has estimated the volumetric impact of thermal power plants in the country's water bodies [23], so comparing the volumetric and quality effects of electricity generation by thermal power plants is facilitated.
During the operation of thermal power plants, water is used. The volume and quality of water required and discharged vary depending on the type of thermal power plant and its operation.
Brayton thermal power plants use small amounts of water as their working fluid is a mix of air and flue gases, and they do not require active cooling systems [24]. Sometimes, water is consumed and potentially polluted in these power plants depending on the fuel they use during the combustion [23]. However, this does not occur often. Thus, the potential of using water or polluting it is negligible.
Rankine thermal power plants use water in two ways: (i) as the working fluid of the power plant and (ii) as the cooling fluid to remove heat from the condenser. In the case of the former, the fluid works in a closed loop, so the water usage is small (just for make-up water) [23]. In the case of the latter, depending on the type of cooling system, it can significantly consume or pollute the water used [11].
Thermal power plants using Internal Combustion Engines are not as common as Rankine or Brayton but are present in some electricity mixes, e.g., Ecuador. In these cases, water can be used and polluted if the cooling agent to remove the heat produced in the combustion chamber of the engines is water [24]. Whether or not this usage is negligible depends on the cooling system type.
Cooling systems are required in some types of power plants as the excess heat can severely damage the equipment involved in the transformation process, or it may reduce the efficiency of the power plant [25]. Three types of cooling systems can be used in thermal power plants [11]: once-through systems (open-loop), wet-tower systems (closed-loop), and dry cooling systems (refrigerant-radiator systems).
These systems use a continuous flow of cooling water to remove the heat of the thermal power plant. So, they require a body of water (river, lake, well, sea, estuary or ocean) close enough to draw and discharge its water [26]. They need to withdraw large volumes of water but do not consume it, as it is returned to the source [10]. These cooling systems have the largest potential of thermally polluting the water body.
These systems remove heat from the condenser to discharge it to the atmosphere using an evaporative cooling tower [11]. The cooling tower requires large volumes of make-up water [10]. Nonetheless, these systems’ discharged water is small [11]. Furthermore, the discharge point is at the bottom of the cooling tower, so the discharged water is already cooled. That means that these systems have a small potential for water pollution.
These systems work under a closed-loop recirculation of refrigerants. The refrigerant passes through the engine (an Internal Combustion Engine power plant) or condenser (a Rankine power plant), removing heat. Then, the air is circulated through a radiator to discharge the removed heat into the atmosphere [11]. Dry cooling systems may use water as refrigerants, but this is uncommon. Either way, the system does not require a continuous feed of make-up water nor produces significant amounts of water to be discharged. So, the potential of thermally polluting water bodies is negligible.
Ecuador is a South American country located in the equatorial line. Most Ecuadorian electricity in the country's mix is produced by hydropower and thermal power plants. In 2020, hydropower produced 77.9% of the country's electricity, while thermal power plants produced 20.3% [27]. Only a small fraction of its electricity is produced by other renewables such as solar, wind and biomass [27].
Thermal power plants in the country mainly use oil derivatives as their fuels as the country does not have large coal or natural gas reserves, but it has a large and well-matured oil industry [23]. The preferred fuel for large thermal power plants in the country is fuel oil #4 and #6 [27]. This study focuses on Ecuadorian oil derivatives-fired thermal power plants that run under the Rankine thermodynamic cycle. Biomass-fired power plants may have significant grey WF as the working principle of both types is similar [25]. Nonetheless, considering that Ecuadorian biomass power plants are a by-product of sugarcane production [23], there are uncertainties because the discharged heat from the electricity generation system is used in sugar or molasses production.
Moreover, this study assesses grey WFs of thermal power plants but considers only thermal pollution as the primary pollutant. Other pollutants such as nitrogen, hydrocarbons, and other pollutants may affect the grey WF [4]. However, these are not considered in the WF accounting.
Finally, as discussed previously, the grey WF of thermal power plants is only significant for once-through systems. Thus, this study focused only on thermal power plants using once-through cooling systems.
The method is divided into four sections that complement each other: 1) inventory of Thermal Power Plants and their operation characteristics, 2) modelling of Thermal Power Plants operation, 3) estimation of the grey WF of Thermal Power Plants, and 4) comparison of the grey WF to other indicators of anthropogenic water use.
According to the annual report of the Agency of Regulation and Control of Energy and Non-renewable Resources (ARCERNNR) [27], Ecuador had 185 active thermal power plants in 2020, including plants whose primary movers are gas turbines, steam turbines and internal combustion engines. However, not everyone may produce a significant grey WF because they have different cooling systems. Most Ecuadorian thermal power plants are Internal Combustion Engines (in number, not production), which use dry cooling systems in principle. Thus, it is necessary to inventory the current Ecuadorian electricity mix to find the cooling technology used in each thermal power plant and then define which one may produce a significant grey WF.
For this, the technology and infrastructure of each active thermal power plant in the mix were evaluated. The starting point is the work by Vaca-Jiménez et al. [23] that serves as the base of the power plants database. Nonetheless, that paper considers only the active power plants until 2018 and must be updated. For that, the updated data from the System of Data of Electricity Generation (SISDAT) database [27] were downloaded and compared with the list provided by Vaca-Jiménez et al. [23]. The result is a list of existing thermal power plants.
Then, each thermal power plant was sorted according to its technology and cooling systems. First, the power plants were classified by the turbine technology (primary mover), which shows the thermodynamic cycle they use. Thus, it provides information regarding water uses, as described in Vaca-Jiménez et al. [23]. A thermal power plant may have different turbine technologies under the same roof to diversify fuels and resources or improve efficiency. So, the power plants were sorted into similar technologies using the SISDAT database's metadata. As described previously, active cooling systems are required for power plants working with steam turbines (Rankine Cycle). However, there may be cases in which other thermal power plants also use active cooling. Satellite imaging from Google Earth® was used to identify the cooling system infrastructure to avoid missing them in the assessment. The cooling system infrastructure is identified following the guidelines described by Diehl et al. [28].
Finally, with the detailed list of thermal power plants, potential ones that may produce significant grey WF were identified. Those power plants were used as case studies to calculate the grey WF.
In principle, the calculation of the grey WF requires historical data on the inlets and outlets of the power plant's cooling system. The problem with this is that thermal power plants in Ecuador are not required to log these temperatures, so they do not have a historical record. However, thermal power plants in the country must report electricity output and fuel consumption. These data are fully available to access in the SISDAT database [29]. Thus, any assessment of the water discharged by the cooling systems must be based on these two variables.
The operation of a thermal power plant and its cooling system can be modelled based on the theoretical energy balances and heat transfer equations of the elements of the power plant. There is a need to estimate the temperature of the discharge water of the cooling system of the power plants, Tdis. For that, the study started by modelling the energy balance on the entire plant, considering it a black box. Figure 1 shows the scheme of the energy balance.
Energy balance (inlets and outlets) considered in the model of the thermal power plants
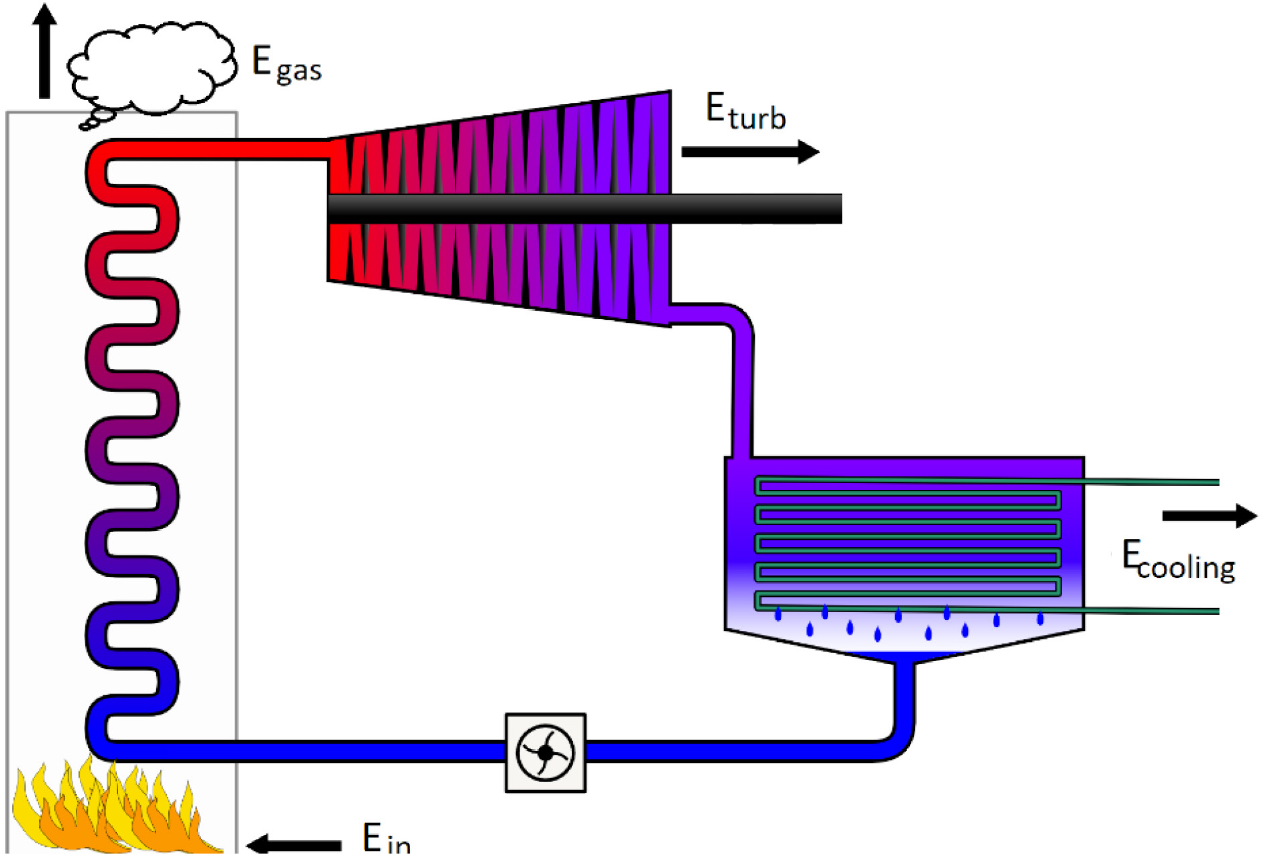
As observed in Figure 1, the power plant has only one energy input: fuel combustion. Conversely, it has three energy outputs: i) the energy in the turbine that generates the rotation of the turbine shaft, Et; ii) the heat that is discharged to the atmosphere by the flue gases that were not taking advantage in the boiler, Egas; and iii) the heat that is discharged by the cooling water, Ecooling. The equation of the energy balance is:
(1)
The difference between Ein and Egas is the fuel energy the water uses to achieve its phase change and superheating in the boiler. This useful energy can be defined in terms of the efficiency of the boiler as described in Tanuma [30]:
(2)
where: ηb is the efficiency of the boiler, H is the heating value of the fuel in J/m3 of fuel, and B is the volume of fuel consumed in a defined period in m3. There is a sum from i = 1 to n in eq. (2) because many thermal power plants in the country use more than one type of fuel [23]. The heating value used for the model was obtained from [23], and the ηb ranges from [30]. Finally, the volume of fuel consumed was obtained from the power plant as they reported it in the SISDAT [29].
In terms of the Et, the energy from the steam is transformed into kinetic energy on the turbine shaft, which is connected to the electricity generator. This steam-shaft-generator conversion of energy has two efficiencies. In the first case, there is the thermal-to-kinetic efficiency, ηt, due to the losses involved in transforming the turbine blades’ movement to the shaft, i.e., friction on the bearings. In the second case, there is a kinetic-to-electricity efficiency, ηg, due to the transformation of energy in the electricity generator. Based on energy balances, the efficiencies involved are as follows:
(3)
(4)
Using eqs. (3) and (4) and solving them for the Et, eq. (5) was obtained, which relates this energy output with electricity generation as follows:
(5)
The value of Eg is reported by each power plant and obtained from SISDAT [29]. The values of ηt and ηg range from 0.37 to 0.47, and 0.98 to 0.99, respectively [30]. The exact values per power plant were obtained from [31].
Then, the Ecooling is calculated based on the sensitive heat gained from the cooling water in the condenser using the following equation:
(6)
where: ρ is the density of the cooling water in kg/m3, Q is the volume of water discharged by the cooling system in m3 (or the integration of the volumetric flow over a certain period), Cpw is the specific heat of the water at the range of temperature of the discharged water, and finally Tact is the temperature of the inlet of the cooling water, which is the same as the body of water receiving the discharge. Values of ρ and Cpw were derived from Graham et al. [32].
Then, eqs. (2), (5) and (6) were inserted into eq. (1) and the difference in temperature between Tdis and Tact, times Q was solved, as shown in the following equation:
(7)
The product is obtained from eq. (7) using the multiannual monthly average of B and Eg. Both, from the period between 2000 to 2020.
According to the WF manual [4], the grey WF is calculated based on the volume of pollutants discharged into the water. It describes the hypothetical volume of water that needs to be included alongside the pollutant to dilute it until its concentration is within the established limits. The limits depend on regional guidelines and regulations that norm water discharge. The equation for the grey WF in m3, considering the thermal pollution alone, is as follows:
(8)
where: x denotes the place where the power plant is located (basin), t is the temporal characteristics of the grey WF due to the spatial and temporal limitations of the WF. Tmax is the maximum permissible temperature of the discharged water and Tnat is the natural temperature of the body of water receiving the discharge. The product (Tdis − Tact) × Q is obtained from eq. (7).
Sometimes it is impossible to define the natural temperature of a body of water because the estimations of the indicators, like the grey WF, are done after the discharge (ex-post). Furthermore, there are no historical records of the temperature of water bodies in the country until very recently, so any attempt to estimate this value would be based on best guesses. That is why there is the possibility of using the difference between (Tmax − Tnat) as a range of permissible temperature change in the body of water, ΔTadm, instead of individual values. Thus, the equation used for the grey WF for this approach changes as follows:
(9)
The ΔTadm is defined based on regional regulations. In Ecuador, the regulations establish 5 °C maximum permissible temperature increase to preserve the ecosystem of both fresh and saline water [33].
Once the grey WF was estimated for each studied thermal power plant, the values obtained in the previous sections were contextualised to shed light on the possible environmental impact.
First, the possible impact on the body of water regarding the volumetric capacity of the water available to dissipate the pollutant (defined as Water Pollution Level, WPL) was assessed.
(10)
where: Rava is the volume of water available in the water body in m3, and the sum of grey WF is defined as there may be cases where more than one thermal power plant is in the same basin. The volume of water available was obtained from the nearest hydrological probe using data from the Ecuadorian Meteorological and Hydrological Office (INAMHI) [34], or in the case of the tidal estimations, the Oceanographic Institute of the Ecuadorian Navy (INOCAR) [35].
Second, the calculated grey WF was compared to existing and validated water use indicators. In this case, the comparison was made with similar studies and previous estimations of the blue and green WFs of the same studied power plants. The values for comparison between similar studies were derived from Chini et al. [36] and for the other components of the WF of Ecuadorian power plants from Vaca-Jiménez et al. [23].
The model used to estimate the grey WF is based on the available data of the power plants, namely, electricity generation and fuel consumption. Energy balances were used to relate those data to the temperature of the water discharged by the cooling system. Thus, the boiler, turbine, and generator efficiencies were used.
The major source of uncertainty in this model comes from these efficiencies, as the ηb, ηt, and ηg have ranges that depend on many variables beyond this analysis's scope. Data of ηt, and per power plant studied were obtained from CELEC EP – Electroguayas [31].
The calculation of the uncertainty of the grey WF is then defined by the ηb. Tanuma [30] specifies that this efficiency ranges from 0.86 to 0.93. The theoretical, maximum, and minimum values of the product (Tdis − Tact) × Q per month were calculated using this range in equation (9).
The results are presented in three sections. The first result shows the country's thermal power plant inventory in 2020. The second result shows the grey WF of the studied power plants. Finally, the third result shows the possible impact of the grey WF in the water bodies used as heat sinks of the power plant's cooling water.
Five of the 185 thermal power plants operated in Ecuador in 2020 had two types of primary movers (e.g., gas and steam turbines), totalling 190 generation groups in the country. Of those, 170 were Internal Combustion Engines (Diesel engines and Otto engines), 14 were Brayton power plants (gas turbines as the prime mover), and 6 were Rankine power plants (steam turbines as the prime mover). As described previously, the Brayton power plants do not require cooling systems and were not assessed further.
After the cooling system infrastructure assessment using satellite data, there was found that, on the one hand, 169 of the Internal Combustion Engines that were operational during 2020 used dry cooling systems, with refrigerant and radiators, to dissipate the heat from the engines. These power plants do not produce a grey WF regarding water pollution. One power plant, Guangopolo 1, is the only Internal Combustion Engine plant that uses active cooling for its engines. It takes its water from the nearby Guangopolo reservoir (that serves the Guangopolo hydropower plant) and uses it in a wet tower cooling system. As described previously, the wet tower cooling system does not produce a significant grey WF regarding thermal water pollution. Thus, this power plant was not further studied.
On the other hand, three of the six Rankine power plants operational in 2020 use wet-tower cooling systems. These power plants do not produce grey WF of thermal pollution. The other three power plants use once-through cooling systems, so they were selected for further study. Table 1 shows the list and the characteristics of the three studied power plants.
Characteristics of the studied thermal power plants
| Power Plant | Nominal Power | Fuel | Water Body | |
|---|---|---|---|---|
| [MW] | Inlet | Outlet | ||
| Gonzalo Zevallos | 146 | Fuel Oil #4 | Salado Estuary | Tres Bocas Estuary |
| Trinitaria | 133 | Fuel Oil #4 | El Muerto Estuary | El Muerto Estuary |
| Aníbal Santos | 131 | Fuel Oil #4 | Salado Estuary | Tres Bocas Estuary |
The grey WF related to the thermal pollution of the electricity generation is presented per power plant.
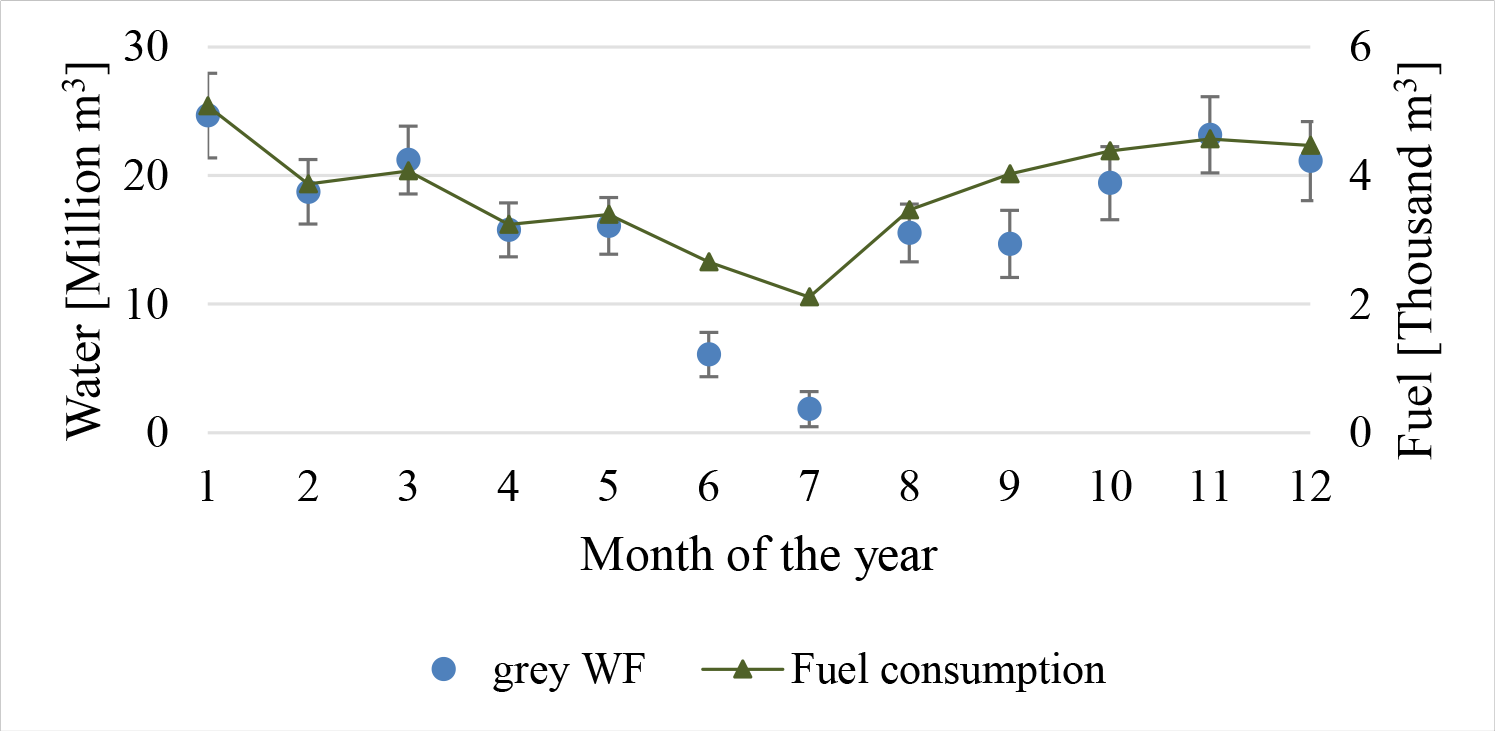
Figure 2 shows the multiannual monthly average of the volumetric grey WF against the multiannual monthly average of fuel consumption.
Gonzalo Zevallos power plant − multiannual monthly average of the grey WF and fuel consumption
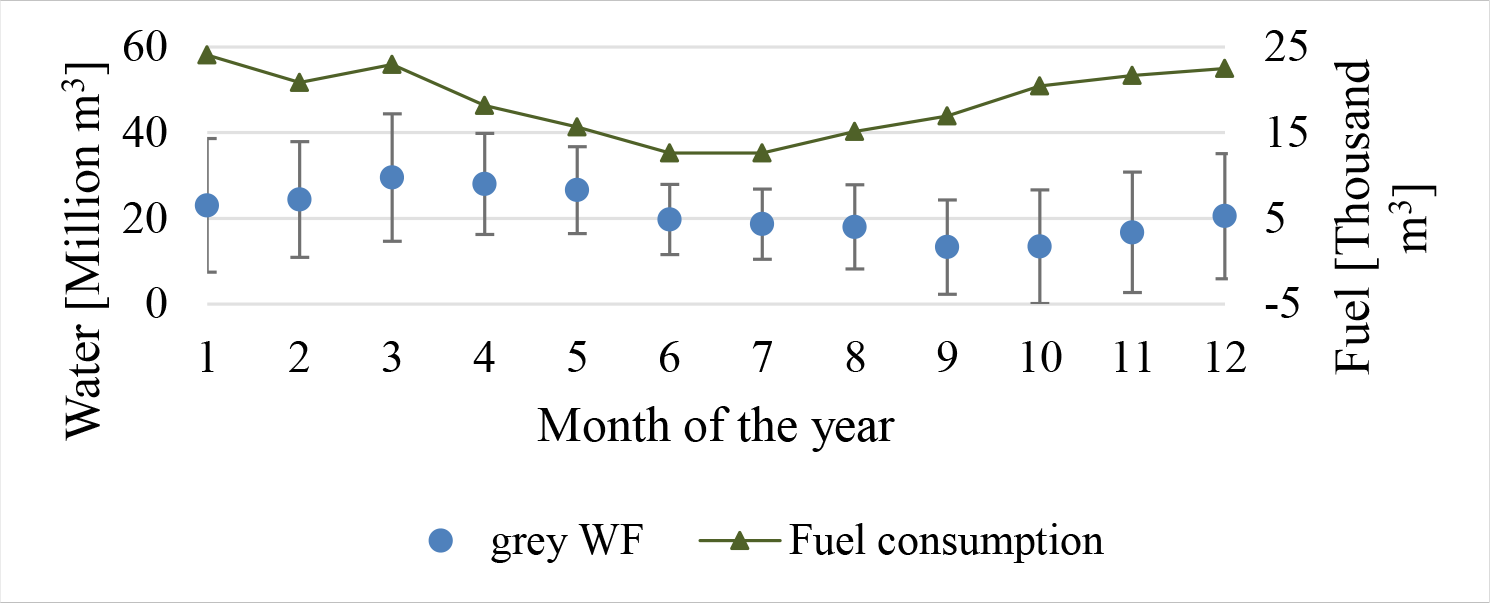
Figure 2 indicates a large grey WF that varies significantly through the year. The largest uncertainty of the volumetric grey WF, displayed in the figure as error bars, is observed from October to March, corresponding to the months when the fuel consumption is high. Moreover, the grey WF variation trend does not directly relate to fuel consumption. The variable part of the equation used to calculate the grey WF is defined by eq. (7), which relates fuel consumption with electricity generation. Thus, the monthly variation trend is determined by the relation between electricity generation, fuel consumption, and boiler, turbine and generator efficiencies.
Figure 3 shows the multiannual monthly average of the grey WF per unit of electricity generated.
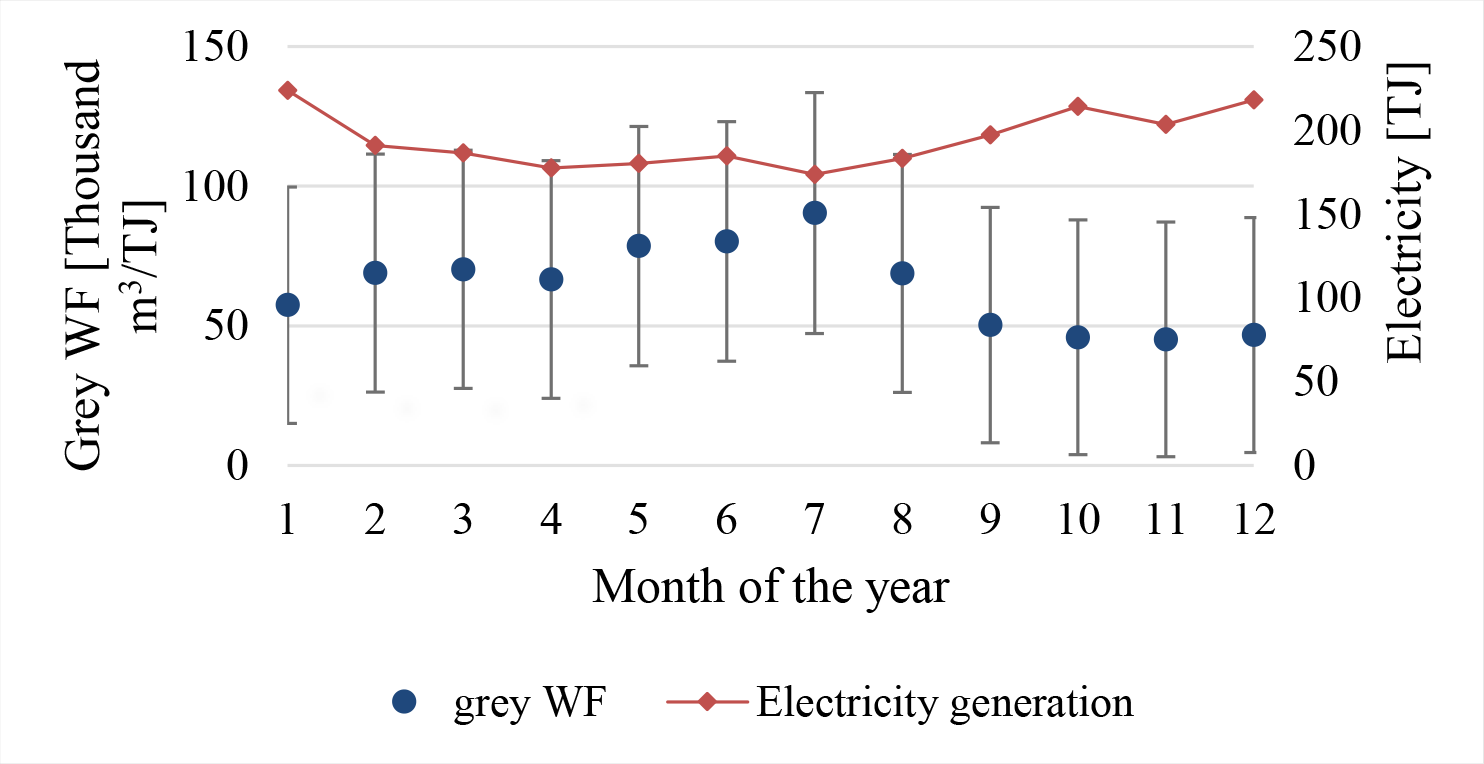
Gonzalo Zevallos power plant − multiannual monthly average of the grey WF per unit of electricity generated and the electricity generated
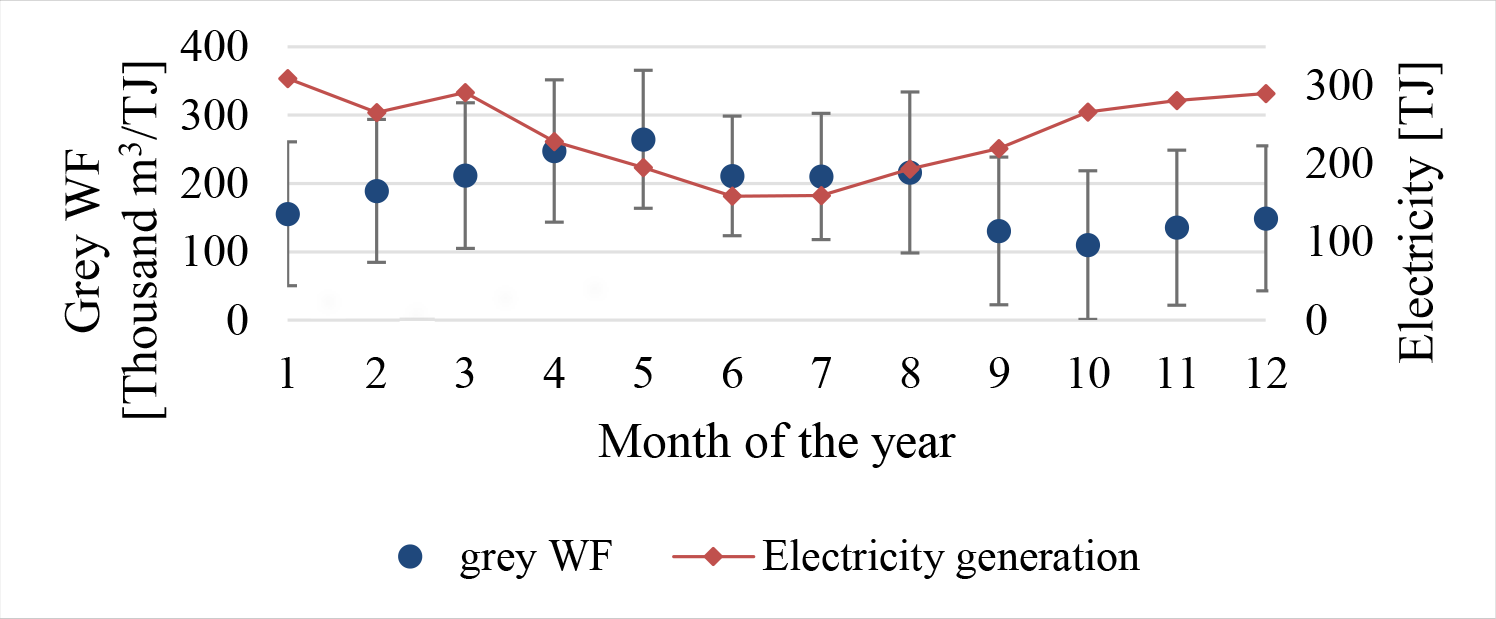
Figure 3 also shows a large monthly variability. The trend follows an inverse relation with the electricity the power plant generates. Thus, a large grey WF is observed in the middle of the year, corresponding to the lowest electricity production. This inverse relationship is due to the combination of Ecuadorian regulations regarding the permissible temperature in the water bodies and the amount of electricity generated per fuel consumed. The power plants never achieve the maximum temperature permissible for the discharge water, so the maximum temperature difference defines the permissible temperature. This maximum temperature difference remains the same throughout the year. The most influential factor in calculating the grey WF is the relation between the electricity generated against the amount of fuel consumed. In the case of Gonzalo Zevallos, during the middle of the year, the power plant is working very inefficiently compared to the other months of the year, so the amount of electricity produced per unit of fuel consumed is the lowest.
Moreover, the reason behind the temporal variability of the electricity generation and the fuel consumption of Gonzalo Zevallos throughout the year is the decrease in electricity demand. During those months, Ecuadorian hydropower plants provide more electricity to the grid displacing the thermal power plants [37].
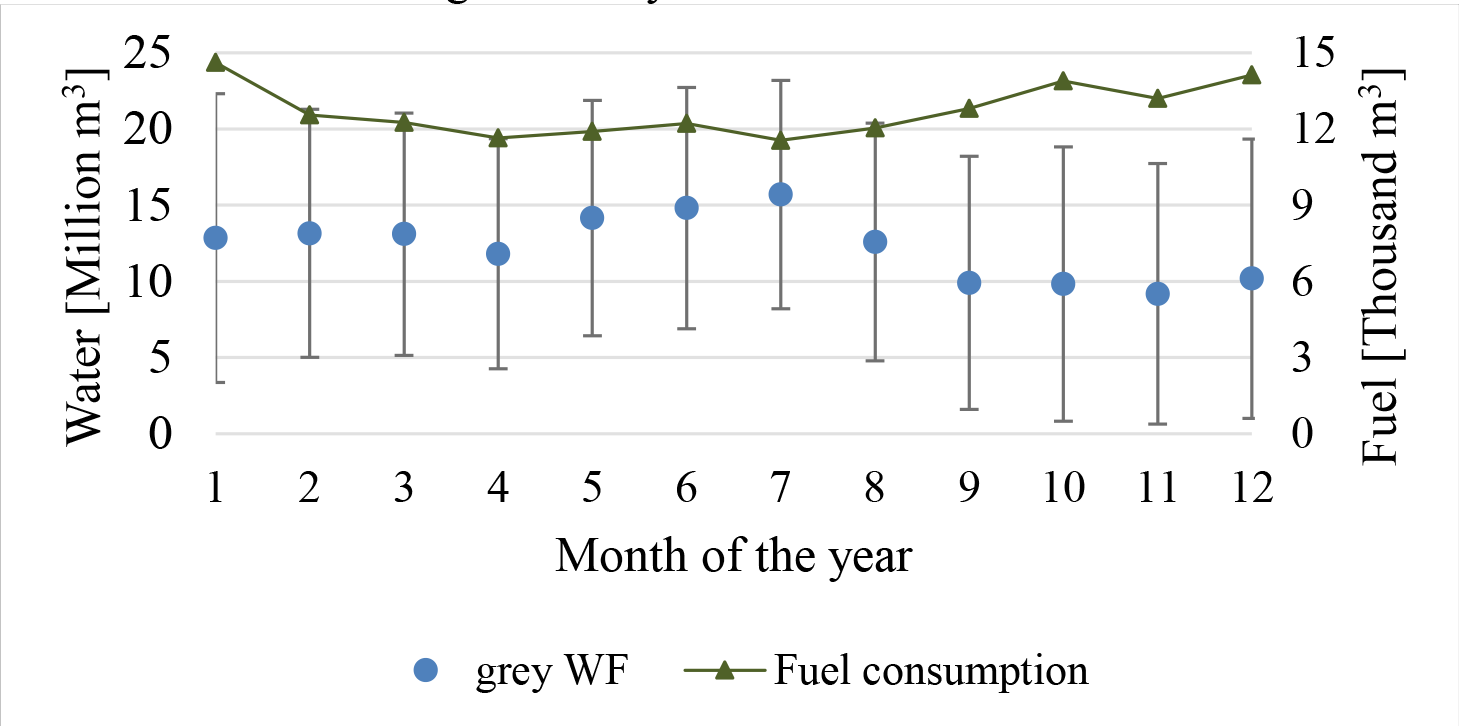
Figure 4 shows the multiannual monthly average of the volumetric grey WF against the multiannual monthly average of fuel consumption. Figure 5 shows the multiannual monthly average of the grey WF per unit of electricity generated for the Trinitaria power plant.
Trinitaria power plant − multiannual monthly average of the grey WF and the fuel consumption
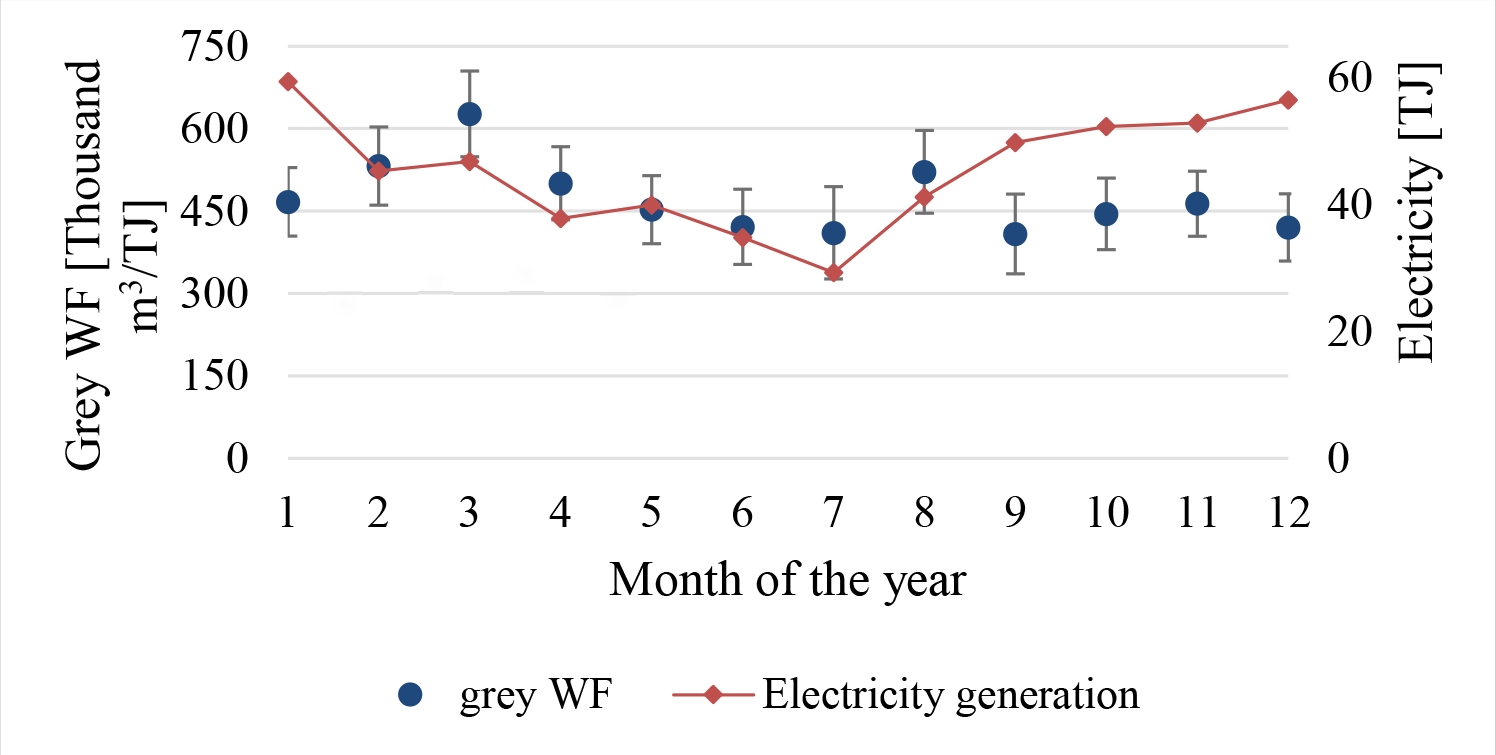
Trinitaria power plant − multiannual monthly average of the grey WF per unit of electricity generated and the electricity generated
Figures 4 and 5 show similar trends to those observed in Figures 2 and 3. Nonetheless, besides the magnitude of the fuel consumption and electricity generation, the main difference between these two sets of results is that the electricity production and fuel consumption from Trinitaria have less variation throughout the year than in the case of Gonzalo Zevallos.
Despite being similar to the other two power plants, Trinitaria produces more electricity than Gonzalo Zevallos during the months with larger hydropower production in the grid because Gonzalo Zevallos has two generation units while Trinitaria only has one. Therefore, it is easier for Gonzalo Zevallos to reduce its production significantly without turning off the whole power plant by shutting down one of the generation units.
Moreover, it is also the case that during the middle of the year, Trinitaria is working under a lower ratio between electricity generated and fuel consumed, so the grey WF is larger than the rest of the year.
Figure 6 shows the multiannual monthly average of the volumetric grey WF against the multiannual monthly average of fuel consumption. Figure 7 shows the multiannual monthly average of the grey WF per unit of electricity generated for the Anibal Santos power plant.
Aníbal Santos power plant − multiannual monthly average of the grey WF and the fuel consumption
Aníbal Santos power plant − multiannual monthly average of the grey WF per unit of electricity generated and the electricity generated
There is a stark difference between Figures 6 and 7 compared to Gonzalo Zevallos and Trinitaria. First, the uncertainty is much less in this power plant than in the other two. For Gonzalo Zevallos and Trinitaria, the difference between the uncertainty calculation's lower and upper end can be threefold or sixfold, respectively. However, for Aníbal Santos, this difference is only about 25%.
Furthermore, Aníbal Santos has a smaller grey WF than its counterparts during June and July. This is because there is practically no generation from the power plant during those months due to the seasonality of the electricity generation in the Ecuadorian mix [23], and the little generation they produce is ensured to be produced with a higher ratio of electricity generated against fuel consumed than its counterparts.
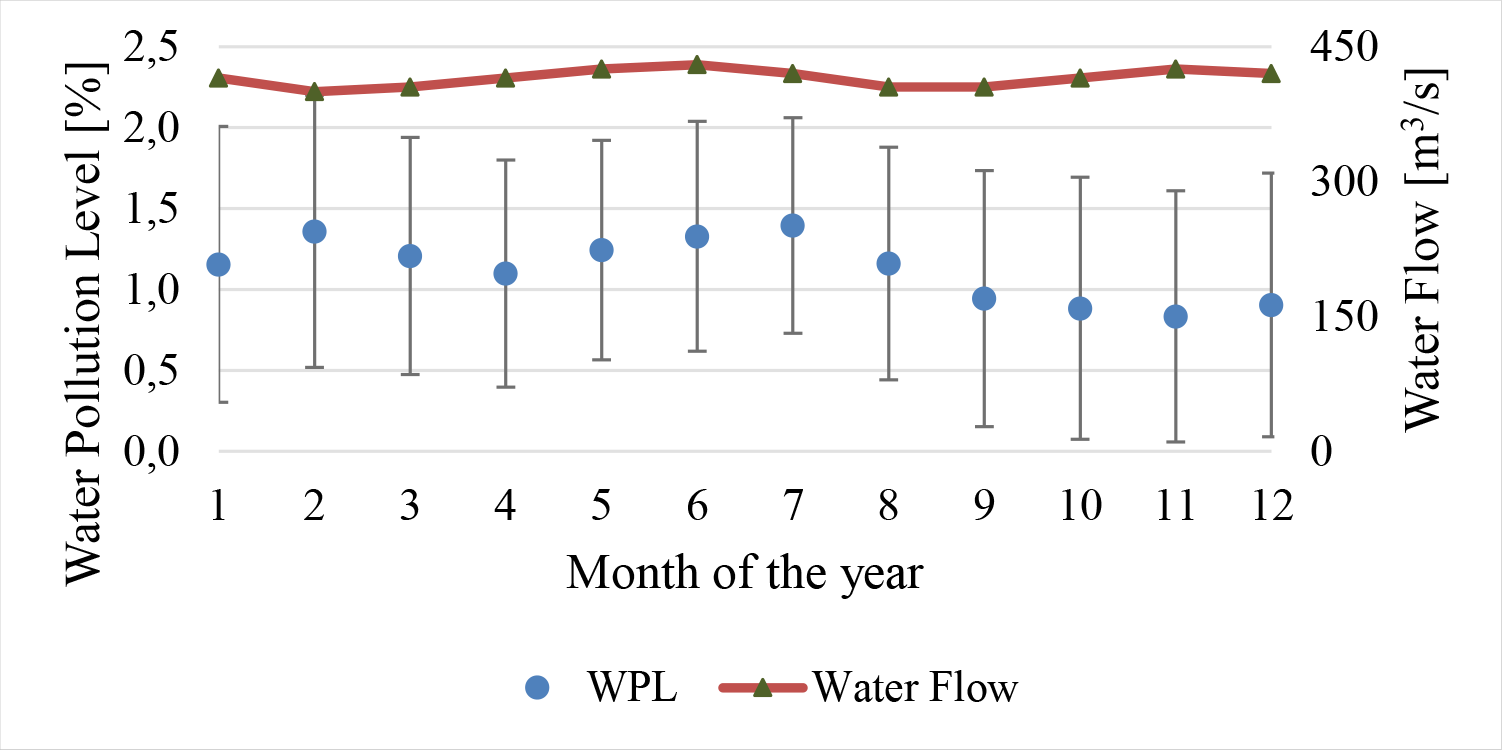
Two estimations define the possible impact of the grey WF in the water bodies: WPL and the comparison between WF colours. For the WPL, the grey WF of the power plants needs to be summed up if more than one discharges its water into the same basin. In our case study, two power plants, Gonzalo Zevallos and Aníbal Santos, discharge into the same water body. Figure 8 shows the WPL of Gonzalo Zevallos and Aníbal Santos against the monthly variation of water availability in the Tres Bocas Estuary.
Thermal Water Pollution Level of Gonzalo Zevallos and Aníbal Santos into the Tres Bocas Estuary
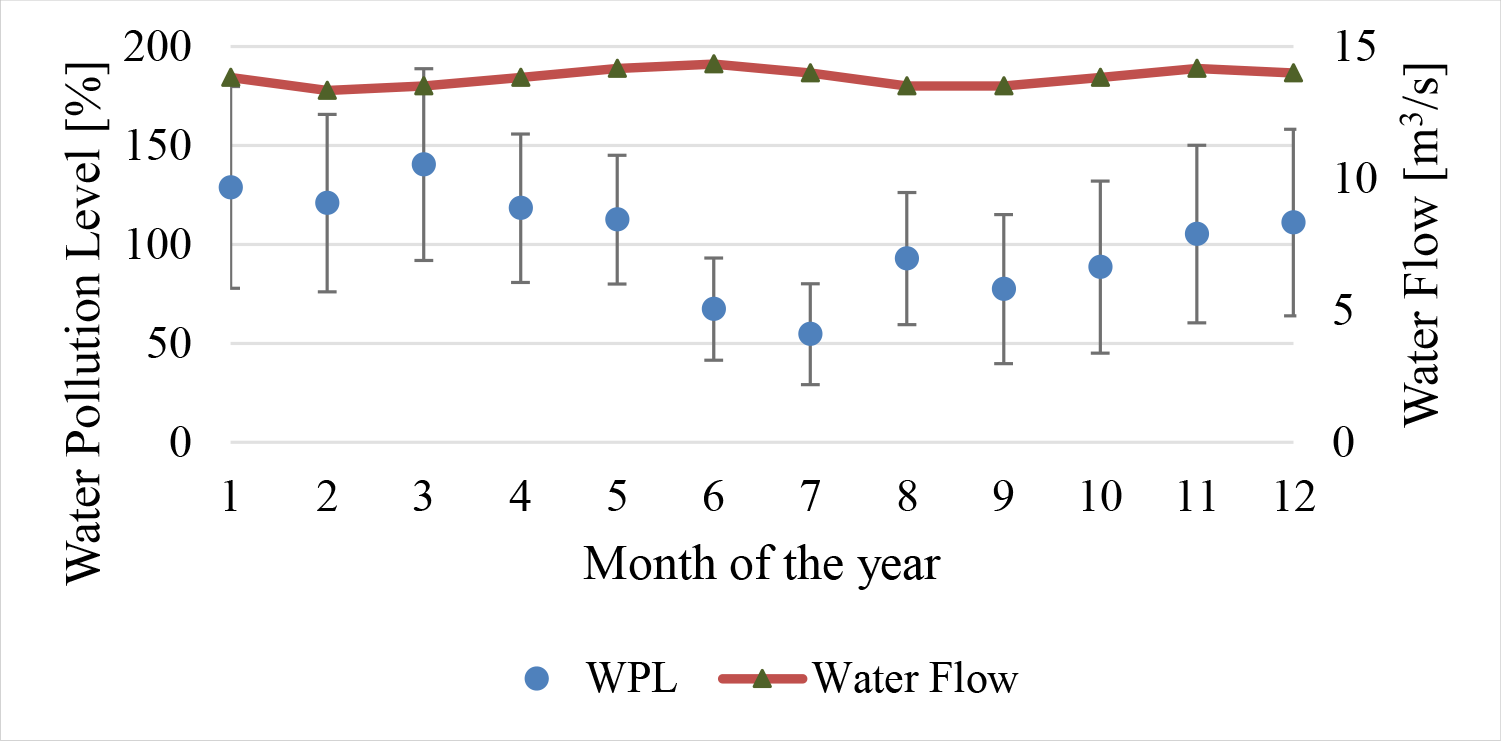
Figure 8 shows that the Tres Bocas Estuary is thermally polluted. Seven months of the year, the estuary has a WPL above 100%, meaning that the available water, in the closeness of the discharge of Aníbal Santos and Gonzalo Zevallos, is not enough to dilute the warm water from these power plants.
Figure 9 shows the WPL of Trinitaria against the monthly variation of water availability in the El Muerto Estuary. Contrary to what was observed in Figure 8 for the Tres Bocas Estuary, El Muerto Estuary has enough water, in the closeness of Trinitaria, to dilute the warm water discharged by this power plant.
Thermal Water Pollution Level of Trinitaria on El Muerto Estuary
Regarding the comparison to other WF colours, Figure 10 shows the difference in the order of magnitude of the annual blue and grey WFs of the thermal power plants assessed. It shows that the grey WF of these three power plants can be up to three orders of magnitude larger than the blue WF. It also shows that the three power plants have similar blue and grey WFs.
Comparison between grey and blue WF of the three power plants; the blue WF was derived from Vaca-Jiménez et al. [23]

A significant difference exists between the WPL of one estuary over the other. This occurs due to the volume of water available between the two estuaries. The Tres Bocas Estuary is at the end of the whole estuary; therefore, the water available is limited. Conversely, the El Muerto Estuary is downstream; thus, more water flows through that point.
There is also a large difference between blue and grey WF components. It was somewhat expected, considering that once-through cooling systems’ water withdrawal is around two orders of magnitude larger than what it consumes [10]. Therefore, future assessments of possible impacts regarding the use of water resources and the impact of electricity generation on water bodies must consider the grey WF if the power plant assessed is working under a Rankine thermodynamic cycle with once-through cooling systems.
It is paramount to distinguish between WF components. As this paper showed, only a few power plants of all the Ecuadorian electricity mix produce a grey WF in terms of thermal pollution. However, as Vaca-Jiménez et al. [23], [27] described, most thermal power plants have a blue WF.
The WF concept was conceived as an environmental impact indicator of anthropogenic activities described as the actual volumetric requirement of freshwater [4]. According to that definition, any use of saline water should be considered with a value of zero. The reasoning behind the discrimination of types of water considers that freshwater availability is limited, freshwater bodies have limited volumes compared to saline water bodies, and freshwater is used for other anthropogenic purposes [38].
Despite this, the description and calculation of the grey WF of the Ecuadorian power plants are relevant because the saline water used by these power plants is not seawater but the water of estuaries. As freshwater, estuaries have limited water availability volumes [8]. They do not have the practical infinite water availability of oceans to dissolve any pollutant. Moreover, estuaries’ ecosystem has a delicate balance, as they have shallower water than seawater [7]. The impact of thermal pollution can be larger than in seawater [39]. Therefore, the impact of the large grey WF on these water bodies is, arguably, as significant as those of freshwater bodies. Considering that once-through cooling systems using saline water in thermal power plants are common [40], the discussion of the thermal water pollution due to electricity generation by these power plants must include those using estuaries as their source of cooling water.
Nonetheless, this indicates that the comparison of the grey WF with other colours of the WF is only representative of volume and should not be considered a valid comparable indicator of environmental impact between components of the total WF.
There is a significant lack of precise data to calculate the grey WF. This situation increases the uncertainty of the calculations and, therefore, the possible conclusions that can be drawn from the results.
To reduce the uncertainties, the results were presented within a range considering the differences in the efficiencies of the boiler, turbine, and electric generator. Similar approaches have been used in previous studies. The difference between the range of uncertainty presented in the results depends on the combination of these efficiencies. Based on what was reported by CELEC-EP Electroguayas [31], Gonzalo Zevallos has a combined turbine and generator efficiency of 0.3871, while Trinitaria of 0.4594 and Aníbal Santos of 0.4165. That is why Gonzalo Zevallos has a larger range of uncertainty than the other two power plants.
Furthermore, the order of magnitude of our grey WF is around the same as those reported in the literature, i.e., Chini et al. [36], so the uncertainty is acceptable. Unfortunately, due to the novelty of this study, in which the grey WF of a saline water body is assessed; the method used to calculate this grey WF; and the different characteristics of the power plants studied in this paper (type of fuel and climate), further comparisons with other results obtained in the literature is not possible, i.e., against the work made by Chai et al. [12].
Moreover, due to a lack of available data regarding the natural discharge of the water bodies where the thermally polluted water was discharged, the assessment was made using the available data from the nearest hydrological probe. Such a major assumption introduces considerable uncertainty to the results.
All in all, the grey WF calculated for Ecuadorian thermal power plants only represents the possible impact of thermal pollution and must be used as such. More detailed work needs to be done to estimate a more precise grey WF of these power plants and the possible environmental impact on the bodies of water.
This paper assessed the thermal pollution-related grey WF produced by thermal power plants in Ecuador by quantifying the heat they discharged every month and comparing it with the water availability in the bodies of water that serve as heat sinks for these power plants.
Only power plants that require active (once-through) cooling systems will generate significant grey WFs. This situation limits the number of thermal plants in Ecuador that can produce environmental impacts due to water discharged at high temperatures. Only three thermal power plants of the 185 operational during 2020 produced a grey WF related to thermal pollution in the country.
Despite this, the grey water footprint can be up to three orders of magnitude larger than the blue water footprint due to the significant difference between the amount of water withdrawn and consumed by once-through cooling systems. The difference indicates that the water bodies require a larger volume of water to dilute the thermal pollution than to compensate for the water consumed by the power plant's cooling system. This fact suggests that if the available water for the power plant is limited, it must be defined by considering thermal pollution.
The country has only possible impacts due to thermal pollution in estuaries. No thermal plants use fresh water for once-through cooling systems; therefore, freshwater bodies have no thermal pollution. However, the results obtained indicate that contrary to the blue WF, the possible environmental impacts of the grey WF for saline water bodies (in this case, estuaries) are significant. The result of the thermal water pollution level of the Tres Bocas Estuary showed that this water body might not have enough water to dilute the thermal pollution from Gonzalo Zevallos and Aníbal Santos.
Finally, the results of this study also indicate that, despite having high grey water footprints, the environmental impact can be minimal if the amount of water flowing in the vicinity of the water discharge from the thermal power plant is sufficient to dilute the pollutant, as in the case of El Muerto Estuary.
This paper is a product of the support and funding of the Escuela Politécnica Nacional.
- ,
Design and Efficacy of Solar Disinfection System for Improved Rural Household Water Treatment ,J. Sustain. Dev. Energy, Water Environ. Syst. , Vol. 9 (4),pp 1–16 , 2021, https://doi.org/https://doi.org/10.13044/j.sdewes.d8.0369, Dec. - ,
The Role of Power Consumption and Type of Air Conditioner in Direct and Indirect Water Consumption ,J. Sustain. Dev. Energy, Water Environ. Syst. , Vol. 6 (4),pp 665–673 , 2018, https://doi.org/https://doi.org/10.13044/j.sdewes.d6.0202, Dec. - ,
Modelling of smart irrigation with replan and redistribution algorithms ,J. Sustain. Dev. Energy, Water Environ. Syst. , Vol. 10 (3),pp 1–17 , 2022, https://doi.org/https://doi.org/10.13044/j.sdewes.d9.0409, Sep. - , , The Water Footprint Assessment Manual, 2011
- ,
Past, Present and Future use of Municipal Water and Freshwater Resources of the Bekkersdal Community, Westonaria, South Africa ,J. Sustain. Dev. Energy, Water Environ. Syst. , Vol. 5 (3),pp 430–446 , 2017, https://doi.org/https://doi.org/10.13044/j.sdewes.d5.0155, Sep. - ,
Water Availability Footprint Addressing Water Quality ,J. Sustain. Dev. Energy, Water Environ. Syst. , Vol. 7 (1),pp 72–86 , 2019, https://doi.org/https://doi.org/10.13044/j.sdewes.d6.0223, Mar. - ,
Phytoplankton community structural reshaping as response to the thermal effect of cooling water discharged from power plant ,Environ. Pollut. , Vol. 285 ,pp 117517 , 2021, https://doi.org/https://doi.org/10.1016/j.envpol.2021.117517, Sep. - ,
Notas hidrológicas de aguas superficiales ecuatorianas según indicadores biológicos-foraminíferos plactónicos ,Acta Ocean. del Pacífico , Vol. 7 (1),pp 29–39 , 1992 - ,
Water and Energy ,Annu. Rev. Energy Environ. , Vol. 19 ,pp 267–99 , 1994 - ,
Life cycle water use for electricity generation: a review and harmonization of literature estimates ,Environ. Res. Lett. , Vol. 8 (1),pp 015031 , 2013, https://doi.org/https://doi.org/10.1088/1748-9326/8/1/015031 - , , Water in the Energy Industry: An Introduction, 2013
- ,
Assessing life cycle water use and pollution of coal-fired power generation in China using input-output analysis ,Appl. Energy , Vol. 231 (September),pp 951–958 , 2018, https://doi.org/https://doi.org/10.1016/j.apenergy.2018.09.178 - ,
The water footprint of humanity ,Proc. Natl. Acad. Sci. , Vol. 109 (9),pp 3232–3237 , Feb. 2012, https://doi.org/https://doi.org/10.1073/pnas.1109936109 - ,
The blue and grey water footprint of construction materials: Steel, cement and glass ,Water Resour. Ind. , Vol. 19 (April),pp 1–12 , 20172018, https://doi.org/https://doi.org/10.1016/j.wri.2017.11.002 - ,
The water footprint of poultry, pork and beef: A comparative study in different countries and production systems ,Water Resour. Ind. , Vol. 1–2 ,pp 25–36 , 2013, https://doi.org/https://doi.org/10.1016/j.wri.2013.03.001 - ,
The Nexus: Estimation of Water Consumption for Hydropower in Brazil ,J. Sustain. Dev. Energy, Water Environ. Syst. , Vol. 7 (1),pp 122–138 , 2019, https://doi.org/https://doi.org/10.13044/j.sdewes.d6.0229, Mar. - ,
Freshwater for Cooling Needs: A Long-Run Approach to the Nuclear Water Footprint in Spain ,Ecol. Econ. , Vol. 140 ,pp 146–156 , 2017, https://doi.org/https://doi.org/10.1016/j.ecolecon.2017.04.032 - ,
Powertrain architectures of electrified vehicles: Review, classification and comparison ,J. Franklin Inst. , Vol. 352 ,pp 425–448 , 2013, https://doi.org/https://doi.org/10.1016/j.jfranklin.2014.04.018 - ,
Linking electricity and water models to assess electricity choices at water-relevant scales ,Environ. Res. Lett. , Vol. 7 (4), 2012, https://doi.org/https://doi.org/10.1088/1748-9326/7/4/045804 - ,
Cooling water use in thermoelectric power generation and its associated challenges for addressing water-energy nexus ,Water-Energy Nexus , Vol. 1 (1),pp 26–41 , 2018, https://doi.org/https://doi.org/10.1016/j.wen.2018.04.002, Jun. - ,
Grey water footprint and interprovincial virtual grey water transfers for China's final electricity demands ,J. Clean. Prod. , Vol. 227 ,pp 111–118 , 2019, https://doi.org/https://doi.org/10.1016/j.jclepro.2019.04.179, Aug. - ,
Global freshwater thermal emissions from steam-electric power plants with once-through cooling systems ,Energy , Vol. 97 ,pp 46–57 , 2016, https://doi.org/https://doi.org/10.1016/j.energy.2015.12.107, Feb. - ,
The water footprint of electricity in Ecuador: Technology and fuel variation indicate pathways towards water-efficient electricity mixes ,Water Resour. Ind. , Vol. 22 ,pp 100112 , 2019, https://doi.org/https://doi.org/10.1016/j.wri.2019.100112, Dec. - , , Thermodynamics: an engineering approach, 2014
- , , 2017
- ,
Water Use in the United States Energy System: A National Assessment and Unit Process Inventory of Water Consumption and Withdrawals ,Environ. Sci. Technol. , Vol. 52 (11),pp 6695–6703 , 2018, https://doi.org/https://doi.org/10.1021/acs.est.8b00139, Jun. - , Estadística Anual y Multianual del Sector Eléctrico Ecuatoriano, 2020
- , Methods for Estimating Water Consumption for Thermoelectric Power Plants in the United States, 2013
- , SISDAT-BI: Reportes de Información Estadística del Sector Eléctrico, Quito, 2020
- , , 2017
- , CELEC EP - Electroguayas. Personal communication
- , , 1992
- , Acuerdo Ministerial 97, 2015
- , Informacion Hidrológica, 2019
- , Tabla de mareas puertos del Ecuador, 2021
- ,
Grey water footprints of U.S. thermoelectric power plants from 2010–2016 ,Adv. Water Resour. , Vol. 145 (May),pp 103733 , 2020, https://doi.org/https://doi.org/10.1016/j.advwatres.2020.103733 - ,
Water-electricity nexus in Ecuador: The dynamics of the electricity's blue water footprint ,Sci. Total Environ. , Vol. 696 ,pp 133959 , 2019, https://doi.org/https://doi.org/10.1016/j.scitotenv.2019.133959, Dec. - ,
Water Footprint Assessment: Evolvement of a New Research Field ,Water Resour. Manag. , Vol. 31 (10),pp 3061–3081 , 2017, https://doi.org/https://doi.org/10.1007/s11269-017-1618-5 - ,
Foraminíferos planctónicos vivos en el mar ecuatoriano: Taxonomía y Distribución ,Acta Ocean. del Pacífico , Vol. 19 (1),pp 399 , 2014 - ,
A regional assessment of the water embedded in the US electricity system ,Environ. Res. Lett. , Vol. 14 (8),pp 084014 , 2019, https://doi.org/https://doi.org/10.1088/1748-9326/ab2daa, Jul.