


Climate change emerging as the biggest global challenge, Norway has ratified to Kyoto Protocol under the United Nations Convention on Climate Change. “Under the protocol, Norway must limit greenhouse gas emissions growth to 1% above 1990 levels by 2008-2012” [1]. The first nationally determined contribution to the Paris Agreement of Norway includes a commitment to reduce greenhouse gas emissions by at least 40% compared to 1990 levels by 2030. It signifies the role of renewable energy in achieving the energy transition in Norway and ensuring the necessary energy security due to deploying renewable energy sources. Norway is the world’s third-largest exporter of natural gas, covering around 2% of the global demand [2]. The renewable energy potential in Norway and strategies for its development have been discussed by emphasising wind energy and biomass energy [3].
Assuming that the exported energy is used to replace electricity generated by coal, the environmental effects of the development in Norway are found to be acceptable. The long-term projections of energy demand till 2050 indicate that decreased energy demand results in a higher renewable energy proportion in the overall demand [4]. Thus, renewable energy production increases with the increased energy demand. The use of bioenergy is recommended to implement energy efficiency measures in Norway. The share of electricity produced from renewable sources is highest in Norway in Europe, with the least emissions from the power sector [2].
European Union (EU) is among the most vulnerable geographical areas due to high energy dependency and scarcity of energy reserves [5]. Most of the countries in the European Union converge concerning renewable energy deployment and energy security along with technological diffusion and knowledge spillover. Analysing European energy security and evaluating the future of Norwegian gas production, the results reveal a limited potential for increased gas exports from Norway to the EU [6]. It was concluded that Norwegian gas production will be declining by 2030 in all scenarios. The shifts in energy demand, supply vulnerabilities, and risks for energy infrastructure are some of the possible threats to continental energy security [7].
Energy is a prerequisite for growth, and development is a significant input for all developing economies. However, conventional energy is perpetually associated with greenhouse gas emissions that are detrimental to the environment causing climate change. The definition of energy security as “adequate, affordable and reliable access to energy fuels and services” incorporates the environmental aspect of energy use. The availability of resources, decreasing dependence on imports, and decreasing pressures on the environment have also been incorporated into the definition of energy security [8]. Four wide dimensions of the framework, availability, accessibility, affordability, and acceptability (Four A of energy security), were adopted by [9].
The concept of the “Four A of energy security” was introduced by APERC (Asia Pacific Energy Research Centre) in 2007 [10]. For an economy to be energy secure, all four broad dimensions capture the performance by selected indicators. All the dimensions along various indicators are discussed in detail for conventional and non-conventional renewable energy sources. Sustainable Development Goals’ contribution emphasises access to energy projects; however, fuels and transport also play a significant role in contributing separate dimensions of sustainable development [11].
The World Energy Council released the Energy Trilemma Index report to assess countries’ energy performance worldwide [12]. The Energy Development Index developed by the World Energy Council concluded that Norway was determined as the highest national energy-performing country among the top ten countries selected for the analysis. The values of the Energy Security Index became positive in the period 2000-2008 as measured by the energy security index by deploying Principal Component Analysis for 28 countries in European Union [13]Click or tap here to enter text.. It was also concluded that energy intensity, GDP per capita, and carbon intensity significantly impact the energy security index.
A modified Principal Component Analysis (PCA method) was deployed by adopting a three-dimensional framework, vulnerability, efficiency, and sustainability to evaluate the energy security of resource-poor economies [14]. An urgent need for such economies to implement energy efficiency and conservation measures was emphasised. By constructing a framework for evaluating global and national energy security, the three dimensions, such as energy supply chain, energy consumption, and political-economic environment, were emphasised [15]. A balanced mix of public policies must be implemented to promote an effective energy transition [16].
Technological innovation, energy intensity, and structural change in the energy-intensive sectors affect a country’s energy security. One of the studies concluded that the Nordic countries have very low energy intensities and high energy efficiencies [17]. It was also concluded that technological innovations are effective in the renewable energy-growth nexus. In addition, renewable energy improves environmental well-being was demonstrated. Electricity prices play a crucial role in ensuring energy security for a country. It was argued that energy-intensive industries and consumers feared that electricity cooperation between Germany and Norway, leading to a rise in electricity prices was stipulated [18]. There is a political discourse on this issue, with one group favouring renewable energy cooperation as an essential step toward the European low-carbon energy future. Further, the development of the transmission network affects electricity prices, especially electricity trade in the Baltic countries [19].
The role of renewable energy was analysed in reducing carbon-dioxide emissions by comparing the costs of renewable energy systems with fossil fuels [20]. In addition to reducing carbon oxide emissions, renewable energy system generates a positive socio-economic effect, employment, and many other benefits from enhanced exports [21]. A nexus between trade and emissions prevail, and the composite effect increases emissions [22]. Trade and energy should be considered in emissions mitigation policy [22]. Rural community members gained knowledge and benefitted from greater development opportunities [23]. The research reported in [24] concluded that a solar photovoltaic system connected to the grid addresses the energy demands of rural settlements. Compared with the conventional system, energy and cost savings of approximately 32% and 28% are estimated [25].
By deploying the “Four A” energy framework and PCA method, renewable energy security was found to be declining in the region, depicting an immense need for a legal, regulatory framework for energy cooperation [26]. Increased development of renewable energy and energy efficiency technologies would move ASEAN in a positive direction toward achieving energy security and sustainable energy policy goals, indicating energy security compromise and reducing energy use [27]. A novel energy security assessment instrument comprising eleven broad dimensions has been adopted to evaluate the regional energy security situation in the Asia-Pacific region [28]. Energy security was also analysed by adopting five dimensions, availability, affordability, technology development, sustainability, and regulation [29]. Improvement of energy security as a result of energy efficiency improvement in the power sector was demonstrated [30]. Energy security was measured based on three main themes oil security, gas security, and sustainability. The structural change driven by the energy-intensive sectors is critical to energy demand and security. Thus, energy intensity is a significant factor affecting energy security. The studies have ignored the role of energy intensity and structural change in determining the energy security of a region or country.
In 2020, Norway updated and enhanced its nationally determined contribution under the Paris Agreement to reduce emissions by at least 50% and up to 55% by 2030 compared to 1990 levels [31]. The commitment to reduce emissions is plausible by adopting an energy transition. The deployment of renewable energy is one of the pathways of the energy transition; therefore, it is crucial to evaluate whether the deployment of renewable energy ensures energy security in Norway. In this context, in Norway’s case, the role of renewable energy (RE) deployment in ensuring energy security has been examined using a Renewable Energy Security Index (RESI). The energy security index for renewable energy is constructed for 2000-2017.
The correlation between energy efficiency and the deployment of renewable energy has been computed and analysed, considering various aspects of energy security. Energy efficiency and the deployment of renewable energy are two distinct pathways of the energy transition. It is crucial to examine the relationship between them, whether there is a trade-off or a positive correlation between the two plausible energy transition pathways. In addition, a change in the structural composition of the economy contributes significantly to determining the country’s energy requirement; therefore, the energy intensity and structural change as additional dimensions have been integrated into the study to compute the renewable energy security index.
The paper is organised under various headings. The method deployed has been described in the first part to achieve the paper’s objective. The Principal Component Analysis is presented under the Methods, along with the description and formulation of the model. In the next heading of Discussion, the current status and capacity of renewable energy are discussed as a sub-heading, along with the role of renewables in the energy transition in Norway. The results of the PCA method have been discussed and compiled as the third sub-heading of the Discussion. The entire discussion of the Renewable Energy Security Index (RESI) has been categorised under sub-headings to elaborate the discussion of correlation analysis among the four dimensions of RESI, along with the energy intensity and structural component. The detailed discussion on all four aspects of RESI, Availability, Affordability, Accessibility, and Acceptability, has been presented separately in the subsections devoted to results analysis.
The formulation of the RESI is based on selected indicators on variables chosen from the 4A model on energy security. RESI is considered a variable that cannot be observed directly, essentially a latent variable, which is assumed to be linearly dependent on six indicators – the representation of the four aspects variables on the “Four A” model. Further, the secondary data on variable indicators were collected from the World Bank collection of development indicators and compiled from officially recognised international sources. The other sources are International Energy Agency (IEA), British Petroleum BP statistics, International Renewable Energy Agency (IRENA). Data accuracy is ensured by confirming from multiple sources as it presents the most current and accurate global development data available and includes national, regional, and global estimates. The calculations have been done to frame RESI on variable indicators.
Principal Component Analysis (PCA) is a method for reducing several variables to a lesser number, maintaining the same information regarding the analysis [32]. PCA-based energy security index has been constructed using SPSS (Version 22) statistical software. The PCA involves computing the eigenvalues of each selected variable [33]. The eigenvalues are multiplied with the corresponding component, and the product is added for each variable [33]. Later, the value of each variable is multiplied by the corresponding weight, and the sum of cross products is divided by total weights to obtain one composite index [34], [35].
The “Four A” energy framework has been adopted to compute RESI. The four main components, Availability, Accessibility, Affordability, and Acceptability, are evaluated by selecting appropriate indicators. The secondary data from the World Bank databank are deployed to extract the selected indicators to compute RESI. However, this study adopts six dimensions to explain energy security for renewable energy; energy intensity and structural composition are considered in addition to the main components.
All attributes that explain the energy security of renewable energy sources are reflected in one comprehensive index referred to as RESI. These attributes are interlinked and interconnected to each other, describing the variance-covariance structure of variables through linear combination [35]. Comprehensive composite indicators are provided for policymakers, academics, and other stakeholders [36].
The following steps clearly describe the computation of RESI [34].
(1)
Where RESI denotes Renewable Energy Security Index and X'1,…, X'6 are the indicators selected to reflect the aspects of RESI (security dimensions), such as Availability, Affordability, Accessibility and Acceptability, Energy Intensity, and Structural Change, and µ is the error term [37]. The values of explanatory variables in eq. (1), X'1,…, X'6 are are normalised as explained in eq. (2). The αi with subscript i = 1,…, 6 are partial slope coefficients of explanatory variables X. The αi addresses the extent of the impact of the i-th dimension on the security index when other dimensions are fixed or kept constant.
The steps involved in computing RESI are as follows [37].
The normalisation of variables uses the max-min normalisation technique, as reflected in eq. (2).
(1)
Where k reflects the selected indicators of RESI. The normalisation transforms each variable to a scale of 0-1. The lowest value is 0, while 1 is the highest value of the selected normalised variable.
The correlation matrix R is computed, and the solution for the following equation is obtained.
(3)
Where I denotes the identity matrix. The above sixth-degree polynomial in ⋋ has roots that are the eigenvalues corresponding to the R matrix. The role of eigenvalues reflected by ⋋ is very crucial. The eigenvectors are computed for each eigenvalue. The eigenvector associated with the highest eigenvalue indicates the direction with the highest variance. The eigenvector with the highest eigenvalue is the Principal Component of the dataset. Six eigenvalues are obtained from eq. (3) and arranged in descending order, ⋋1 > ⋋2 > ⋋3 > ⋋4> ⋋5 > ⋋6.
For each value ⋋j, the following equation is solved.
(4)
Where R'j = [r1j, r2j, …, r6j] is 1×6 eigenvector corresponding to ⋋j, subject to the condition that R'jRj = I.
Six eigenvectors are obtained R'1, R'2, …, R'6, corresponding to ⋋1, ⋋2, …, ⋋6. Further, six principal components are constructed with eigenvectors corresponding to eigenvalues ⋋k as follows: F1k = X'k R'1 ……. F6k = X'k R'6, where X'k = [X'k1, X'k2, …, X'k6] is a vector of normalised indicators. The principal component values are constructed, and the total variation in all selected variables is accounted for by the mutually orthogonal principal components.
The weighted sum of six principal components generates the RESI.
(5)
Rearranging the weighted components of RESI will help assess the relative importance of respective indicators in determining the RESI score.
Energy security for renewable energy has been conceptualised by deploying the framework of the “Four A” definition incorporating Availability, Accessibility, Affordability, and Acceptability. However, the energy framework presented in this study differs from the established “Four A” energy framework in that renewable energy security incorporates two more components for energy requirement, Energy Intensity, and Structural Change in the economy.
The four aspects of RESI are explained by several selected indicators. The self-sufficiency in conventional energy and the proportion of renewables in total energy consumption are two aspects of the
In addition, social equity and transmission and distribution losses are two main indicators of the
Description of variables that determine six dimensions of the Renewable Energy Security Index (RESI)
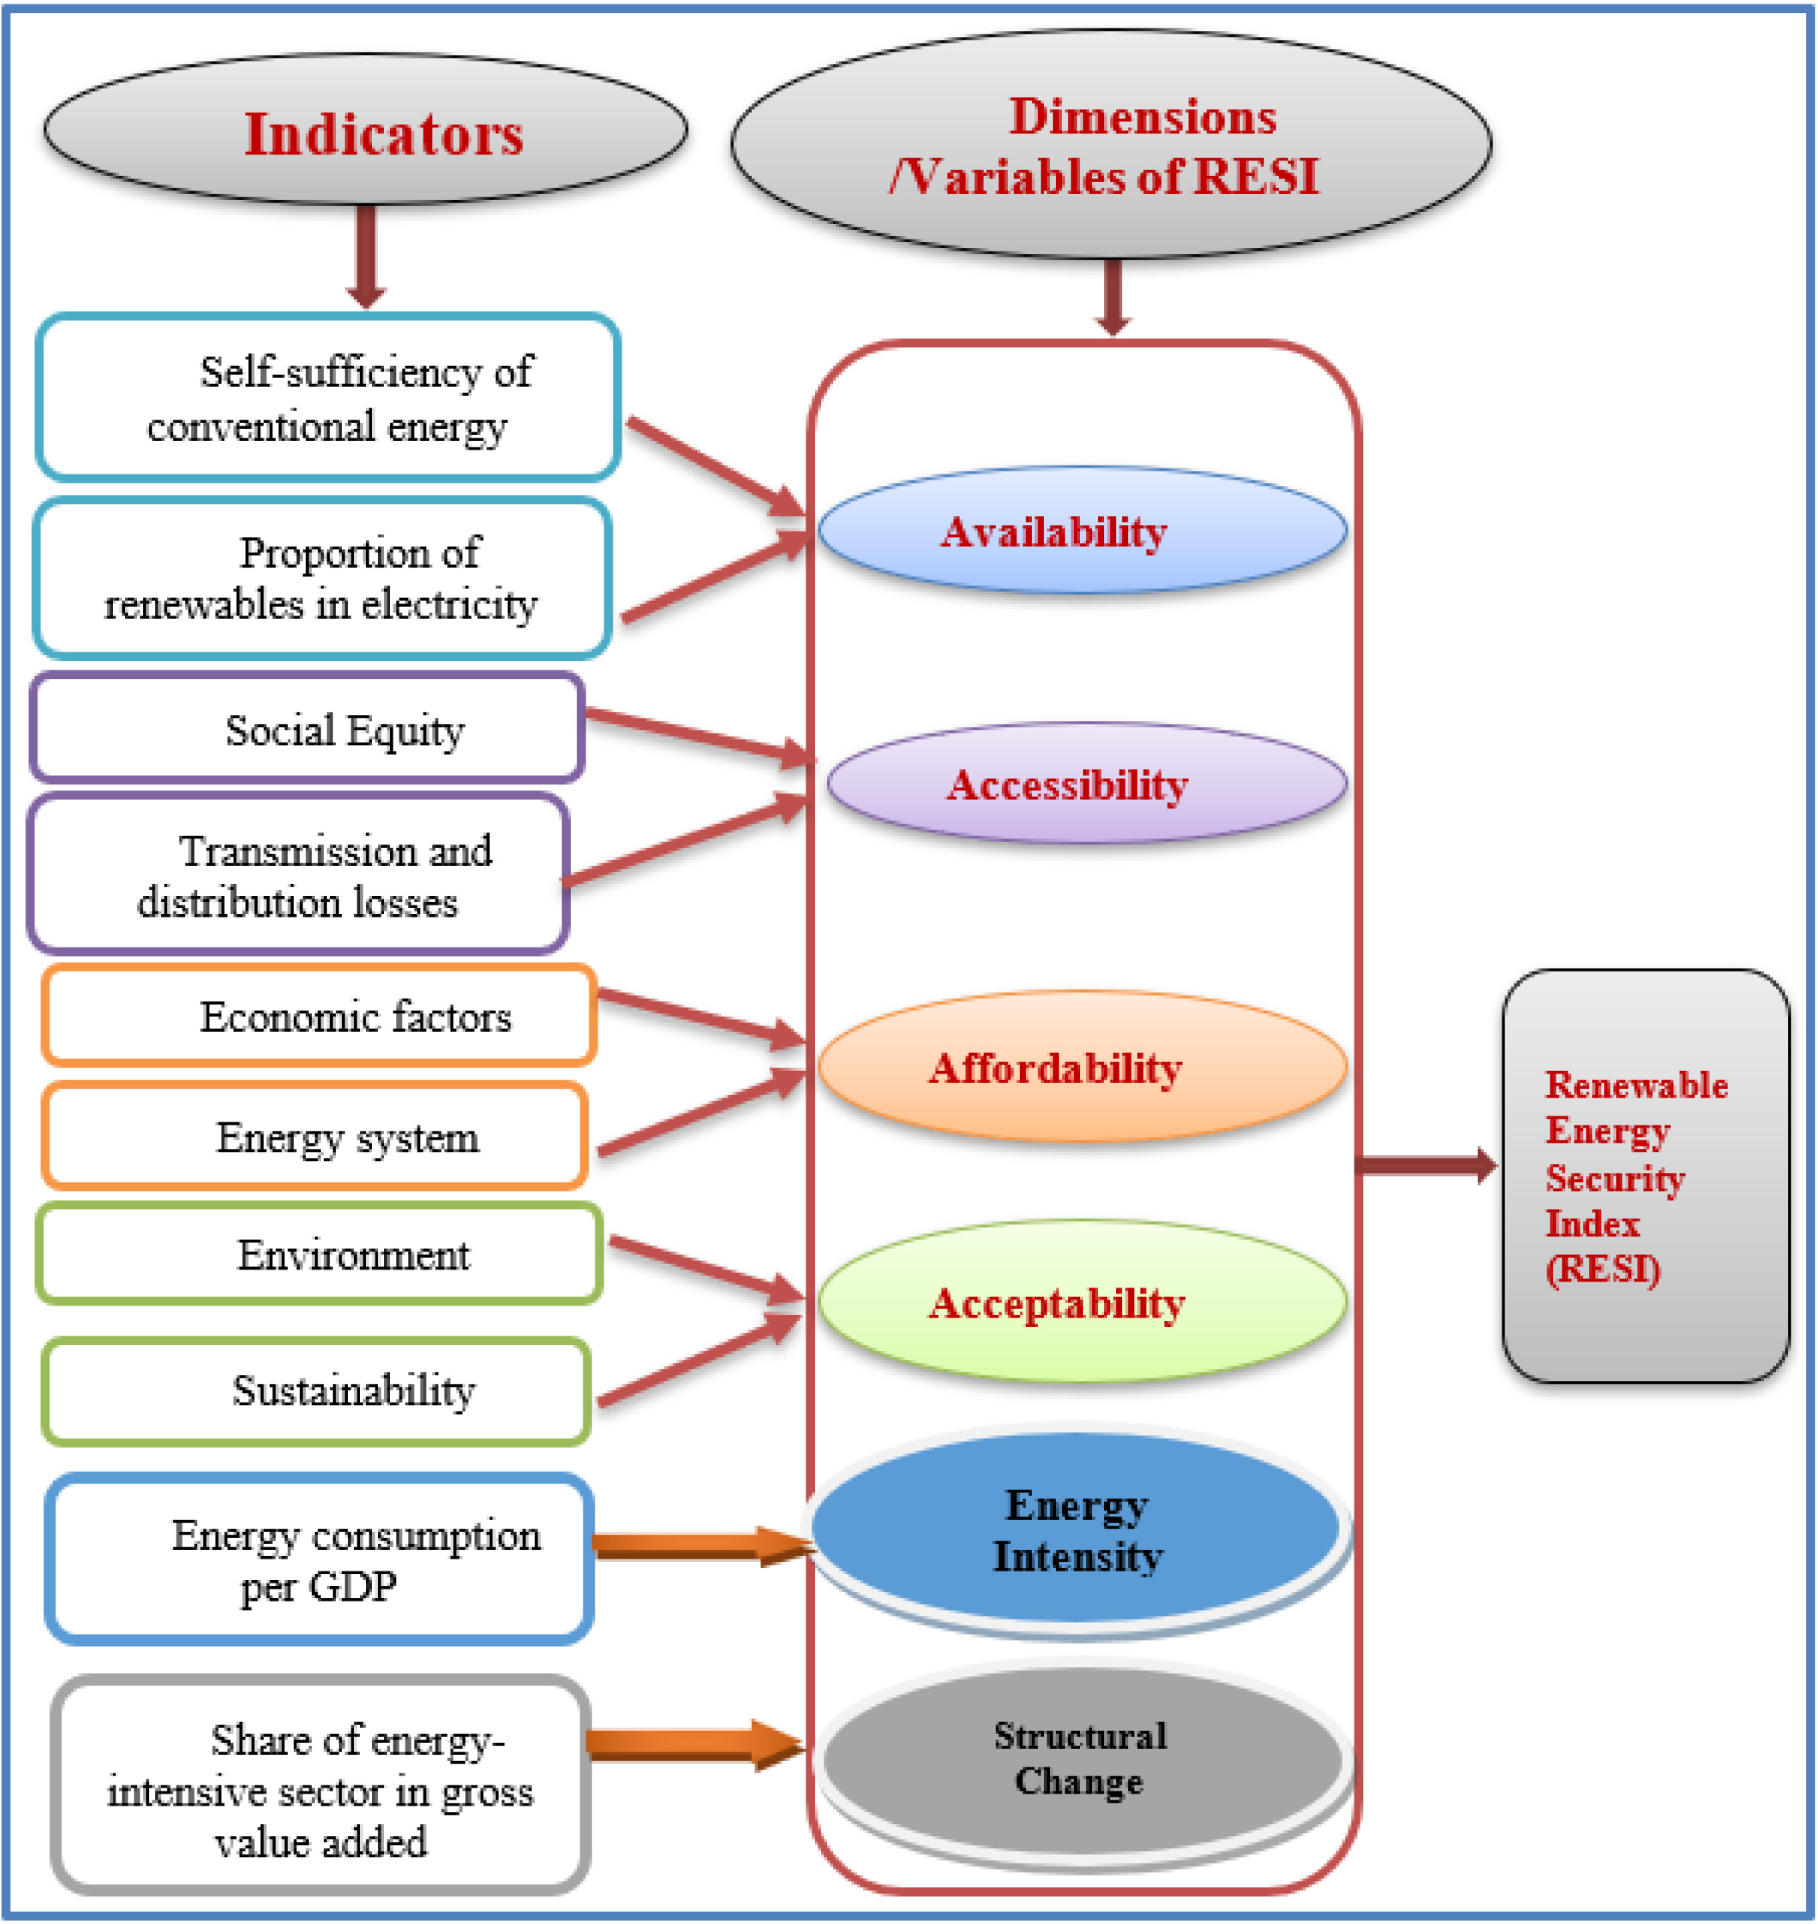
The energy requirement plays a critical role in determining energy security. There are two aspects or indicators of energy requirement. One is the
In the computation of RESI, the study adopts six dimensions or variables that reflect the value of k from 1 to 6. The selected variables discussed above are Availability, Accessibility, Affordability, Acceptability, Energy Intensity, and Structural Change. The schematic diagram below clearly depicts a detailed outline of indicators that correspond to six variables or dimensions.
An index is constructed using the above indicators in Figure 1 that explains the variables of the six dimensions of RESI. Principal Component Analysis is used to construct this index, whereby a large number of variables that affect the components are reduced to a smaller set so that the index value finally obtained still retains all the information.
This section is essentially the fundamental component of the paper, providing the theoretical understanding of the ecological existence of energy and serving as a background for the 3E framework of energy use (Energy, Environment and Economy) adopted by the paper. Based on the formulation of the 3E framework, the economic system is evaluated concerning ecological and environmental energy use under the next subheadings. A brief account of the literature is further analysed to identify determinants of energy transition and the pathways to foster various forms of energy transition.
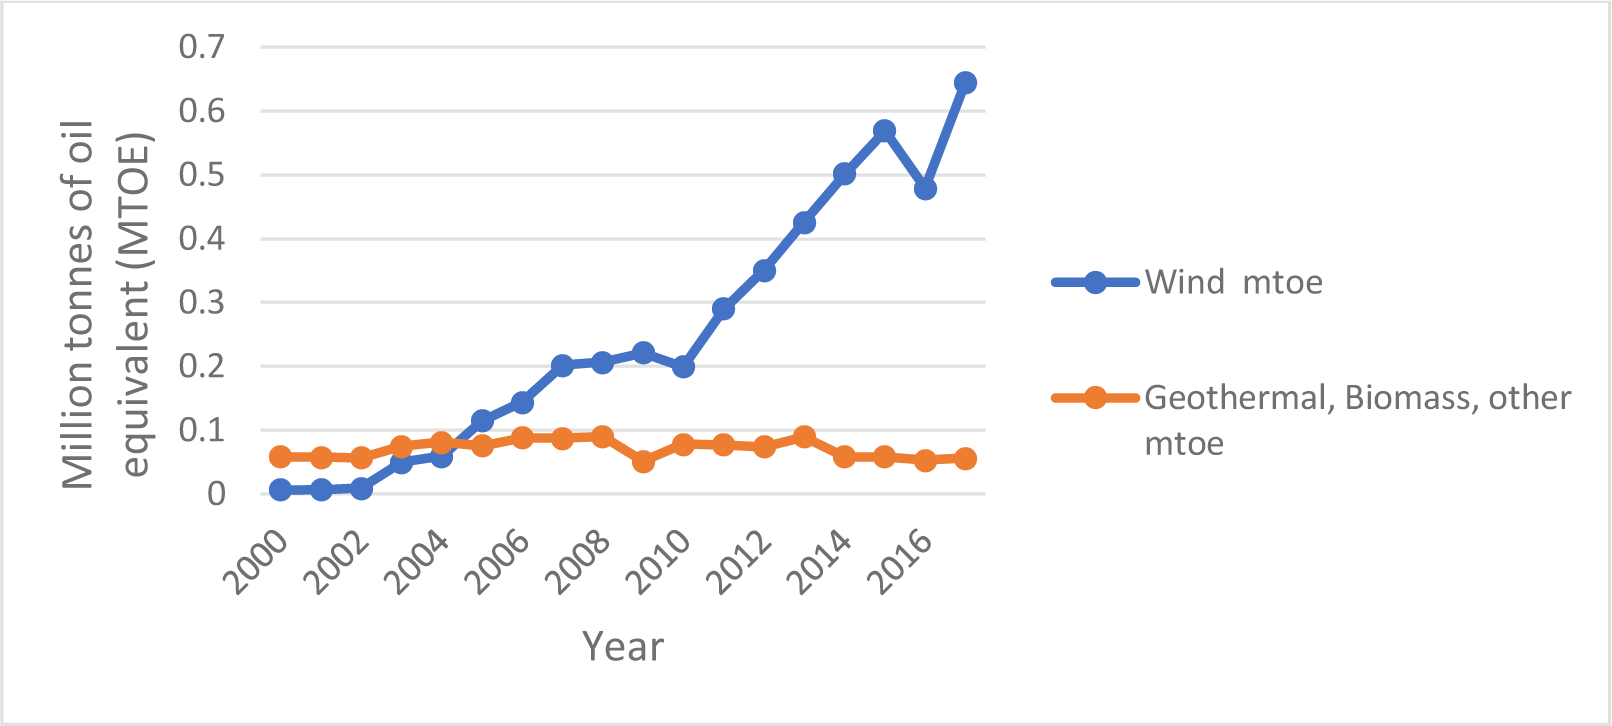
According to the Government of Norway [38], renewable energy accounts for 98% of total generation and around 60.8% of total consumption. In 2017, the renewable energy generation was 3.1 TWh, and consumption was around 0.644 mtoe (million tonnes of oil equivalent) [39]. According to BP Statistics [40], the generation of geothermal, biomass, and others accounted for 0.25 TWh, while consumption accounted for 0.05 mtoe. The trends were that both the generation and consumption of renewable energy increased after 2002 consistently, became constant between 2009-2010 and later increased to reach the maximum generation of 3.1 TWh and consumption of 0.7 mtoe (Figure 2).
Pattern of generation in renewable energy in Norway [40]
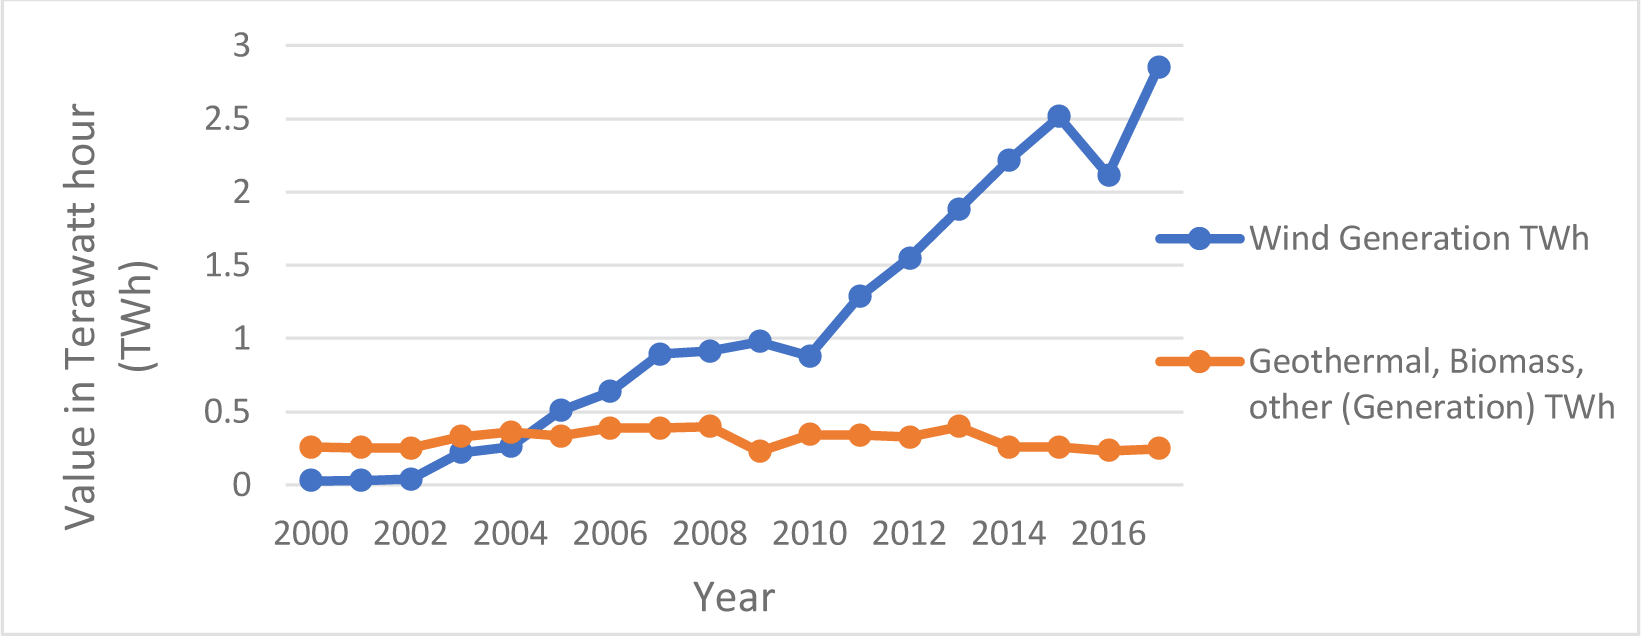
As evident from the figure, wind generation in Norway increases more than geothermal, biomass, or other generation. It is observed that wind energy drastically increased from 2010 onwards till 2015, reduced in 2016 and increased again till 2017. The contribution of energy sources such as geothermal, biomass, and others has maintained a constant level, and their contribution to total generation has not increased from 2000-2017.
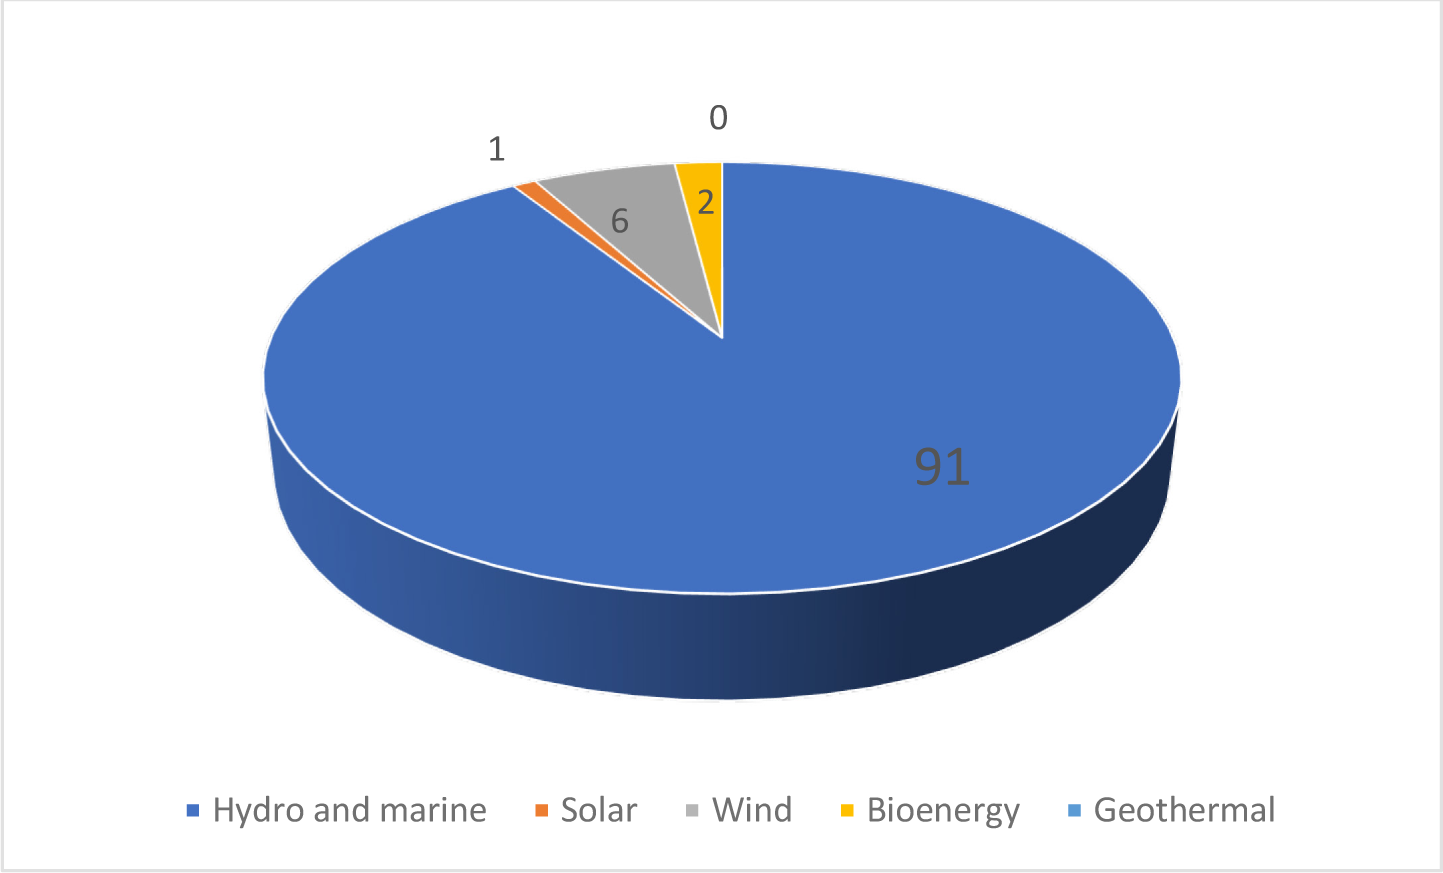
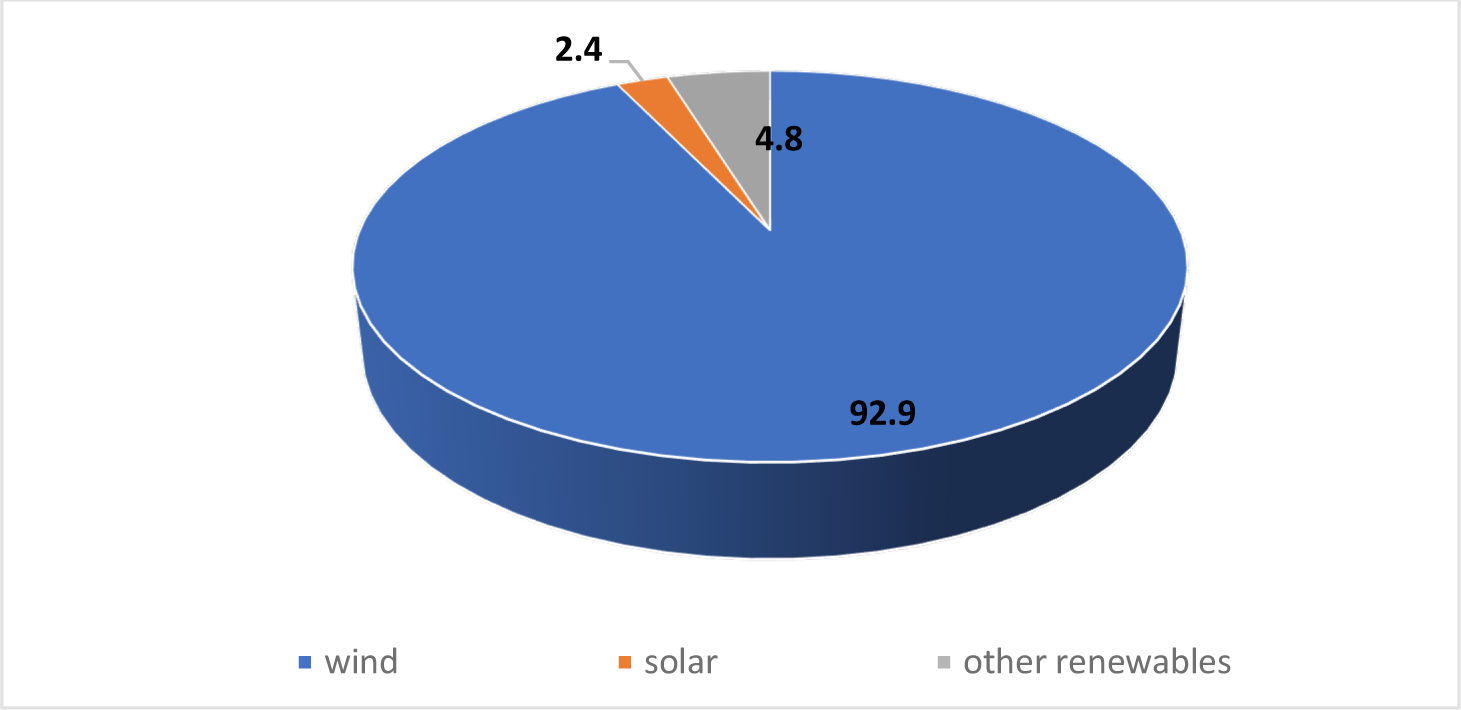
Figure 3 reveals that the energy consumption of wind also increases more than geothermal, biomass, and others, and the pattern is almost similar to the generation of wind and geothermal, biomass, and others. It is also evident that around 91% of total primary production is hydro and marine, as shown in Figure 4, and among other renewable energy sources, while 6% is contributed by wind energy. Similarly, energy consumption 2018 comprised approximately 93% of hydro and marine, 2.4% solar, and 4.8% other renewables, as shown in Figure 5.
Pattern of consumption of renewable energy in Norway [40]
Primary energy production RE in percentage, Norway 2018 [40]
Energy consumption RE in percentage, Norway 2018 [40]
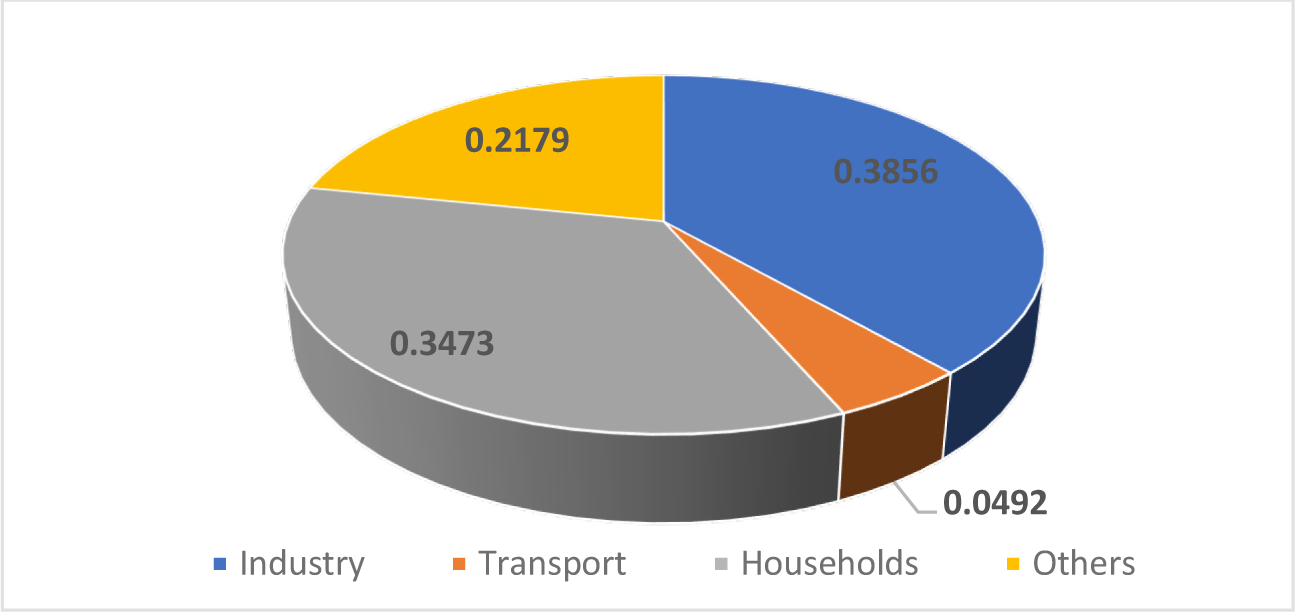
Regarding the consumption of renewable energy in various sectors, it can be seen in Figure 6 that in 2018, the industry consumed almost 39% of renewable energy, followed by households - 35% and other sectors - 22%. The transport sector consumed around 5% of renewable energy.
Sector-wise proportion of RE consumption, Norway 2018 [40]
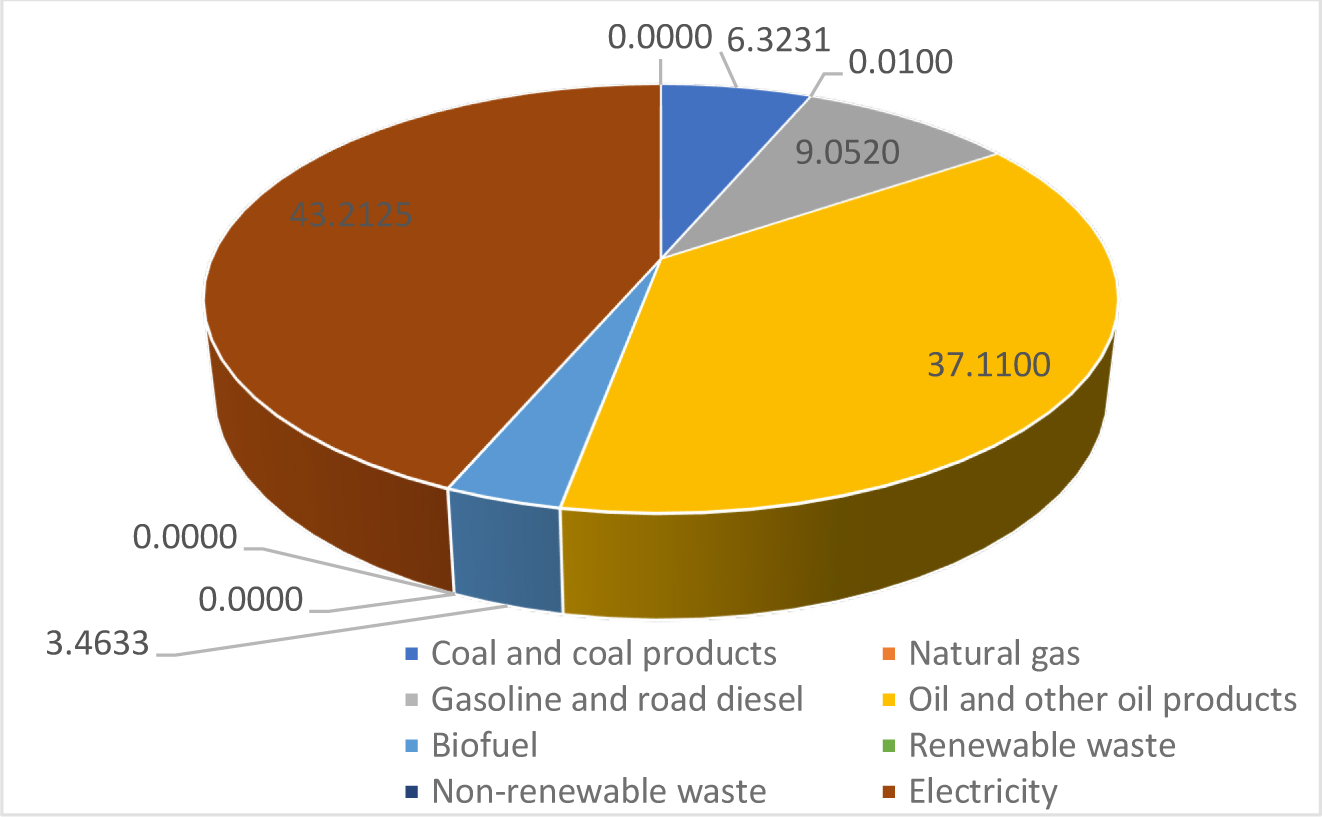
Among the total renewable energy imports, 43% is used for electricity, 37% for oil and oil products, 3.5% for biofuels, and 6% for coal and coal products, as indicated in Figure 7.
Imports of renewable energy in percentage, Norway 2018 [40]
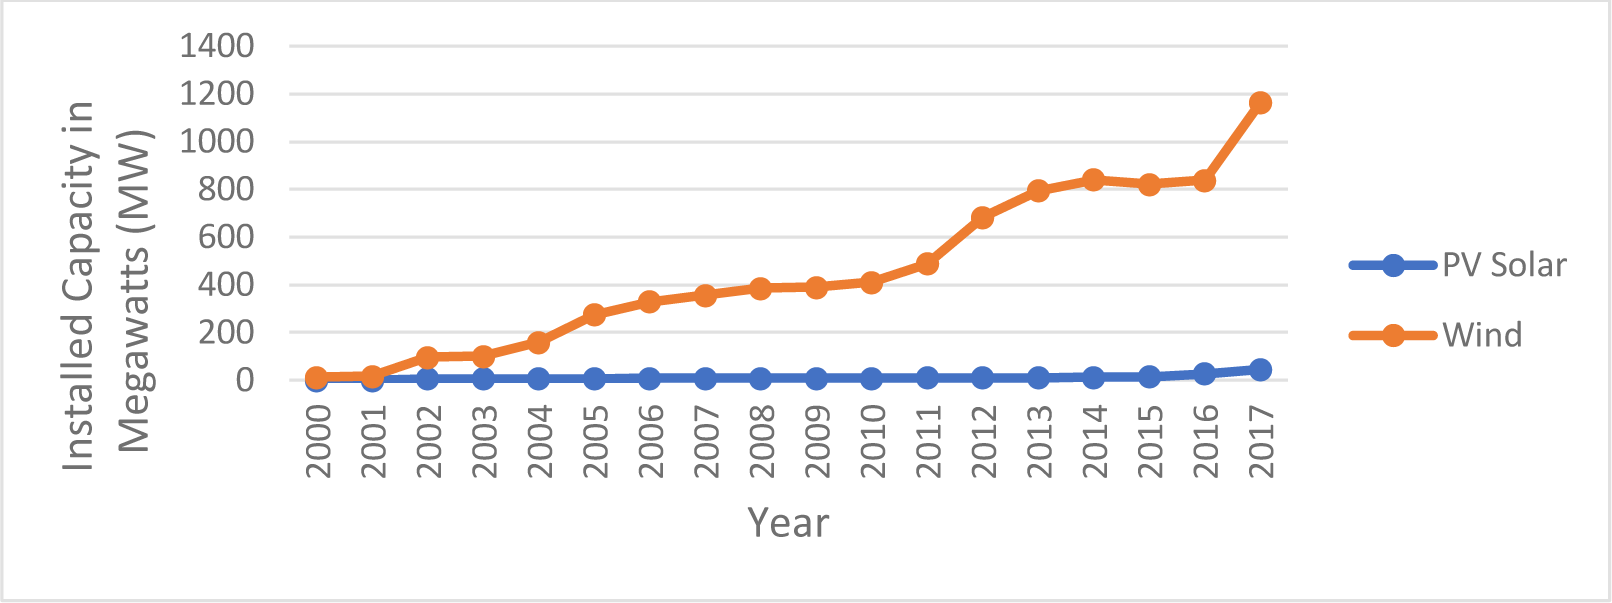
Norway’s SPV (Solar Photovoltaics) installed capacity increased from 6 MW in 2000 to 45 MW in 2017. On the other hand, the wind cumulative installed capacity has been drastically rising consistently from 2001 onwards, from 17 MW to 838 MW, with a sudden rise to 1162 MW in 2017, as observed in Figure 8.
Cumulative installed capacity of SPV and wind, Norway 2018 [40]
In 2016, Norway set a record of around 98% of electricity production coming through renewable energy sources [41]. The country has the highest share of electricity from renewable sources in Europe and the lowest emission from the power sector. According to the Ministry of Petroleum and Energy, the installed capacity of the Norwegian power supply system was 33,200 MW, and annual production was 139 TWh at the beginning of 2017. About 1550 hydropower plants contributed 96% of Norwegian production capacity, and 1000 storage reservoirs correspond to 70% of annual Norwegian electricity consumption.
Hydropower is the main source of RE production. The Norwegians started utilising the energy from rivers and waterfalls to produce energy in the late 1800s. Since then, hydropower has become an increasingly crucial part of the Norwegian economy [41]. The Ministry of Petroleum and Energy is responsible for petroleum offshore and energy supply and water resources management. Norway and its Nordic neighbours are world leaders in employing renewable energy, clean technology, and alternative fuels. Accepting several international commitments to reduce carbon dioxide and NOx emissions has become a challenge for Norway, given that it is the world’s 11th largest exporter of oil and the 3rd largest exporter of natural gas. Norway leads the world in clean technologies such as carbon capture and storage, offshore wind, and hydropower.
In 100 years, Norway has constructed more than 330 dams. Considering carbon capture and storage (CCS) as a high priority, Norway has played an important role in developing CCS technologies. A waste recycling plant in Oslo (Klementsrud) and a cement production site in Telemark (Brevik) have been funded by Norway as part of funding projects for CCS [42]. Solar power R&D and production has been a fast-growing sector of the global energy market. Several solar technology companies in Norway, such as REC Solar, REC Silicon, NorSun, and Scatec Solar, participate in development across the value chain. About 47% of Norway’s landmass provides biofuels and biomass [41]. Tidal power and wave energy are also rising developments based on Norway’s offshore capabilities, with the current project involving gradient energy-based seawater.
Due to climate change, Norway is experiencing an increase in average inflow. New catchment areas or an increase in the size of the reservoirs and turbines are required to accommodate increased inflow; for instance, Nedre Rossaga station was completed in 2016 [44]. The introduction of renewable energy certificates in 2003 and the merging of the Norwegian and Swedish certificate markets resulted in the boom of smaller-scale hydropower projects in Norway. Around 350 small-scale hydropower projects have been commissioned since 2003, and the number will continue growing. Thirty-five new hydropower stations in 2016, amounting to 154 MW, included the newly commissioned 27 MW Govddesaga station. Storåvatn station (36 MW) went into operation in 2020 and Smibelg station (33 MW) - in 2022.
Norway’s first wind farm was established in 2002 [41]. A small wind farm originally installed with a capacity of 40 MW was increased by 110 MW in 2005. There were 25 wind farms in Norway in 2016, with an installed capacity of 873 MW, corresponding to 2% of the country’s total annual production [41]. By the end of 2016, almost 6 TWh plants were under construction, including the Fosen wind project involving a consortium of companies Statkraft and TronderEnergi. All the wind farms together will have a capacity of 1000 MW, the largest onshore wind power project in Europe.
The Norwegian power system benefits from an integrated, open electricity market called The Nord Pool. Norway is integrated with countries like Sweden, Denmark, Finland, Estonia, Lithuania, and Latvia. Norway is connected with many countries through high-voltage direct high-voltage transmission lines. The Norwegian transmission system operator Statnett has been granted a licence to build interconnections with Germany and the UK. Norway and UK announced plans to build the world’s longest submarine high-voltage cable to export Norwegian hydropower to the UK and later plans to export to Germany [42].
The Norwegian renewable energy action plan was submitted to the EFTA Surveillance Authority in 2012 [43]. The action plan outlines how Norway can achieve an overall share of 10% in the transport sector by 2020. The action plan is based on filling a detailed template prepared by European Commission that all states must use. It makes the plan more standardised in achieving the Norwegian target of 67.5% in 2020 through existing policy instruments and policy described by Government in the 2012 white paper on Norwegian climate policy.
Norway will be credited for half of the overall target for the joint certificate market between Norway and Sweden. The Norwegian-Swedish electricity certificate scheme is the first example of a joint support scheme between member states under the Renewable Directive. The joint support scheme is regulated in Article 11 of the Directive. Enova’s use of policy instruments and the introduction of new construction standards contribute to achieving the targets. The Ministry of the Environment and the Norwegian Environment Agency adopted EU ETS 2013-2020 by deploying economic and regulatory instruments. The Emissions Trading Scheme Directive (2009/29/EC) was incorporated into EEA Agreement in 2012. The EEA EFTA states of Iceland and Liechtenstein became part of an improved and extended GHG trading scheme [43].
In the computation of RESI, the study adopts six dimensions or variables that reflect the value of k = 6. The six dimensions to explain energy security for renewable energy are Availability, Accessibility, Affordability, Acceptability, Energy Intensity, and Structural Change. After normalising all the indicators by the min-max normalisation method, the normalised values are plotted to observe the trends and patterns of the variable for all the dimensions. The Kaiser-Meyer-Olkin (KMO) test reflects the sampling adequacy for each variable in the model. KMO is significant, 53% and Barlett’s test of sphericity is also significantly reflected by the p-value equal to 0.000. The percentage of variance explained by the first component is 48.6%. At the same time, the cumulative percentage is 86.08%, which is high, indicating that the coverage rate of the three components is 86.91%, indicating that the principal component analysis method will have significant results. The screen plot also reveals that the eigenvalues are high for the first two components, and the graph becomes straight after that.
The component plot in the rotated space highlights that the availability of conventional energy, accessibility, affordability of RE, and acceptability (sustainable) is negatively related to the first component. On the other hand, RESI’s environmental acceptability and intensity aspects are negatively correlated to the second component.
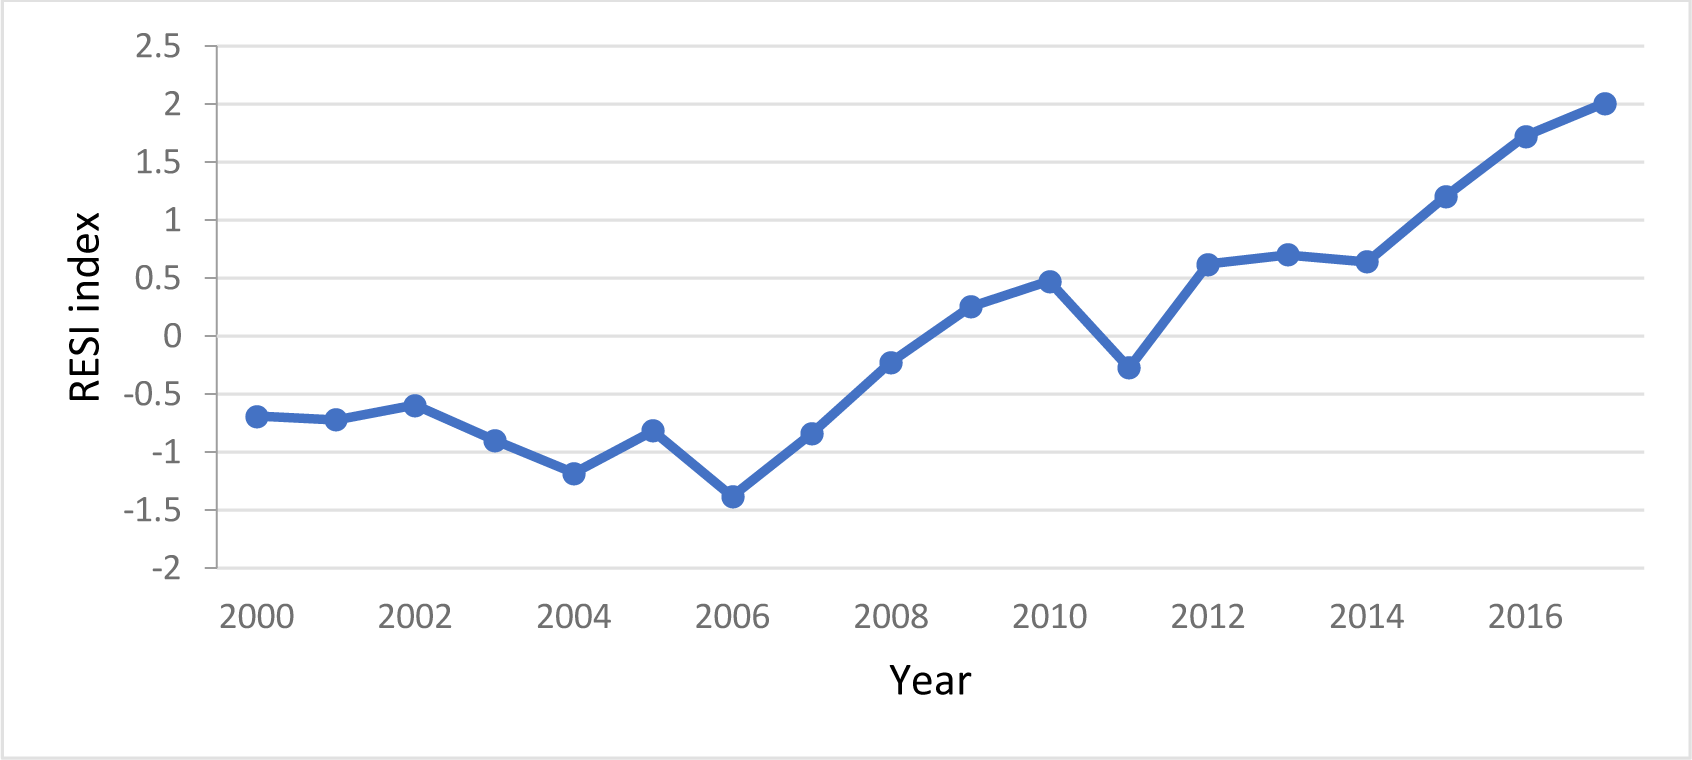
The computed RESI for Norway 2000-2017 behaved as shown in Figure 9. Initially, the status of renewable energy declined, and the RESI value was even negative, indicating insecurity. From 2006 onwards, there was a gradual improvement in the status of renewable energy security, and the values became positive till 2010. However, there was a fall in the status of the RESI, depicted by a kink in 2011. Later, the status of renewable energy further improved, as reflected in Figure 9.
Renewable Energy Security Index for Norway
There are certain significant findings from the results of correlation coefficients. The availability of renewable energy significantly increases the accessibility component or dimension of the renewable energy security index. The affordability of conventional energy sources, reflected by the electricity prices, which negatively affect the renewable energy index, indicates that the electricity prices reduce significantly with the improvement in the availability of conventional energy sources. At the same time, the electricity prices are not correlated with the availability of RE and accessibility.
The electricity prices and affordability of RE are positively significantly correlated. This result indicates that in Norway, the electricity generation is around 96% hydroelectricity, and affordability of RE consists of the levelised cost of RE, investment in RE and SPV price. When the affordability dimension of RESI improves, indicating a fall in the cost of RE, the affordability of conventional energy also improves, reflected by a fall in electricity prices. In Norway, when electricity prices become affordable, then the affordability of RE also improves [46].
An improvement in the affordability of RE is highly significantly correlated with an improvement in the availability of RE (reflected by an increase in RE in the electricity mix, an increase in RE consumption and proportion in primary energy supply and RE imports) and improves the accessibility aspect of RESI. In comparison, an improvement in the availability of conventional energy sources reduces the affordability of RE significantly. The correlation values also indicate that the EnergyIintensity significantly increases with improvement in the affordability of both conventional and renewable energy.
Energy Intensity significantly increases the availability of conventional energy as they are positively related. In contrast, Energy Intensity reduces the availability of renewable energy, indicating that conventional sources mainly fulfil an increase in energy use and do not lead to the deployment of renewable energy sources. Energy Intensity reduces the accessibility of energy and the affordability of both conventional and renewable energy.
There exists a weak relationship between the availability of conventional energy sources and the Structural Composition of the economy. The structural composition dimension of renewable energy is significantly negatively correlated with the availability of RE. It leads to a crucial conclusion that as there is an increase in the share of transport, manufacturing, and household consumption, there is a considerable fall in the availability of RE. The proportion of RE in the electricity mix, RE consumption, supply of RE in total primary energy and proportion of RE in imports suggest the need to increase the availability of RE (AV RE) in Norway since most of it is consumed on account of structural change in the economy. Further, a rise in the share of energy-intensive sectors reduces Accessibility. At the same time, improvement in the affordability of conventional energy supports the Structural Change in the economy significantly.
Owing to the structural change or increase in the share of energy-intensive sectors, the availability of renewable energy declines along with a significant decline in the ccessibility of RE. It suggests that due to Structural Change and the accessibility of RE in rural areas, RE consumption by households and consumption of SPV reduces. The Structural Change increases the demand for RE. A larger share of energy-intensive sectors will demand more RE and thus reduce RESI. However, Energy Intensity is negatively related to Structural Change, suggesting that the share of energy-intensive sectors has declined, implying a significant negative correlation with Energy Intensity.
The abbreviations for various indicators used in the following are mentioned in the heading of Nomenclature. The Acceptability dimension of RESI is captured by carbon intensity per GDP or carbon emissions per capita. It caters to the environmental aspect of RESI. An improvement in the environmental aspect of acceptability, implying a fall in carbon emissions and intensity, is associated with a fall in the availability of conventional energy sources (AV cons). At the same time, an improvement in the environmental component of acceptability is associated with a significant increase in the availability of RE and a significant improvement in the affordability of RE, suggesting a fall in RE cost. Improvement in the environmental aspect of Acceptability (Acpt env) is also associated with improvement in Energy Intensity (INT), which means that when there is a decline in Energy Intensity, a significant reduction in carbon emissions is observed in Norway.
An improvement in the sustainability component of Acceptability (Acptsus), which represents an increase in R&D funds, the number of patents, and the share of solar in the electricity mix, tend to be significantly positively correlated with the availability of RE and the accessibility of RE. With improvement in the affordability of conventional energy (AFF conv), the sustainability aspect of acceptability of RE reduces, suggesting a lesser focus on investment in RE. It also conveys a significant deduction regarding investment in RE and R&D in RE, leading to improvement in the accessibility of RE in Norway. An increase in R&D and investment in RE leads to an improvement in the affordability of RE (AFF RE), suggesting a decrease in the cost of RE in Norway. It also significantly reduces the demand created by the structural change by reducing the Energy Intensity.
Table 1 and Table 2 depict that accessibility of RE (ACC) is significantly positively correlated with RESI, suggesting that as the accessibility of RE improves, the security index of RE in Norway also improves. Similarly, the availability of RE (AV RE) is also highly correlated with RESI, indicating that the greater the availability of RE, the better the security status due to renewable energy.
The more affordable the renewable energy, the greater the security of renewable energy is in Norway. The Structural Composition (STR) is significantly negatively correlated with RESI. If the Structural Composition of energy-intensive sectors increases, this would eventually harm the security of renewable energy by increasing the demand for renewables. Similarly, an increase in Energy Intensity that suggests a fall in energy efficiency reduces renewable energy security by increasing the demand for renewable energy sources. It suggests that an improvement in energy efficiency will contribute to renewable energy security in the case of Norway [45].
Correlation between six dimensions and RESI, Norway
| AV cons | AV RE | ACC | AF conv | AF RE | INT | STR | Acpt env | Acpt sus | |
|---|---|---|---|---|---|---|---|---|---|
| AV cons | 1.00 | ||||||||
| AV RE | -.390 | 1.00 | |||||||
| ACC | -.177 | .817 | 1.00 | ||||||
| AFF conv | -.677 | .184 | -.143 | 1.00 | |||||
| AFF RE | -.605 | .691 | .455 | .498 | 1.00 | ||||
| INT | .494 | -.550 | -.353 | -.323 | -.580 | 1.00 | |||
| STR | -.211 | -.404 | -.380 | .549 | -.168 | .105 | 1.00 | ||
| Acpt env | -.307 | .482 | .113 | .271 | .578 | -.826 | -.277 | 1.00 | |
| Acpt sus | .154 | .598 | .743 | -.473 | .346 | -.263 | -.834 | .252 | 1.00 |
Correlation between six dimensions and RESI, Norway
| RESI | |
|---|---|
| AV cons | −0.11478 |
| AV RE | 0.79524 |
| ACC | 0.93352 |
| AFFconv | −0.29015 |
| AFF RE | 0.48872 |
| INT | −0.36868 |
| STR | −0.64728 |
| Acptenv | 0.21402 |
| Acptsus | 0.91105 |
| RESI | 1.00000 |
Finally, the sustainability aspect of acceptability, which comprises R&D in RE, investment in RE, and the share of solar energy in the total electricity mix, is significantly positively correlated with RESI in the case of Norway. Environmental factors such as carbon emission and carbon intensity play an insignificant role in RESI in the case of Norway.
The Availability of conventional energy is higher than that of renewable energy from the beginning of 2000 till 2013; later, the Availability of renewable energy sources increases more than that of conventional energy. The availability index of conventional energy has declined from 2001 onwards, while the Availability of renewable energy increased more than the conventional energy index. The share of renewable production in the electricity mix shows a consistent rise from 2000-2017. The share of renewable energy consumption in total final energy consumption and RE proportion in total primary energy supply fluctuated drastically, especially around the financial crises of 2008-9, and later experienced an increase after 2010. However, there is a consistent rise in the share of renewable production in the electricity mix and renewable energy imports in Norway from 2000-2017. Renewable energy imports primarily comprise geothermal, solar, biofuel, and waste. Due to the rising trend in RE production in electricity mix and RE imports, the Availability of RE exceeds conventional energy in Norway. One of the studies also pointed out that biodiesel production can drive economic development, improving energy security and promoting social inclusion [47].
The Affordability component of RESI consists of economic factors and an energy system. Economic factors comprise of costs and prices of both conventional and renewable energy sources, while the energy system reflects the energy requirement of the country based on its energy regime. While examining energy security, the Affordability of both conventional and renewable energy sources plays a critical role. It is observed that the cost of SPV modules has been declining at a very great speed. At the same time, the electricity prices considered as a measure of the Affordability of conventional energy sources are consistently rising. The levelised cost of electricity of RE is consistently rising, and after the financial crisis of 2008, there has been a steeper rise in that factor. Later after 2010, the levelised costs consistently declined. The electricity price and its levelised cost behaved similarly from 2000 to 2011, and they both kept declining. In Norway, SPV prices increased and then declined consistently from 2004 onwards, while investment in renewable energy remained constant till 2010 and then fluctuated drastically. Further, the economic viability of microgrids with batteries was confirmed in seven countries of the European Union [46]. The water-electricity cogeneration using an integrated system of concentrated solar power and biofuel as renewable energy sources resulted in a levelised water cost lower than the water tariff [48]. The development of transmission networks affects electricity prices and electricity trade in Baltic countries [49].
The trends in Structural Composition reveal that the share in manufacturing, transport and household expenditure in total final consumption expenditure declines. At the same time, the Energy Intensity of the overall economy fluctuates drastically but continues to rise. It suggests that despite the structural change in energy-intensive sectors, the overall economy’s energy requirement or consumption continued to increase.
In Norway, the Accessibility dimension of RESI, comprising RE consumption by households, transmission and distribution losses, and SPV consumption, improves over 2000-2017. It is observed that renewable energy consumption by households began to rise in 2006, peaked in 2010 and then started declining, while transmission and distribution losses have been fluctuating but became stable from 2013 onwards. The consumption of SPV has been consistently rising, contributing to renewable energy security. Another study confirms that the development of transmission networks affects electricity prices and especially electricity trade in Baltic countries [49]. The photovoltaic system will provide reliable and clean electricity for several tasks, such as electric bikes, water purification, etc. [50].
As more renewable energy consumption increases in the economy, the environmental Acceptability dimension reduces, indicating that using renewable energy reduces carbon emissions. In contrast, the sustainability aspect of Acceptability, incorporating an increase in R&D funds, an increase in the number of patents, and a share of solar energy in the electricity mix, exhibits a substantial fluctuation. The sustainability aspect of Acceptability consists of the share of renewables, Research and Development, and innovation indicated by the number of patents depicts a consistent rise. The environmental component comprising carbon intensity and carbon dioxide emissions have fluctuated from 2000-2017, with carbon intensity depicting a consistent increase after 2014. The role of bioenergy in environmental sustainability in reducing carbon emissions was substantially highlighted by [51].
Energy Intensity and Structural Change (the latter represented by Structural Composition) in the energy-intensive sectors determine the overall energy requirement of the country. As evident in Figure 10, the Energy Intensity has fluctuated immensely, depicting a steep fall in 2007 and a steep rise in 2010. It depicts that energy use has been increasing due to rising Energy Intensity. However, the share of the energy-intensive sector in gross value added has declined from 2011 onwards.
Pattern of indicators of Energy Intensity & Structural Composition, Norway
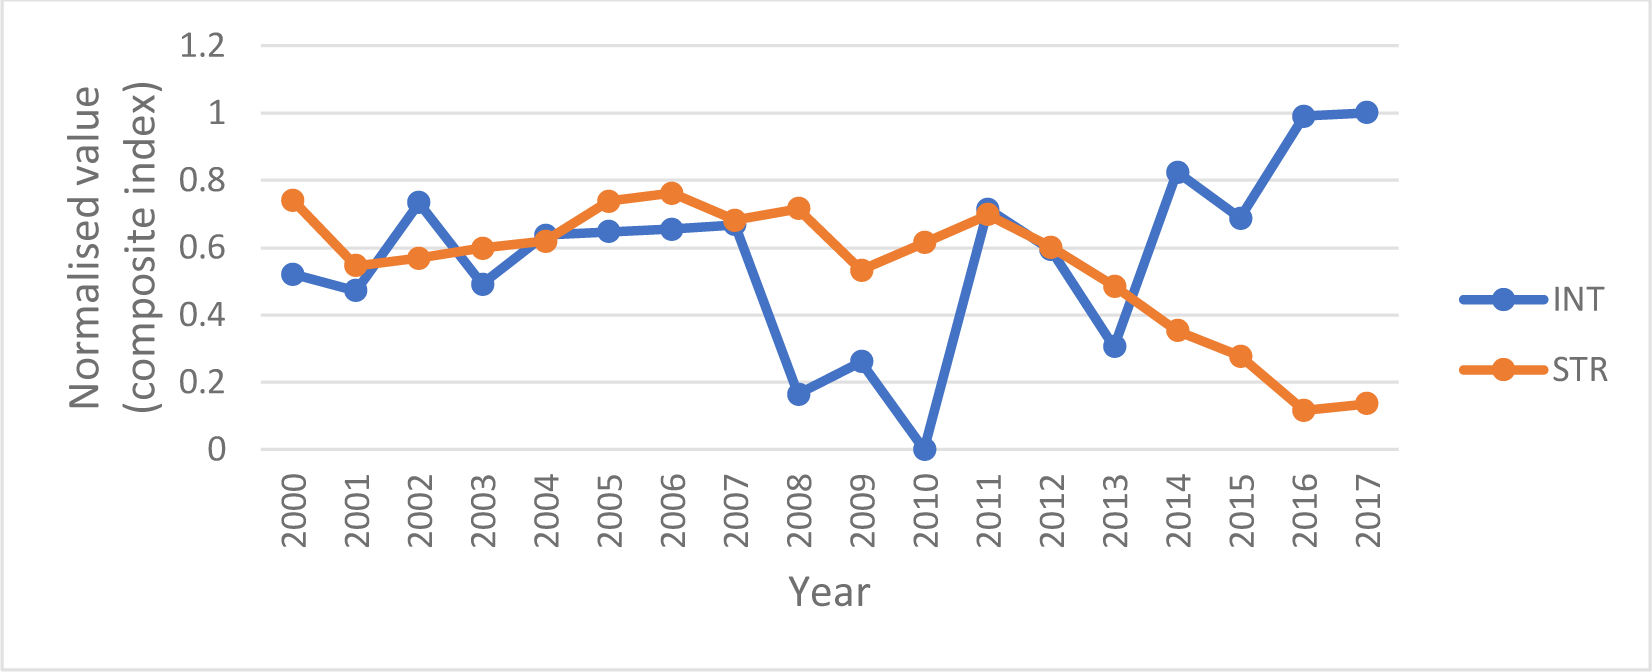
Energy consumption per household sharply fell around 2006, while energy and electricity consumption rose during the global economic recession in 2008, as evidenced by [45]. The role of architectural design in enhancing energy efficiency was highlighted by the findings of the study [52]
Norway has ratified and committed to nationally determined contributions under Paris Agreement 2020. The role of renewable energy is significant in not only ensuring energy transition but also determining energy security. The paper examines the role of renewable energy (RE) deployment in ensuring energy security in Norway by constructing a Renewable Energy Security Index (RESI). The RESI has been computed using Principal Component Analysis (PCA method) for the 2000-2017 period. After examining various aspects of energy security, the correlation between energy efficiency and the deployment of renewable energy has been studied in the paper. Energy efficiency and the deployment of renewable energy are two distinct pathways of the energy transition. It is crucial to examine the relationship between them, whether there is a trade-off or a positive correlation between the two plausible energy transition pathways.
The status of renewable energy declined after 2000 and was even negative, indicating insecurity. From 2006 onwards, there was a gradual improvement in the status of renewable energy security, and the values became positive till 2010. However, there was a fall in the renewable energy security index status in 2011. Later, the status of renewable energy was further improved. Accessibility and availability of RE are significantly positively correlated with RESI, suggesting that as the accessibility and availability of RE improves, the energy security of renewable energy sources in Norway also improves. The more affordable the renewable energy is, the greater the security of renewable energy in Norway.
The Structural Composition is significantly negatively correlated with RESI. If the Structural Composition of energy-intensive sectors increases, this would eventually harm the security of renewable energy by increasing the demand for renewables. Similarly, an increase in Energy Intensity that suggests a fall in energy efficiency reduces renewable energy security by increasing the demand for renewable energy sources. Finally, R&D in RE, investment in RE, and the share of solar energy in the total electricity mix are significantly positively correlated with RESI in the case of Norway. The Structural Change and Energy Intensity contribute to analysing the relationship between RE and energy efficiency in the energy transition context.
In addition to abundant natural energy sources, Norway has substantial potential for R&D in renewable energy in the field of more advanced digitalised, hybrid, and integrated systems. More advancement and R&D in RE technology will contribute to energy security and enhance wealth creation. Environmental factors such as carbon emission and carbon intensity play an insignificant role in RESI in the case of Norway. In other words, environmental concerns do not contribute significantly to Norway’s energy transition to renewables. The RESI framework adopted by the study can be extended to incorporate and evaluate other significant energy transition and security aspects, such as policy instruments. Moreover, the framework can be adapted to analyse the energy security in the European Union by presenting a comparative study of EU countries.
| I | identity matrix |
| R | correlation matrix |
| RESI | Renewable Energy Security Index |
| X | indicators for RESI |
| ⋋ | eigenvalue |
| α | partial slope coefficient |
| µ | error term |
| k | indicator number |
| ACC | Accessibility |
| Acptenv | Acceptability (environment component) |
| Acptsus | Acceptability (sustainability component) |
| AFF conv | Affordability of conventional energy |
| AFF RE | Affordability of Renewable Energy |
| APERC | Asia Pacific Energy Research Centre |
| ASEAN | Association of Southeast Asian Nations |
| AV cons | Availability of conventional energy |
| AV RE | Availability of RenewableEnergy |
| BP | British Petroleum |
| CCS | Carbon capture and storage |
| DC | Direct Current |
| EEA | European Economic Area |
| EFTA | European Free Trade Association |
| ETS | Emissions Trading System |
| EU | European Union |
| Four A | Availability, Accessibility, Affordability, and Acceptability |
| GDP | Gross Domestic Product |
| GHG | Greenhouse Gases |
| IEA | International Energy Agency |
| INT | Energy Intensity |
| IRENA | International Renewable Energy Agency |
| PCA | Principal Component Analysis |
| RE | Renewable Energy |
| R&D | Research and Development |
| SPV | Solar Photovoltaics |
| STR | Structural Composition |
| UK | United Kingdom |
- Norway’s Fourth Biennial Report, https://unfccc.int/sites/default/files/resource/Norway_BR4%20%282%29.pdf
- Production and Exports, https://www.norskpetroleum.no/en/production-and-exports
- ,
The renewable energy potential of Norway and strategies for its development ,J. Renew. Energy , Vol. 6 (3),pp 207–214 , 1995, https://doi.org/https://doi.org/10.1016/0960-1481(95)00014-B - ,
The impact of future energy demand on renewable energy production - Case of Norway ,Energy , Vol. 61 ,pp 419–431 , 2013, https://doi.org/https://doi.org/10.1016/j.energy.2013.08.044 - ,
Energy security and renewable energy efficiency in EU ,Renewable and Sustainable Energy Reviews , Vol. 96 ,pp 226–239 , 2018, https://doi.org/https://doi.org/10.1016/j.rser.2018.07.046 - ,
European energy security: The future of Norwegian natural gas production ,Energy Policy , Vol. 37 (12),pp 5037–5055 , 2009, https://doi.org/https://doi.org/10.1016/j.enpol.2009.06.075 - ,
Climate change and vulnerabilities of the European energy balance ,Journal of Sustainable Development of Energy, Water and Environment Systems , Vol. 3 (1),pp 106–117 , 2015, https://doi.org/https://doi.org/10.13044/j.sdewes.2015.03.0008 - The Oil and Gas Industry in Energy Transitions, https://www.iea.org/reports/the-oil-and-gas-industry-in-energy-transitions
- , Introduction: Defining, measuring, and exploring energy security, 2010
- Quest for energy security in the 21st Century: resources and constraintsTokyo, Japan, 2007, https://aperc.or.jp/file/2010/9/26/APERC_2007_A_Quest_for_Energy_Security.pdf
- ,
Sustainable Development Goal Indicators as the Foundation for a Holistic Impact Assessment of Access-to-Energy Projects ,Journal of Sustainable Development of Energy, Water and Environment Systems , Vol. 10 (2), 2022, https://doi.org/https://doi.org/10.13044/j.sdewes.d9.0400 - Energy Trilemma Index, https://www.worldenergy.org/assets/downloads/WE_Trilemma_Index_2021.pdf
- ,
Energy prices and energy security in the European Union: Panel data analysis ,Energy Sources, Part B: Economics, Planning and Policy , Vol. 12 (5),pp 415–419 , 2017, https://doi.org/https://doi.org/10.1080/15567249.2016.1157649 - ,
Evaluating Energy Security of Resource-Poor Economies: A Modified Principle Component Analysis Approach ,Energy Economics , Vol. 58 ,pp 211–221 , , https://doi.org/https://doi.org/10.1016/j.eneco.2016.07.001 - ,
A framework for evaluating global national energy security ,Appl Energy , Vol. 188 ,pp 19–31 , 2017, https://doi.org/https://doi.org/10.1016/j.apenergy.2016.11.116 - ,
Low carbon transition through renewables sources – An overview of the renewable energy program in the state of Minas Gerais ,Journal of Sustainable Development of Energy, Water and Environment Systems , Vol. 8 (2),pp 252–267 , 2020, https://doi.org/https://doi.org/10.13044/j.sdewes.d7.0295 - ,
The renewable energy-growth nexus with carbon emissions and technological innovation: Evidence from the Nordic countries ,Ecol Indic , Vol. 69 ,pp 118–125 , 2016, https://doi.org/https://doi.org/10.1016/j.ecolind.2016.03.051 - ,
Towards a low carbon energy future - Renewable energy cooperation between Germany and Norway ,Renew Energy , Vol. 68 ,pp 216–222 , 2014, https://doi.org/https://doi.org/10.1016/j.renene.2014.02.001 - ,
Electricity Market Impacts of Low-carbon Energy Transition in the Nordic-Baltic Region ,Journal of Sustainable Development of Energy, Water and Environment Systems , Vol. 10 (3), 2022, https://doi.org/https://doi.org/10.13044/j.sdewes.d9.0407 - ,
Renewable energy: A response to climate change ,Solar Energy , Vol. 76 (1–3),pp 9–17 , 2004, https://doi.org/https://doi.org/10.1016/S0038-092X(03)00101-4 - , The role of Photovoltaics towards 100% Renewable energy systems: Based on international market developments and Danish analysis. Department of Development and Planning, 2017
- ,
The Role of Trade and Energy in Generating Carbon Emissions and Environmental Degradation ,Journal of Sustainable Development of Energy, Water and Environment Systems , Vol. 10 (3), 2022, https://doi.org/https://doi.org/10.13044/j.sdewes.d9.0397 - ,
Socio-economic Impact of a Solar Water Pumping System in a Rural Community in Indonesia ,Journal of Sustainable Development of Energy, Water and Environment Systems , Vol. 10 (3), 2022, https://doi.org/https://doi.org/10.13044/j.sdewes.d9.0403 - ,
Solar Model for Rural Communities: Analysis of Impact of a Grid-Connected Photovoltaic System in the Brazilian Semi-arid Region ,Journal of Sustainable Development of Energy, Water and Environment Systems , Vol. 10 (3), 2022, https://doi.org/https://doi.org/10.13044/j.sdewes.d9.0405 - ,
Impact of fluctuating energy prices on the operation strategy of a trigeneration system ,Journal of Sustainable Development of Energy, Water and Environment Systems , Vol. 3 (3),pp 315–332 , 2015, https://doi.org/https://doi.org/10.13044/j.sdewes.2015.03.0024 - ,
Role of Renewables and Legal Framework in Conceptualizing Energy Cooperation in ASEAN Region ,ASEAN Ideas in Progress ,pp 1 –26 , 2021 - ,
Evaluating energy security performance from 1990 to 2010 for eighteen countries ,Energy , Vol. 36 (10),pp 5846–5853 , 2011, https://doi.org/https://doi.org/10.1016/j.energy.2011.08.040 - ,
Evaluating energy security in the Asia-Pacific region: A novel methodological approach ,Energy Policy , Vol. 38 (9),pp 5258–5263 , 2010, https://doi.org/https://doi.org/10.1016/j.enpol.2010.05.028 - ,
The four ’R’s of energy security ,Energy Policy , Vol. 37 (6),pp 2459–2461 , 2009, https://doi.org/https://doi.org/10.1016/j.enpol.2009.02.038 - ,
Conceptualising and measuring energy security: A synthesised approach ,Energy , Vol. 36 (8),pp 5343–5355 , 2011, https://doi.org/https://doi.org/10.1016/j.energy.2011.06.043 - ,
Energy security and co-benefits of energy efficiency improvement in three Asian countries ,Renewable and Sustainable Energy Reviews , Vol. 20 ,pp 491–503 , 2013, https://doi.org/https://doi.org/10.1016/j.rser.2012.12.004 - ,
LIII. On lines and planes of closest fit to systems of points in space ,The London, Edinburgh, and Dublin Philosophical Magazine and Journal of Science , Vol. 2 (11),pp 559–572 , 1901, https://doi.org/https://doi.org/10.1080/14786440109462720 - Conceptualising the Role of Renewables in Determining Energy Security, 2021, https://www.igi-global.com/gateway/chapter/281193#pnlRecommendationForm
- ,
Analysis of a complex of statistical variables into principal components ,Journal of Educational Psychology , (24),pp 498–520 , 1933 - ,
A Tutorial on Principal Component Analysis Derivation, Discussion and Singular Value Decomposition , 2003, https://doi.org/https://doi.org/10.48550/arXiv.1404.1100 - , Handbook on constructing composite indicators : methodology and user guide. OECD, 2008
- ,
Changing Energy Paradigm and its role in Economic Growth in Global South , 2019, https://doi.org/https://doi.org/10.2139/ssrn.3318917 - , https://www.regjeringen.no/en
- Norway’s long term low-efficiency strategy for 2050, https://unfccc.int/sites/default/files/resource/LTS1_Norway_Oct2020.pdf
- Statistical Review of World Energy, https://www.bp.com/content/dam/bp/business-sites/en/global/corporate/pdfs/energy-economics/statistical-review/bp-stats-review-2018-full-report.pdf
- Ministry of Petroleum and Energy, https://www.regjeringen.no/en/dep/oed/id750
- Energi, http://www.regjeringen.no/en/topics/Energy.html?id=212
- Norway – Green Technologies & Renewable Energy, https://www.export.gov/article?id=Norway-Green-Technologies-Renewable-Energy
- Hydropower and the pathway to net zero, https://www.hydropower.org
- , https://energifaktanorge.no/en/norsk-energiforsyning/kraftproduksjon
- , https://www.odyssee-mure.eu/publications/efficiency-trends-policies-profiles/norway.html
- ,
A pathway to energy and food security with Biodiesel ,Journal of Sustainable Development of Energy, Water and Environment Systems , Vol. 4 (3),pp 242–261 , 2016, https://doi.org/https://doi.org/10.13044/j.sdewes.2016.04.0020 - ,
Feasibility study for water-electricity cogeneration using integrated system of concentrated solar power and biofuel as renewable energy sources ,Journal of Sustainable Development of Energy, Water and Environment Systems , Vol. 9 (3), 2021, https://doi.org/https://doi.org/10.13044/j.sdewes.d8.0372 - ,
Electricity Market Impacts of Low-carbon Energy Transition in the Nordic-Baltic Region ,Journal of Sustainable Development of Energy, Water and Environment Systems , Vol. 10 (3), 2022, https://doi.org/https://doi.org/10.13044/j.sdewes.d9.0407 - ,
Investigating the Performance of Rural Off-Grid Photovoltaic System with Electric-Mobility Solutions: A Case Study Based on Kenya ,Journal of Sustainable Development of Energy, Water and Environment Systems , Vol. 10 (1), 2022, https://doi.org/https://doi.org/10.13044/j.sdewes.d9.0391 - ,
The role of bioenergy in Ireland’s low carbon future – is it sustainable? ,Journal of Sustainable Development of Energy, Water and Environment Systems , Vol. 3 (2),pp 196–216 , 2015, https://doi.org/https://doi.org/10.13044/j.sdewes.2015.03.0016 - ,
Methods for assessing energy efficiency of buildings ,Journal of Sustainable Development of Energy, Water and Environment Systems , Vol. 7 (3),pp 432–443 , 2019, https://doi.org/https://doi.org/10.13044/j.sdewes.d6.0243