


The global energy demand is growing substantially. Clean and secure energy supply is a requirement for civilization's sustainable development. Solar and wind energy is growing fast and can contribute significantly to meet the goals set by many countries to reduce greenhouse gas emissions [1]. The potential benefits of solar photovoltaic (PV) systems range from widely emission-free electricity generation during the operational phase, allowing electricity prosumers to cover at least part of their demand [2]. The global PV capacity increased to around 760 GW in 2020, with a year-on-year increase of about 139 GW from 2019 [3]. Considering only Europe, the Polish market is Europe's second-fastest-growing PV market, right behind Germany. Year after year, the capacity of PV installations significantly increases, causing significant changes in the energy mix and reducing the share of fossil fuels in electricity production [4]. In February 2022 the installed capacity in photovoltaics reached 8.77 GW [5]. Typically, PV panels can be mounted on buildings' roofs or structurally embedded into buildings by replacing the traditional building envelope [6], [7]. The cost of building integrated photovoltaics (BIPV) is higher compared to conventional units. For example, the cost of BIPV façade products varies from 100 to 150 €/m2 for a thin film BIPV façade (with a simple sub-structures and a low-efficiency PV technology) to 500–700 €/m2 for a high-efficiency BIPV crystalline module. On the other hand, costs of conventional façades and roof materials can be estimated as 80-900 €/m2 depending on the materials used [8]. Such small-scale systems account for 80% of total PV power installed in Poland. In addition to building applications, PV panels are increasingly used, e.g., in the electromobility sector, to supply cars, aircraft, and boats [9], [10]. On the other hand, the share of fossil fuels in electricity generation in Poland is really high. In 2021 the share of coal was over 72%, while the share of renewables was about 17% [5].
With the increase in interest in PV installations and the increase in public awareness of the limitations of PV panels (including power decrease with temperature and power decrease with panel surface contamination), questions arise as to whether it is possible to reduce the impact of external factors on the PV installations operation.
The temperature significantly affects the energy yields from the PV systems. The characteristic value for each panel is the temperature coefficient, which determines how quickly the voltage decreases (%/°C) or how quickly the current increases (%/°C) with the increase in the panels’ surface temperature [11]. Variations in the current and voltage over the temperature affect the decrease in power generated by the panel (%/°C). It is possible to provide a higher performance of PV panels using passive or active cooling systems. Each of the available cooling systems has advantages and disadvantages. Passive cooling systems are characterized by low coefficients of investment costs, efficiency, cooling, and energy consumption. In the case of active cooling systems, higher efficiency and higher temperature decrease of PV panels can be achieved with higher energy consumption [12].
Sornek et al. [13] tested the possibilities of water and air cooling the 50 Wp PV panel under laboratory conditions. As was observed, power generated in the water-cooled PV panel was higher by 9% compared to the uncooled panel, while power generated in the air-cooled panel was higher by 6% compared to the uncooled panel. Ramkiran et al. [14] tested various passive cooling methods (plant cooling, greenhouse cooling, greenhouse + plant cooling, coir pith, and PCM cooling) for a 50 Wp polycrystalline PV panel. The most significant increase in power was obtained for coir pith cooling (11.34%). On the other hand, the most significant decrease in the temperature of the PV panel was observed for plant cooling with a greenhouse – the temperature drop was equal to 14 K. Also, Elbreki et al. [15] investigated the possibility of using passive systems to reduce the PV panels' temperature. Experimental tests for passive fin heat sinks showed a decrease in panel temperature by 24.6 K compared to the reference panel. The decrease in PV panel temperature caused the increase of power by 100%. Seok Min Choi et al. [16] investigated active methods of PV panels cooling configured in the form of acoustic excitation. As was shown it was possible to obtain satisfactory temperature drops of PV panels for ambient temperature below 50 °C by using the appropriate acoustic-excitation frequency in a single-dimpled internal channel. Hussien et al. [17] investigated the possibility of using air as a cooling medium for PV panels. It was possible to increase the efficiency over reference panels by 2.1% for small backside fans and 1.34% for the blower cooling technique. In addition, it was possible to achieve 7.0% and 3.9% energy savings for distributed fans and blowers, respectively. Kabeel et al. [18] tested different PV cooling techniques based on air cooling, water cooling, and combined air and water cooling systems. Under Egyptian climate conditions, the most effective technique was water cooling, characterized by a 7%, 18%, and 29% higher efficiency compared to combined air and water system, air system, and conventional PV panel, respectively. Zhang et al. [19] tested the effects of different parameters for back-mounted spray cooling systems: nozzle height, the lengths of the guide plate and the support plate, nozzle installation angle, spray water pressure, and ambient conditions. It was possible to achieve the PV panel temperature decrease from 68.8 °C to 51.9 °C for the non-spray and the spray case, respectively. At the same time, the efficiency of the PV panel increased from 16.06% to 17.58%. Furthermore, Elnozahy et al. [20] used a water spraying system to achieve temperature of 24 °C in front of the PV panel compared to 44 °C in a reference non-cooled module. The power and efficiency were 30% higher than the PV panel without any cooling system.
The temperature of PV panels can also be reduced by using specially constructed systems connecting the PV panel with the solar collector. Such systems are called photovoltaic-thermal collectors (PV/T). In this case, it is possible to produce heat and electricity simultaneously [21]. Yildirim et al. [22] investigated the possibility of decreasing the temperature of the PV panel depending on the mass flow. For 0.014 kg/s and collector inlet temperature of 15 °C, it was possible to reduce the temperature of PV cells by 24.11 °C. On the other hand, Ma et al. [23] considered four configurations of the bifacial PV/T module with different cooling methods: cooling performed at either the upper or the lower surface, in parallel (applied to both upper and lower surfaces having similar start/endpoints), and swinging air back and forth (by guiding the air over the upper and lower surfaces, respectively). Based on average seasonal results, it was concluded that the configuration with back-and-forth cooling performed better than other configurations in terms of thermal energy/exergy output, while the configuration with lower-side cooling was preferred for electrical power output. Alobaid et al. [24] developed a mathematical model of a PV/T system to calculate the anticipated system performance. The factors that affect the efficiency of PV/T collectors were discussed and the outlet fluid temperature from the PV/T collectors was investigated. An average thermal and electrical efficiency of 65% and 13.7% was achieved, respectively.
Apart from cooling systems, other ways to increase the performance of PV panels are possible. Papis-Frączek and Sornek [25] investigated that combined systems of solar concentrator and PV/T can reach the overall efficiency of 80%. Moreover, Papis-Frączek et al. [26] presented that using parabolic dish concentrators it is possible to increase the irradiance on active surface in focal point by 250 times compared to non-concentrated systems. Sornek et al. [27] tested the parabolic concentrators for increase the power of solar cells. The power of PV cells increased by 29% in concentrated system compared to direct sunlight. It is also possible to use concentrators in for of Fresnel lenses. Sornek et al. [28] investigated that using Fresnel lenses the overall efficiency of PV cells increased by 7%. Moreover, Jannen et al. [29] presented the possibilities of using nanofluid optical filters for concentrated systems. In this case the efficiency of PV cells increased by about 100% compared to cells without nanofluid optical filters. Ge et al. [30] in order to increase the system efficiency of electricity generation, they developed the possibility of connecting wind turbines and PV panels in one hybrid system located on the rooftop of the building. A very interesting solution is also the implementation of concentrated photovoltaic systems combined with thermoelectric generators (CPV/TEG). Sabry et al. [31] investigated that CPV/TEG systems can increase the efficiency by up to 7.4% compared to classical CPV systems.
This paper presents a prototype of a cooling system dedicated to PV panels. This prototype was developed at AGH UST in Krakow and tested under laboratory and real conditions. The conditions under which the PV panels were tested are described below in dedicated subsections. Several novelties characterize the proposed system in comparison to the existing solutions:
market-available photovoltaic thermal (PV/T) collectors connect PV panels and thermal collectors functionalities. In these devices, solar cells are cooled down by a water-glycol mixture. In the proposed solution, the water is sprinkled on the front side of the PV panel and cuts off the heat of solar radiation, ensuring more efficient operation of the PV panel;
the heat absorbed by cooling water can be transferred to the domestic fresh water via the dedicated heat exchanger;
the proposed system can operate using rainwater, so it is not required to use freshwater to cool PV panels.
The possibility of improving solar panel efficiency using a direct water cooling (DWC) system has been experimentally tested using two dedicated experimental rigs. The first was located inside the laboratory and marked as “ER-1”. The second experimental rig was located outside the building and marked as “ER-2” (the rig was located in Krakow, Poland).
Experimental rig ER-1 was used to investigate the impact of temperature on the operational parameters of the tested PV panels and the possibility of increasing the panel’s performance using a dedicated water cooling system. The developed system was equipped with the following elements:
PV panel – the unit 4SUN 70W Maxx consisted of 18 monocrystalline solar cells with parameters given in Table 1.
The main parameters of the tested 70 Wp PV panel
Parameter PV panel 4SUN 70W Maxx Solar cell type monocrystalline Open circuit voltage UOC, V 21.60 Short circuit current ISC, A 4.19 Matched voltage UMPP, V 18.00 Matched current IMPP, A 3.88 Matched power PMPP, W 70.00 Dimensions, m 0.51 × 0.81 × 0.03 light source (LS) – a set of 39 bulbs with a total electric power of 5 850 W;
electronic load (EL) – the unit Array 3721A with measuring range from 0 to 400 W for power (accuracy 0.1%+600 mW), 0-40 A for the current (accuracy 0.05%+8 mA), and 0-80 V for the voltage (accuracy 0.1%+8 mV);
pyranometer (PYR) – the unit PYR20 with the measuring range from 0 to 2000 W/m2, resolution of 1 W/m2, and accuracy of 5%,
programable logic controller (PLC) – the unit WAGO PFC200 with a set of input and output modules, including the analog, digital, and communication modules;
an infrared camera (IR) – the unit NEC ThermoTracer H2640 with uncooled focal plane array (microbolometer), measuring range from -40 to 120 °C, and accuracy ±2 °C or ±2% of reading;
temperature sensors (tin, tout) – Pt100 resistance sensors with a measuring range from – 50 °C to 400 °C and tolerance ±0.3+0.005×[t];
water flowmeter (mwat) – the unit with impulse transmitter (1 impulse per 1 liter);
All controlled and measured parameters were available via CoDeSys 2.9 software using a specially developed visualization panel. The DWC system includes mainly:
the header (HE) – the water pipeline located above the PV panel used to spray non-pressurized water on the front surface of the PV panel;
water collector (WC) – a collector that collects water sprayed on the surface of the PV panel after floating down,
filter (F) – used to separate the impurities from water;
water tank (WT) – a tank used for collecting water;
water pump (WP) – used to pump water from the water tank to the header.
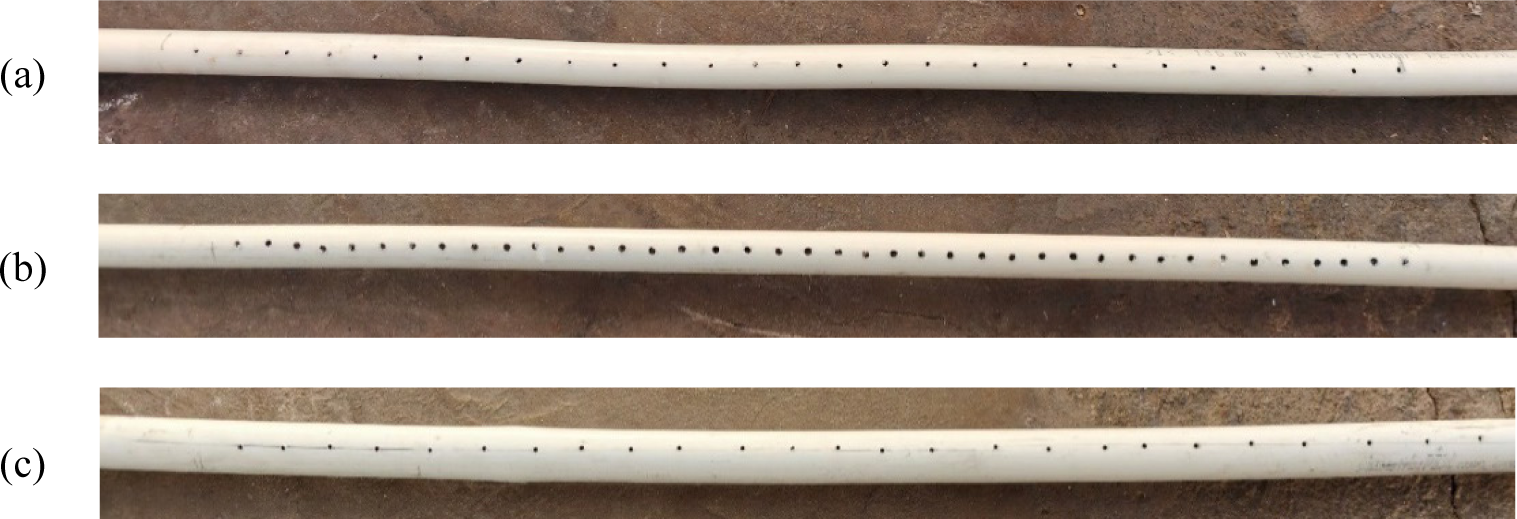
During the experiments, the distance between the light source and the PV panel (d1) was set to provide the temperature of the PV panel surface equal to approx. 55 °C. This value can be considered as the average operating temperature of the PV panels in real conditions in Poland (however, during summer, temperatures can reach or even exceed 60 or 70 °C in e.g. Southern Europe) [32]. Consequently, the average light intensity measured on the PV panel surface was about 550 W/m2. The climatic conditions in the laboratory were: 22 °C and 35% RH. To assess the impact of the water cooling system on the performance of the tested PV panel, I-V, and P-V characteristics were determined when the PV panel operated without a cooling system and when operated with an installed water cooling system. Furthermore, the cooling system's efficiency as a function of water flow and the dimensions of water inlets in the header (HE) were tested. Three configurations of the header have been considered (see Figure 1):
header in the form of a pipe with a diameter of 16 mm, which was equipped with water inlets located each 20 mm and characterized by a diameter of 1.5 mm (see Figure 1a);
header in the form of a pipe with a diameter of 16 mm, which was equipped with water inlets located each 10 mm and characterized by a diameter of 2.5 mm (see Figure 1b);
header in the form of a pipe with a diameter of 20 mm, which was equipped with water inlets located each 20 mm and characterized by a diameter of 1.5 mm (see Figure 1c).
Three water flows have been tested for the configurations mentioned above: 1.5 L/min, 2.0 L/min, and 2.5 L/min.
The analyzed configurations of the header
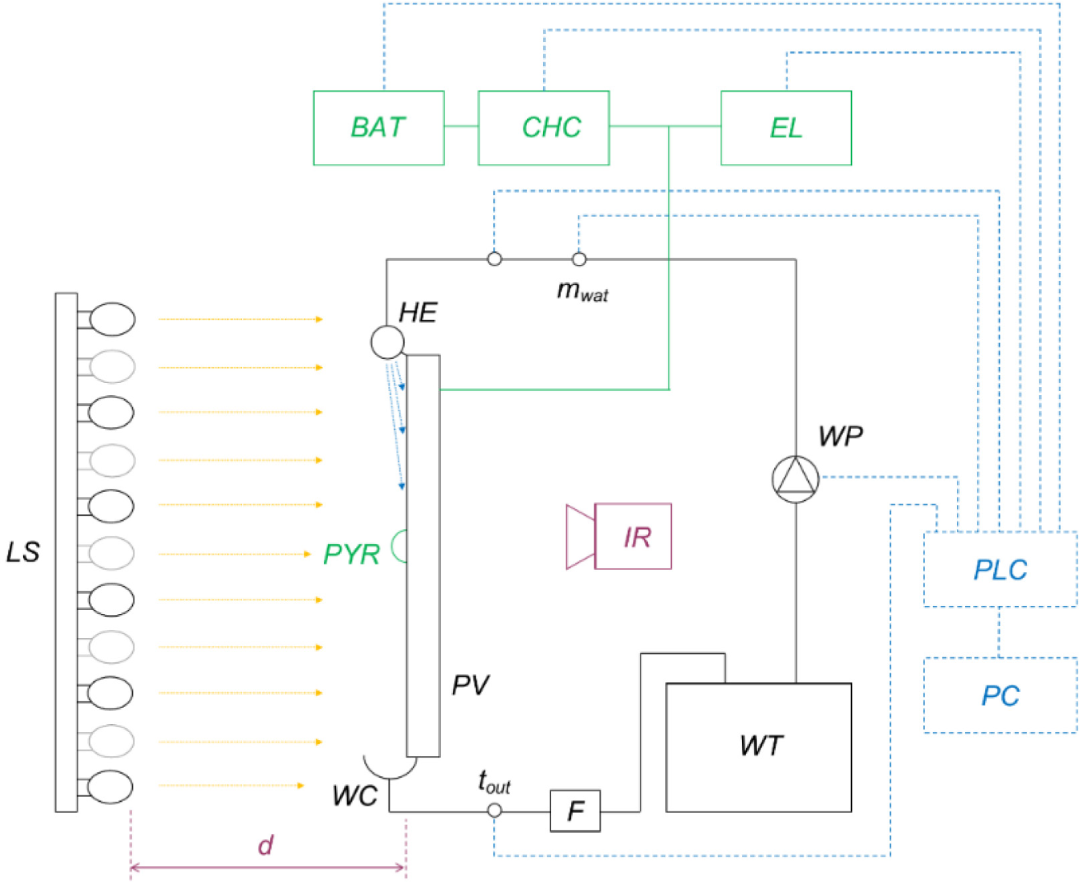
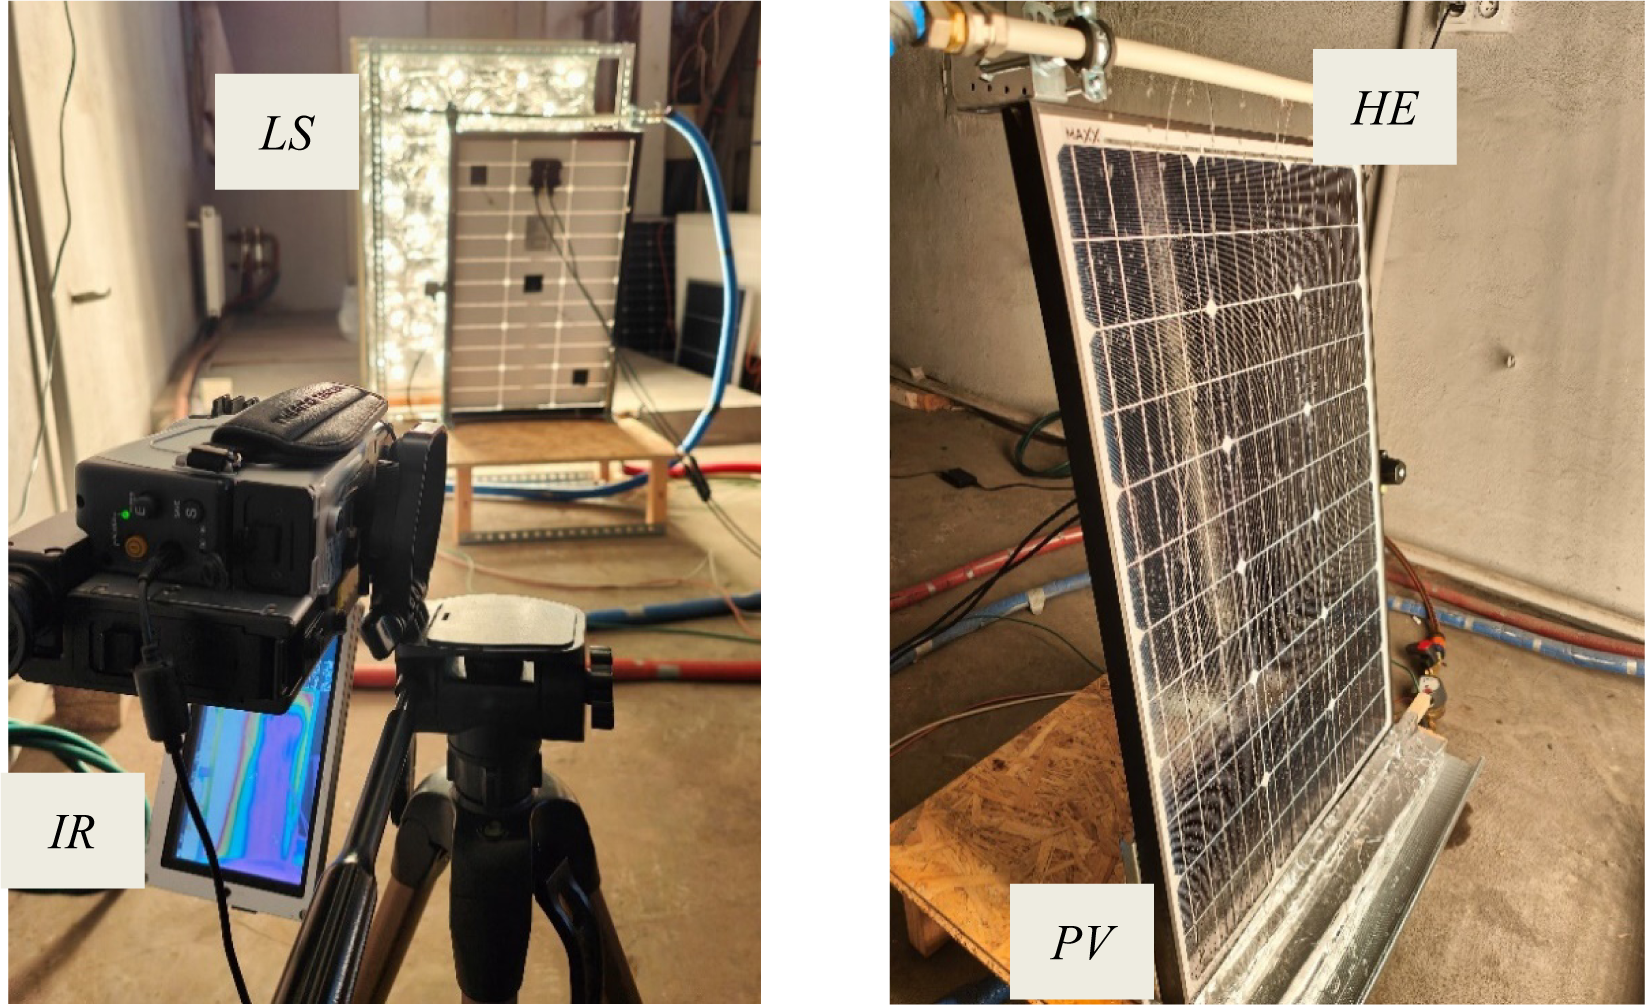
Electricity generated in the PV panel was conditioned via an electrical load (EL). The use of electrical load allowed for determining the operational characteristics (I-V and P-V). The operational characteristics were performed in stable conditions, i.e., when the panel surface temperature reached a constant value. The main components of the experimental rig ER-1 are shown in Figure 2, while the general view of the rig is presented in Figure 3.
The main components of the experimental rig ER-1 (LS – light source, PV – PV panel, HE – header, WC – water collector, WT – water tank, WP – water pump, F – filter, PYR – pyranometer, EL – electronic load, CHC – charging controller, BAT – battery, PLC – programmable logic controller, PC – computer, IR – infrared camera)
The general view of the experimental rig ER-1
The experimental rig ER-2 was located at AGH UST in Krakow. The construction parameters of the tested water cooling system were adopted based on the results of the works performed under laboratory conditions. Measurements were carried out for seven days during early autumn. Early autumn well reflects the weather conditions that occur in Poland throughout the year. During this time there are days with high temperatures and irradiance as well as cloudy and rainy days. During the experiment temperature ranges from 18-25 °C and irradiance up to 815 W/m2. The Polish climate conditions is characterised by very variable temperature from aprox. -20 to +35 °C, irradiance up to 1 000-1 100 W/m2 and insolation of 1 000 – 1 100 kWh/(m2×year). The developed system was equipped with the following elements:
PV panels – two units EGE-310M-60 consisted of 60 monocrystalline solar cells with parameters given in Table 2.
The main parameters of the tested 310 Wp PV panel
Parameter PV panel EGE-310M-60 Solar cell type monocrystalline Open circuit voltage UOC, V 39.99 Short circuit current ISC, A 9.70 Matched voltage UMPP, V 33.30 Matched current IMPP, A 9.31 Matched power PMPP, W 310.00 Dimensions, m 0.99 ×1.64 × 0.04 water cooling system equipped with the header (HE), water collector (WC), filter (F), water tank (WT), water pump (WP), and other hydraulic components:
pyranometer (PYR) – the unit PYR20 (the same as in rig ER-1);
temperature sensors – Pt100 resistance sensors with a measuring range from – 50 °C to 400 °C and tolerance ±0.3+0.005×[t];
charge controller – the unit MPPT-20 with rated system voltage 12/24 VDC, rated charge current 20 A, and self-consumption lower than 130 mA;
AGM batteries VRLA 12 V 20 Ah;
programable logic controller (PLC) – the unit WAGO PFC200 with input and output modules, including the analog, digital, and communication modules.
All controlled and measured parameters were available via CoDeSys 2.9 software using a specially developed visualization.
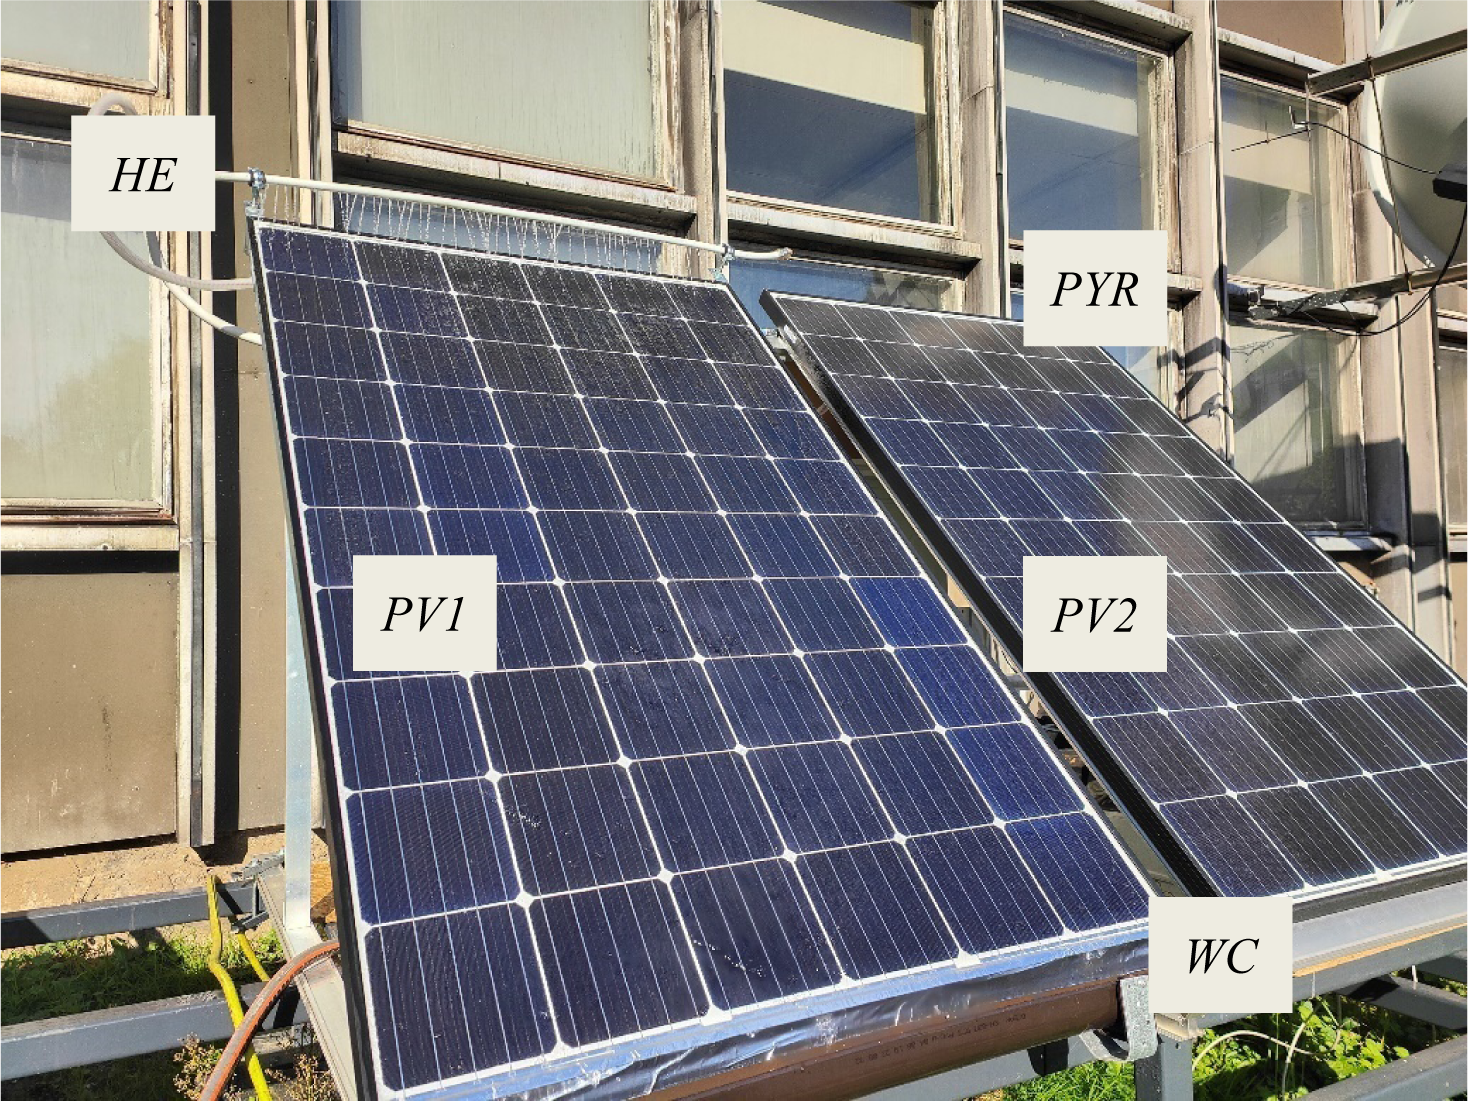
During the measurements, the power generation in the water-cooled PV panel (PV1) and the non-cooled PV panel (PV2) was determined. The non-cooled PV panel (PV2) was used as a reference device to assess the impact of a DWC system on the performance of the tested devices. Both panels were connected to the MPPT charge controllers, which operated with AGM batteries (two batteries connected in parallel were connected to each charge controller). To determine the influence of temperature on the operation parameters of the tested PV panels, five temperature sensors were placed on the rear side of the devices (one placed in the middle part of each panel and four placed in the corners). The main elements of the experimental rig ER-2 are shown in Figure 4.
The main components of the experimental rig ER-2 (PV1 – PV panel with installed cooling system, PV2 – PV panel without cooling, HE – header, WC – water collector, PYR – pyranometer)
The experiments described in this paper have been divided into five measurement series. Series 1 – 4 were performed under laboratory conditions using experimental rigs ER-1, while Series 5 was conducted under real conditions using experimental rig ER-2. The explanation of each measurement series has been included in Table 3.
Explanation of the measurement series conducted under laboratory conditions
| Series | Explanation | Waterflow [L/min] |
|---|---|---|
| S_1A | Cold PV panel – 27 °C | n/a |
| S_1B | Heated PV panel – 55 °C | |
| S_2A | Header in the form of pipe with a diameter of 16 mm, equipped with water inlets located each 20 mm and characterized by a diameter of 1.5 mm | 1.5 |
| S_2B | 2.0 | |
| S_2C | 2.5 | |
| S_3A | Header in the form of pipe with a diameter of 16 mm, equipped with water inlets located each 10 mm and characterized by a diameter of 2.5 mm | 1.5 |
| S_3B | 2.0 | |
| S_3C | 2.5 | |
| S_4A | Header in the form of pipe with a diameter of 20 mm, equipped with water inlets located each 20 mm and characterized by a diameter of 1.5 mm | 1.5 |
| S_4B | 2.0 | |
| S_4C | 2.5 |
The economic analysis includes investment costs connected with the introduction of the cooling system and the estimated increase in electricity generation performance. It was assumed that PV panels would cover the energy required by the cooling pump, cooler, and controller. The cost of water was omitted because it is possible to use rainwater, and any water losses can be replaced by stored rainwater. However, the cost of rainwater storage was included. The calculations related to the economic analysis were based on formulas taken from Szafranko [33]. The simple payback time of the installation (SPBT) was calculated based on the following eq. (1):
(1)
where IC – initial costs (EUR), and ES – energy savings (EUR/year)
Furthermore, the Net Present Value (NPV) after ten years was calculated using discount rates (α) of 10%. NPV was calculated based on the following eq. (2):
(2)
where IC – initial costs (EUR), CFt – net cash flow during a single period t (EUR/year), α – discount rate (-), and t – number of periods (years).
Finally, the Profitability Index (PI) after ten years was calculated with the use of discount rates (α) of 10 % based on the following eq. (3):
(3)
where IC – initial costs (EUR), CFt – net cash flow during a single period t (EUR/year), α – discount rate (-), and t – number of periods (years).
The results of experimental work for two test stands are presented below: in laboratory and real conditions. In addition, an economic analysis of the proposed solution was carried out.
To determine the reference parameters of the PV panel under the laboratory conditions, the first measurement (series S_1A) was performed for the unheated panel (immediately after switching on the light source, when the PV panel surface temperature was approx. 27 °C). The second measurement (series S_1B) was conducted when the temperature of the PV panel surface reached the average value of approx. 55 °C. In both analyzed cases, temperature distribution on the PV panel surface was characterized by high uniformity in series S_1A, while in series S_1B, higher differences were observed (59.3 °C in point A compared to 52.6 °C in point C). The temperature distribution on the PV panel surface is presented in Figure 5. The light intensity during the tests resulted from the distance between the light source and the tested PV panel (the average light intensity measured on the PV panel surface was about 550 W/m2).
Temperature distribution on the PV panel surface during: series S_1A (a); and series S_1B (b)
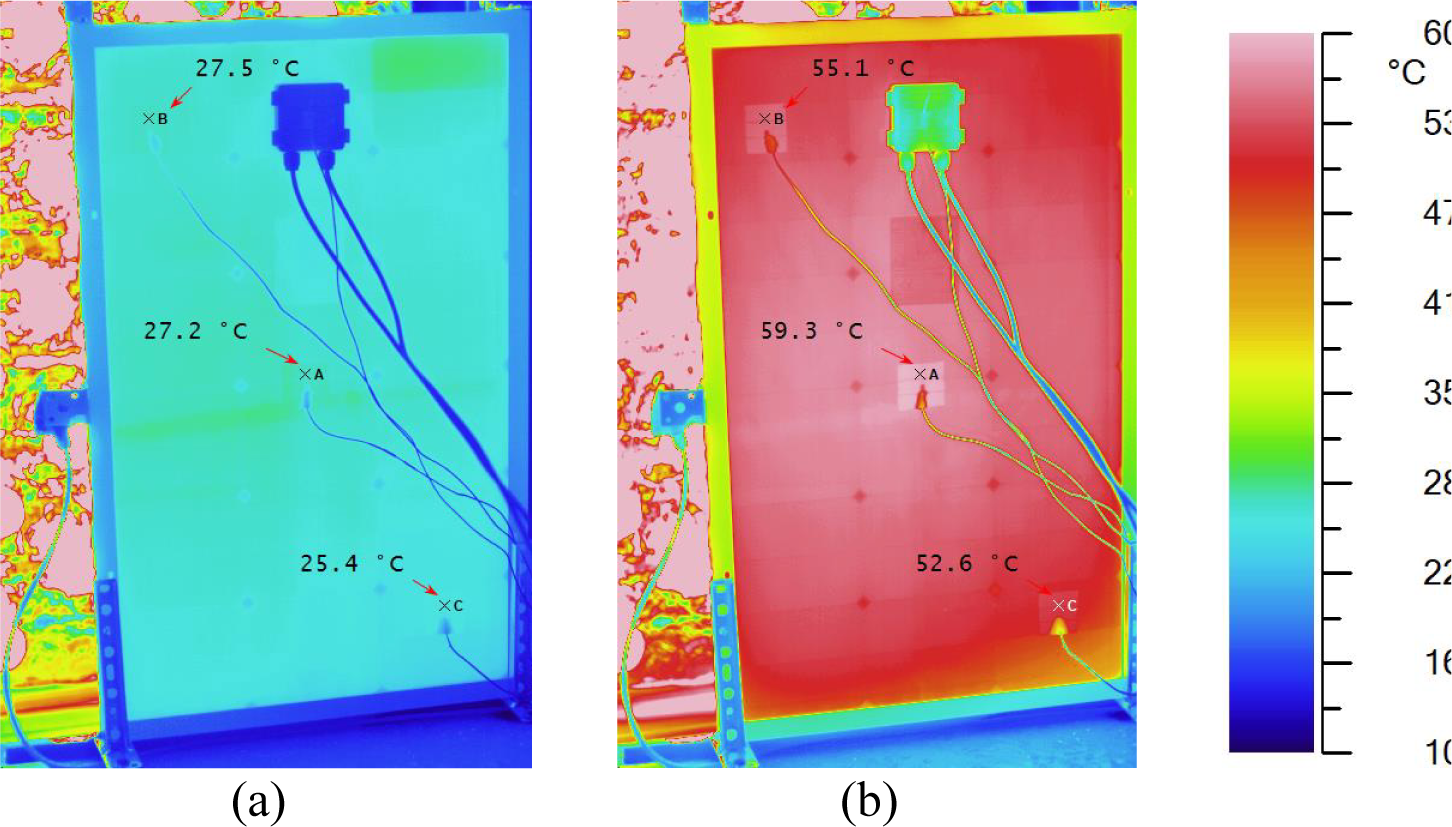
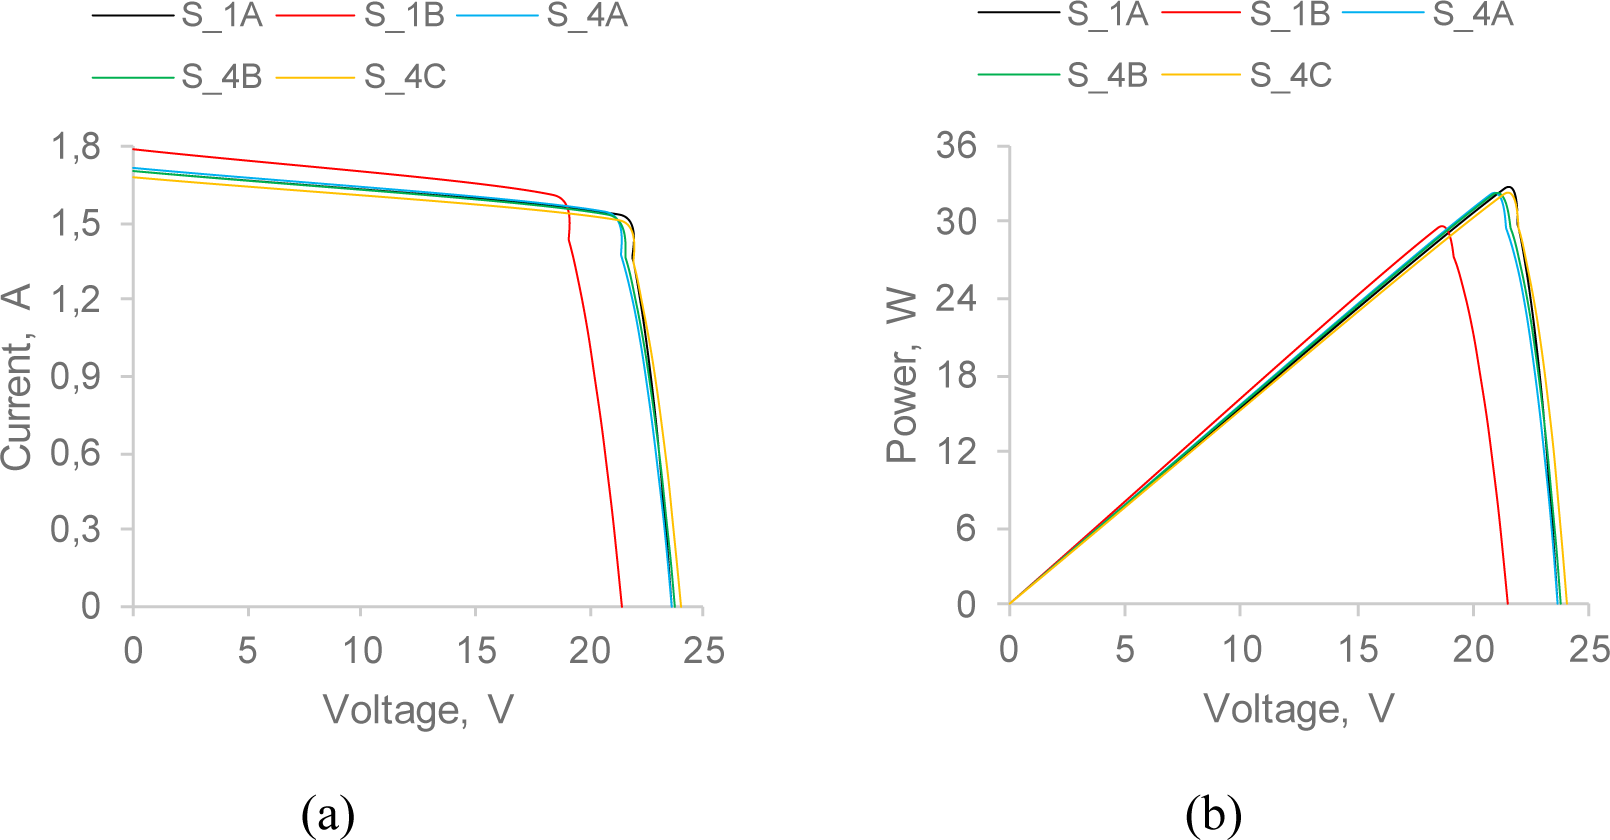
The current-voltage and power-voltage characteristics determined for the PV panel during series S_1A and S_1B are presented in Figure 6a. For series S_1A, the open circuit voltage and the short circuit current were measured at 23.60 V and 1.71 A, respectively. Whereas for S_1B open circuit voltage achieved 21.41 V, and the short circuit was equal to 1.79 A. As can be observed, an increase in PV panel temperature by approx. 28 K caused a 10% decrease in open circuit voltage and a 5% increase in the short circuit current. The maximum power measured during Series S_1B (presented in Figure 6b) was consequently lower by 10% than the maximum power obtained in Series S_1A (29.64 W compared to 32.59 W). Based on the obtained results, temperature coefficients of PMPP, VOC, and ISC were determined. There were calculated as -0,32 %/°C (PMPP), -0,33 %/°C (VOC), and 0,19 %/°C (ISC), respectively.
The impact of the temperature on the operation of the tested PV panel: current-voltage characteristic (a); power–voltage characteristic (b)
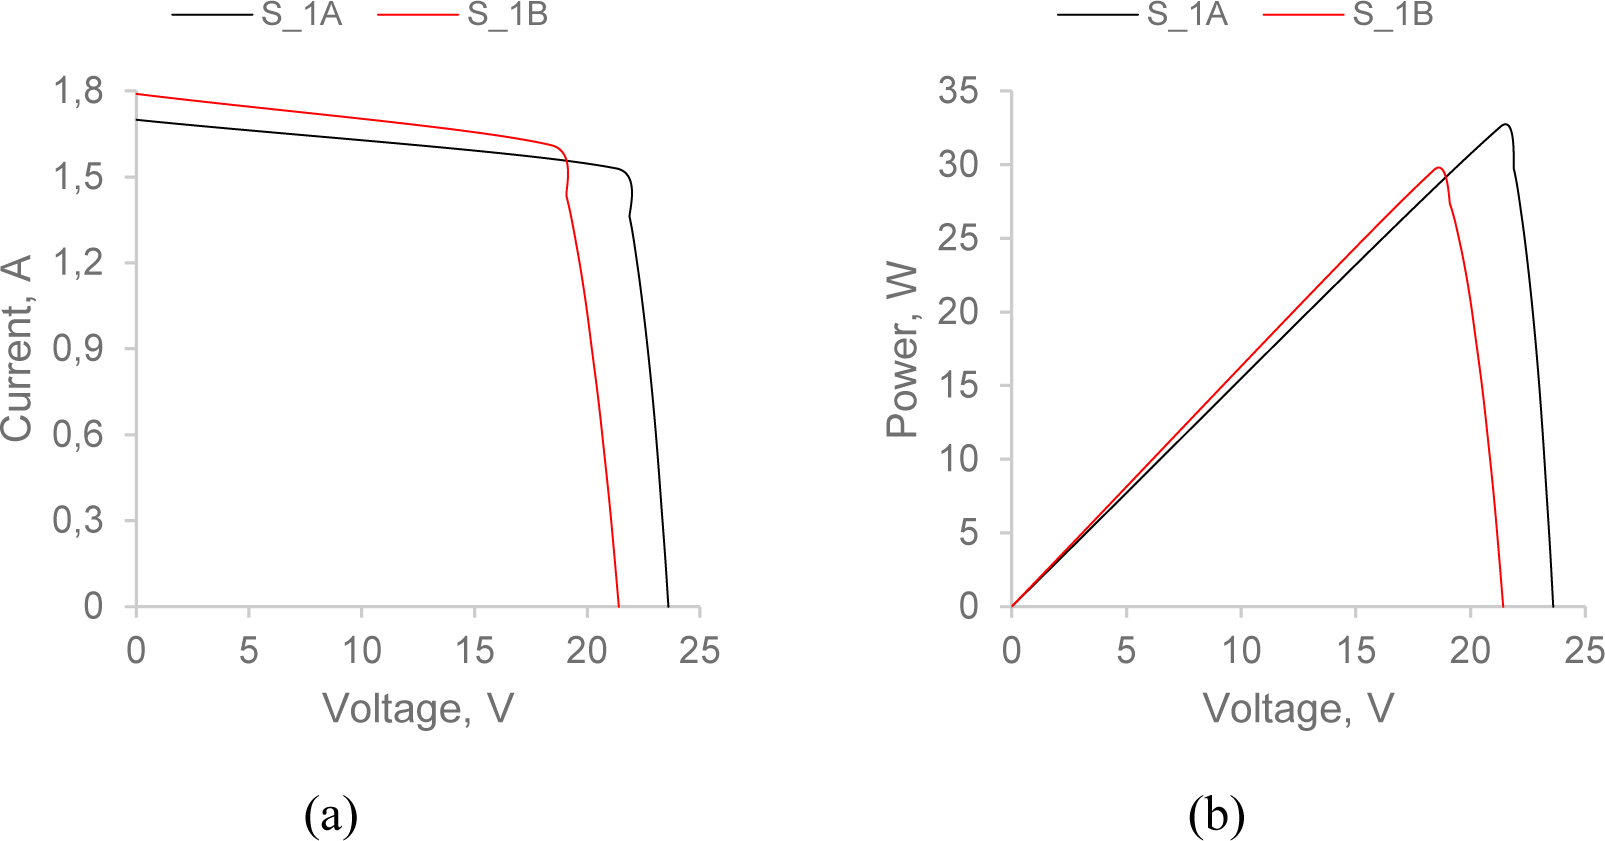
The main parameters of the tested PV panel measured during series S_1A and S_1B are summarized in Table 4. It can be noted that less than half of the power declared by the manufacturer in STC was reached under laboratory tests (32.59 W compared to 70 W), which was caused, e.g., by lower light intensity and the type of light source. This is due to the different characteristics of artificial light (the spectrum of radiation) compared to solar light [34] and additionally due to different irradiation conditions, where in STC conditions the irradiance is 1000 W/m2, and in the analyzed case was 550 W/m2. The peaks in Figure 6b presented maximum power, so-called maximum power point, obtaind during the measurement in series S_1A and S_1B. As it is presented in Table 4 maximum power for S_1A and S_1B was 32.59 W and 29.64 W, respectively. Maximum power in different conditions is received for different voltage (VMPP) and current (IMPP).
The main parameters of the tested PV panel resulted from the temperature of its surface
| Parameter | S_1A | S_1B |
|---|---|---|
| The average temperature of the PV panel surface, °C | 27.0 | 55.0 |
| Open circuit voltage VOC, V | 23.60 | 21.41 |
| Short circuit current ISC, A | 1.71 | 1.79 |
| Matched voltage VMPP, V | 21.30 | 18.40 |
| Matched current IMPP, A | 1.53 | 1.61 |
| Matched power PMPP, W | 32.59 | 29.64 |
Taking into account the fact, that increase in PV panel temperature causes a reduction in the PV panel performance, the DWC system was proposed. To provide the optimal construction of the DWC system, various configurations of the header and various values of water flow were tested. In addition to electrical parameters, temperature distribution on the PV panel surface was observed (using an infrared camera), and power transferred from the PV panel surface to cooling water was calculated (based on measured values of water temperature at the inlet to the header, the water temperature at the outlet from water collector, and water flow).
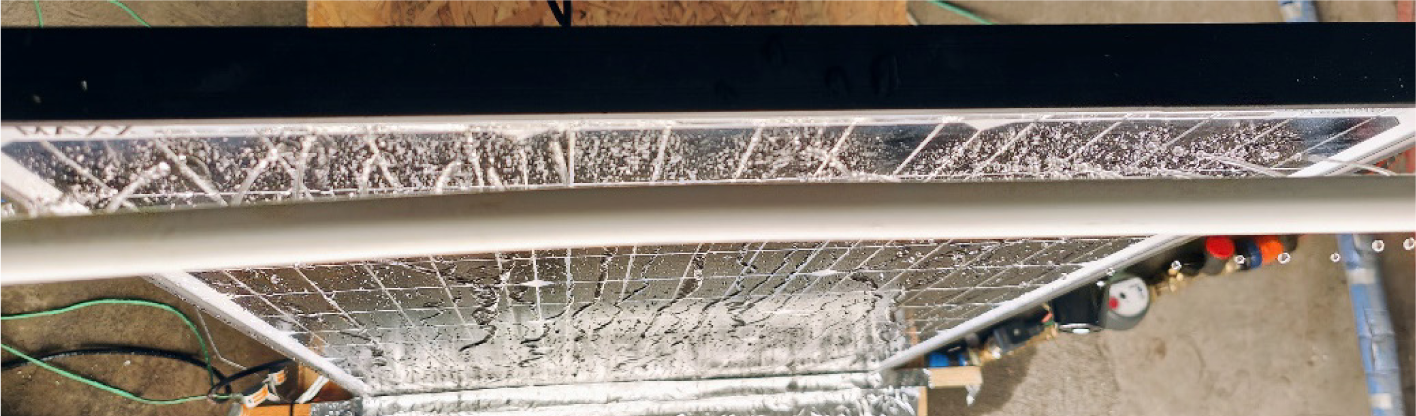
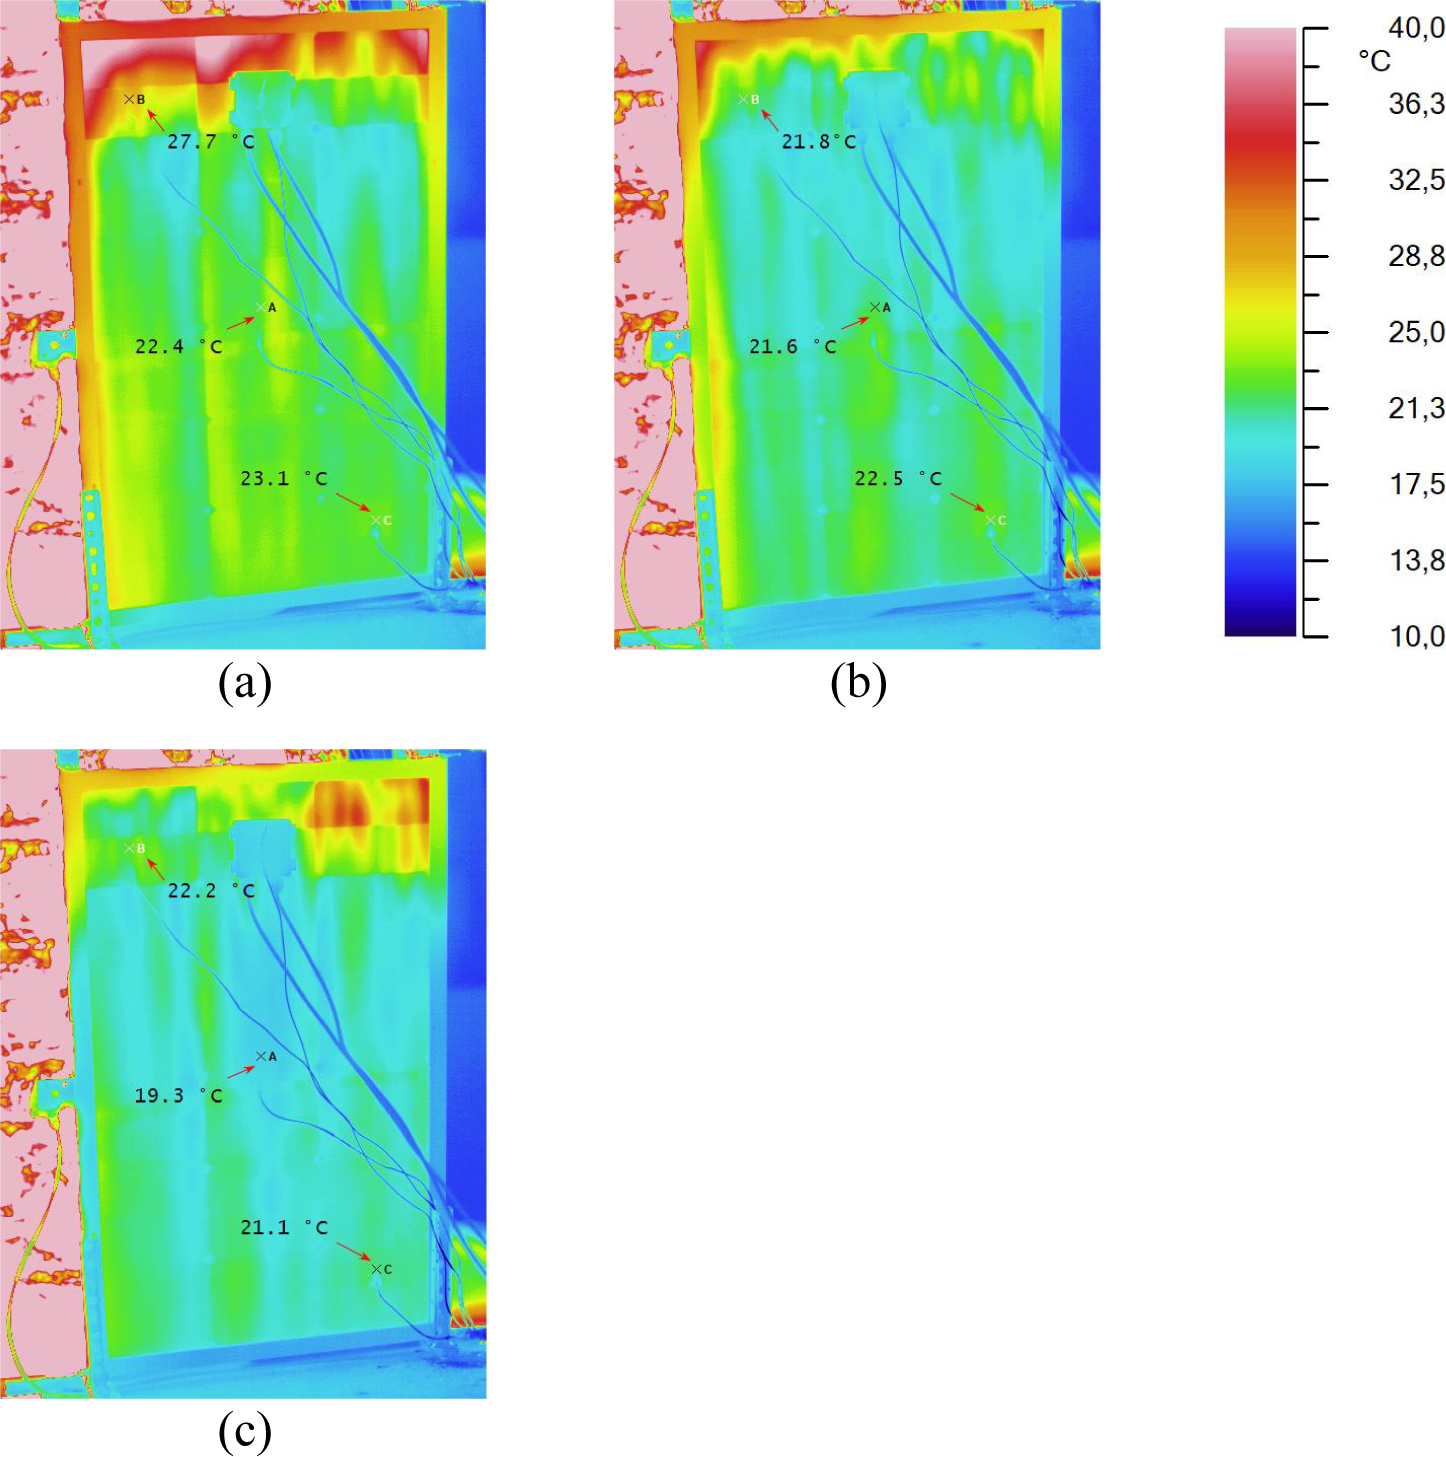
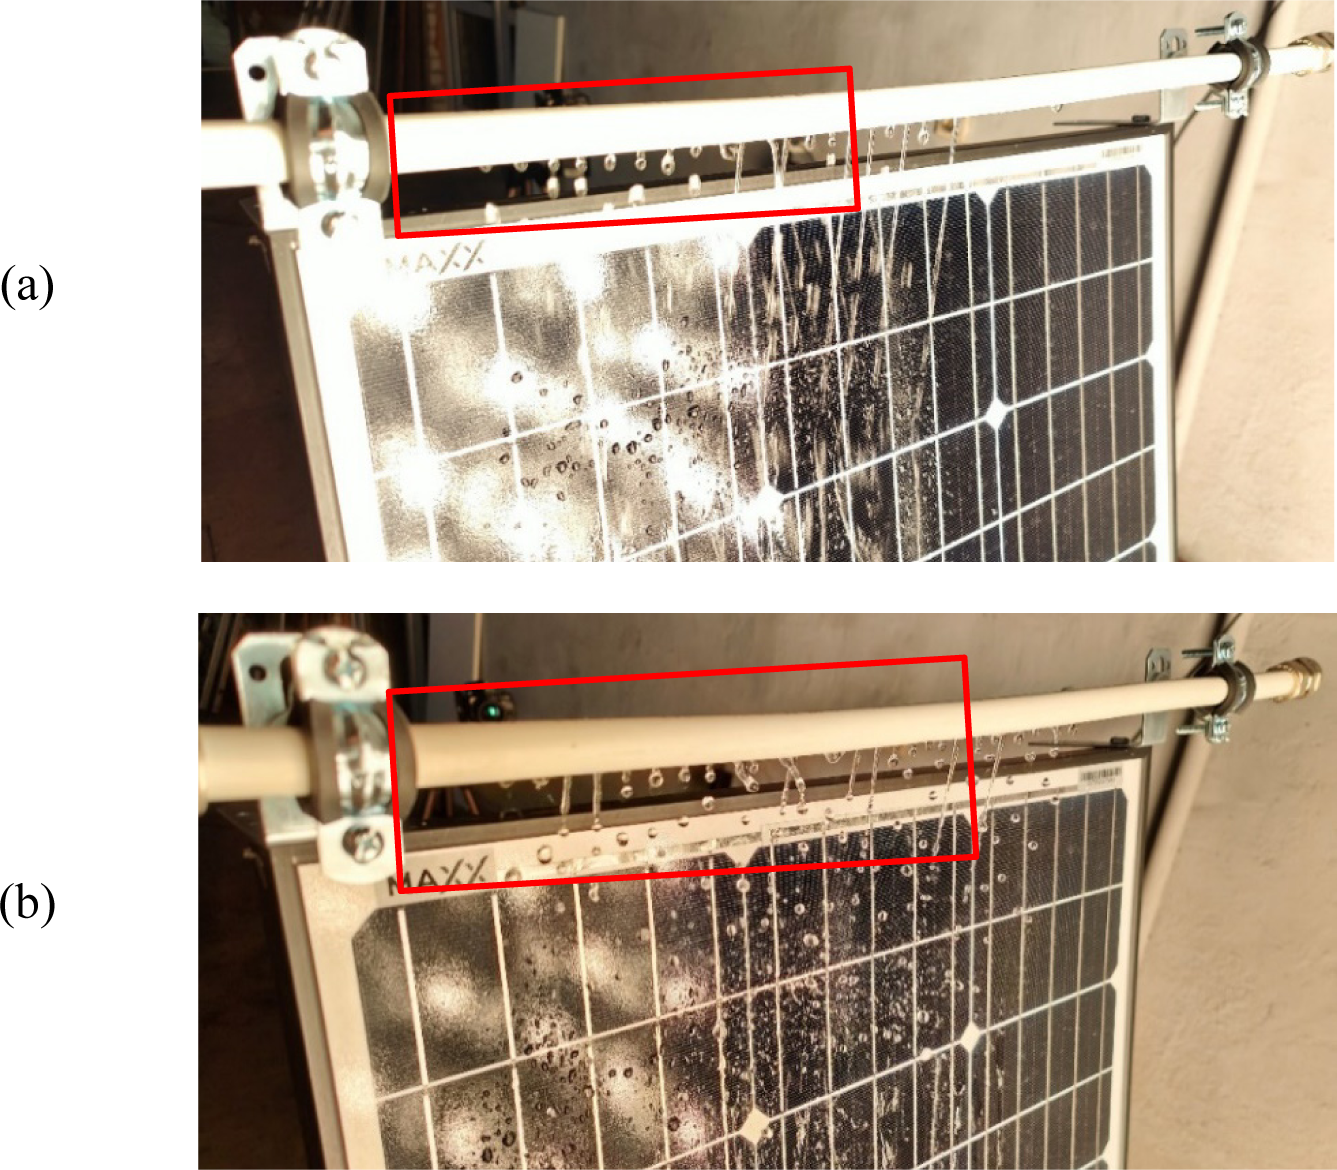
During the series S_2A, S_2B, and S_2C, the header was developed in the form of a pipe with a diameter of 16 mm, which was equipped with water inlets located each 20 mm and characterized by a diameter of 1.5 mm (as was shown in Figure 1a). Regardless of the flow rate of 1.5, 2.0, or 2.5 L/min, water was sprayed evenly from each water nozzle (see Figure 7). Consequently, the temperature distribution on the tested PV panel was almost uniform. Only in the case of a flow of 1.5 L/min (series S_2A), the top line of solar cells heated more intensively than the others (see Figure 8).
The uniform water flow through the header during the series S_2A – S_2C
Temperature distribution on the PV panel surface during: series S_2A (a); series S_2B (b); and series S_2C (c)
The effect of proper operation of the DWC system was almost identical values of power generated in MPP for each of the analyzed water flows (32.94 W in the case of series S_2A, 33.00 W in the case of series S_2B, and 32.91 W in the case of series S_2C). These values were close to the maximum power measured in series S_1A when the cold PV panel was tested. Comparing the maximum power observed during series S_2A – S_2B to the maximum power observed in series S_1B (when the temperature of the PV panel was approx. 55 °C), the average increase in the performance of the PV panel was approx. 11.0%. It confirms the legitimacy of applying the DWC system to the tested PV panel (as was observed, it can provide similar operating parameters to a non-heated PV panel). The operation parameters of the PV panel in series S_2A, S_2B, and S_2C, compared to series S_1A and S_1B, are presented in Figure 9. Furthermore, the main parameters of the tested PV panel during the discussed series are shown in Table 5.
The impact of the direct water cooling on the operation of the tested PV panel: current-voltage characteristic (a); power–voltage characteristic (b)
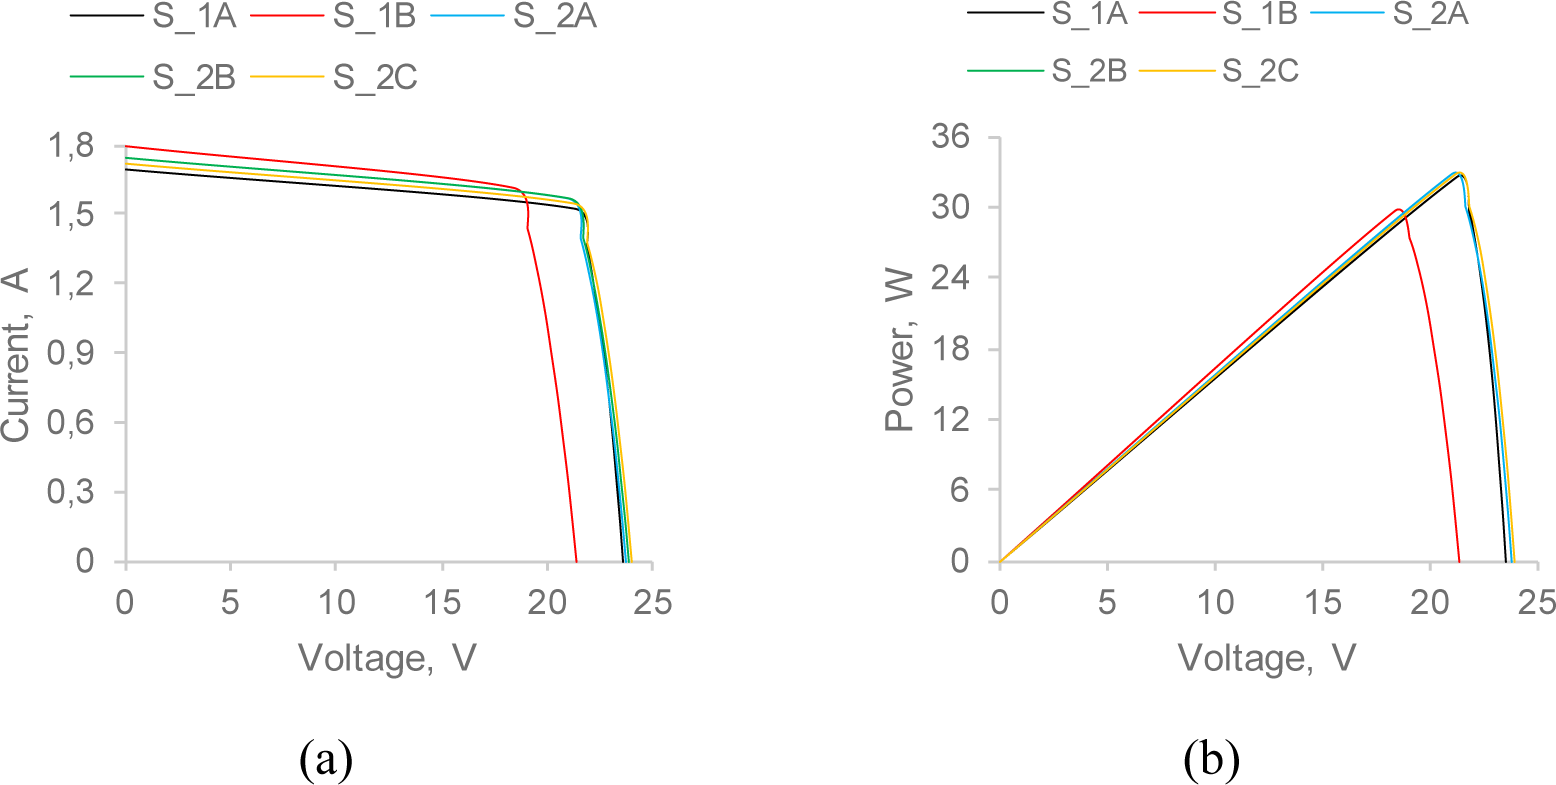
The main parameters of the tested PV panel resulted from the temperature of its surface
| Parameter | S_2A | S_2B | S_2C |
|---|---|---|---|
| Open circuit voltage VOC, V | 23.78 | 23.9 | 23.99 |
| Short circuit current ISC, A | 1.74 | 1.74 | 1.72 |
| Matched voltage VMPP, V | 20.98 | 21.02 | 21.23 |
| Matched current IMPP, A | 1.57 | 1.57 | 1.55 |
| Matched power PMPP, W | 32.94 | 33.00 | 32.91 |
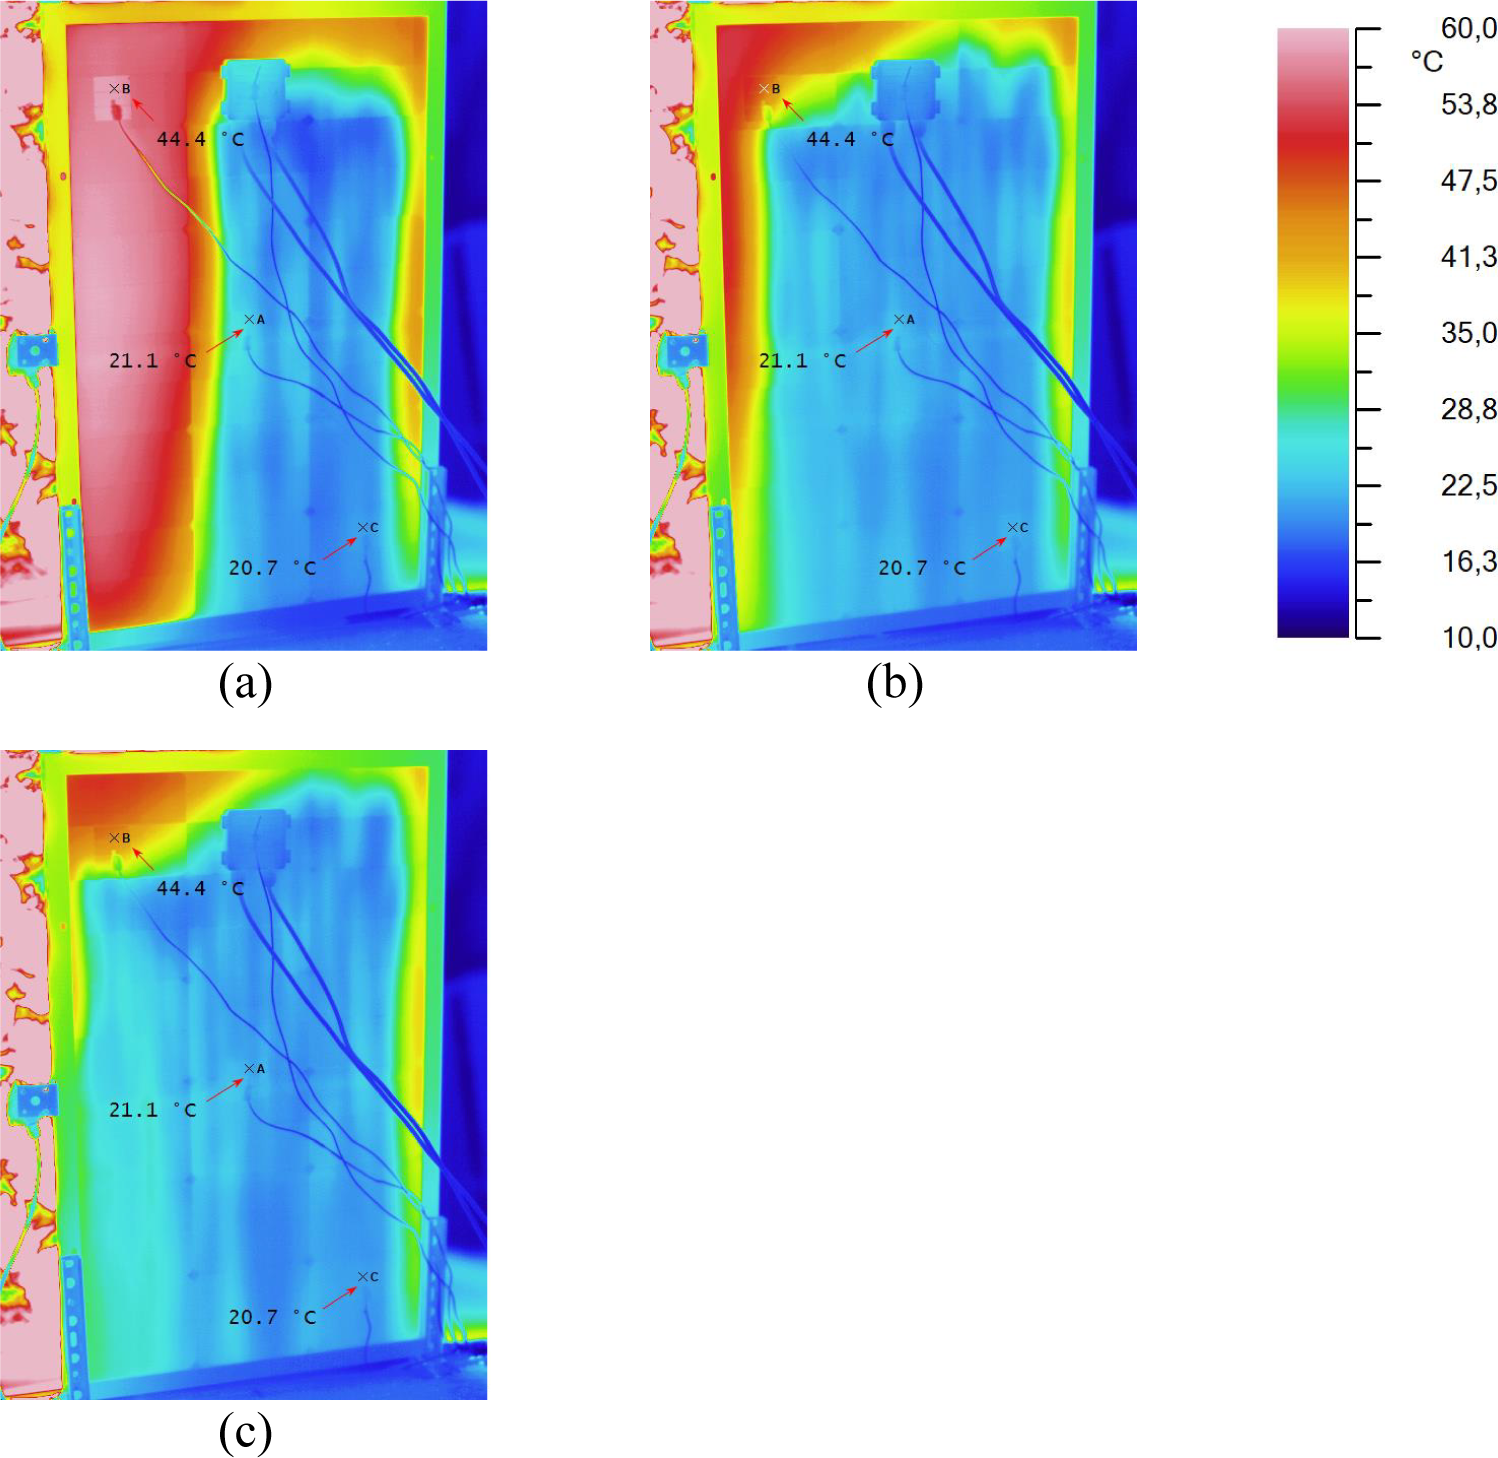
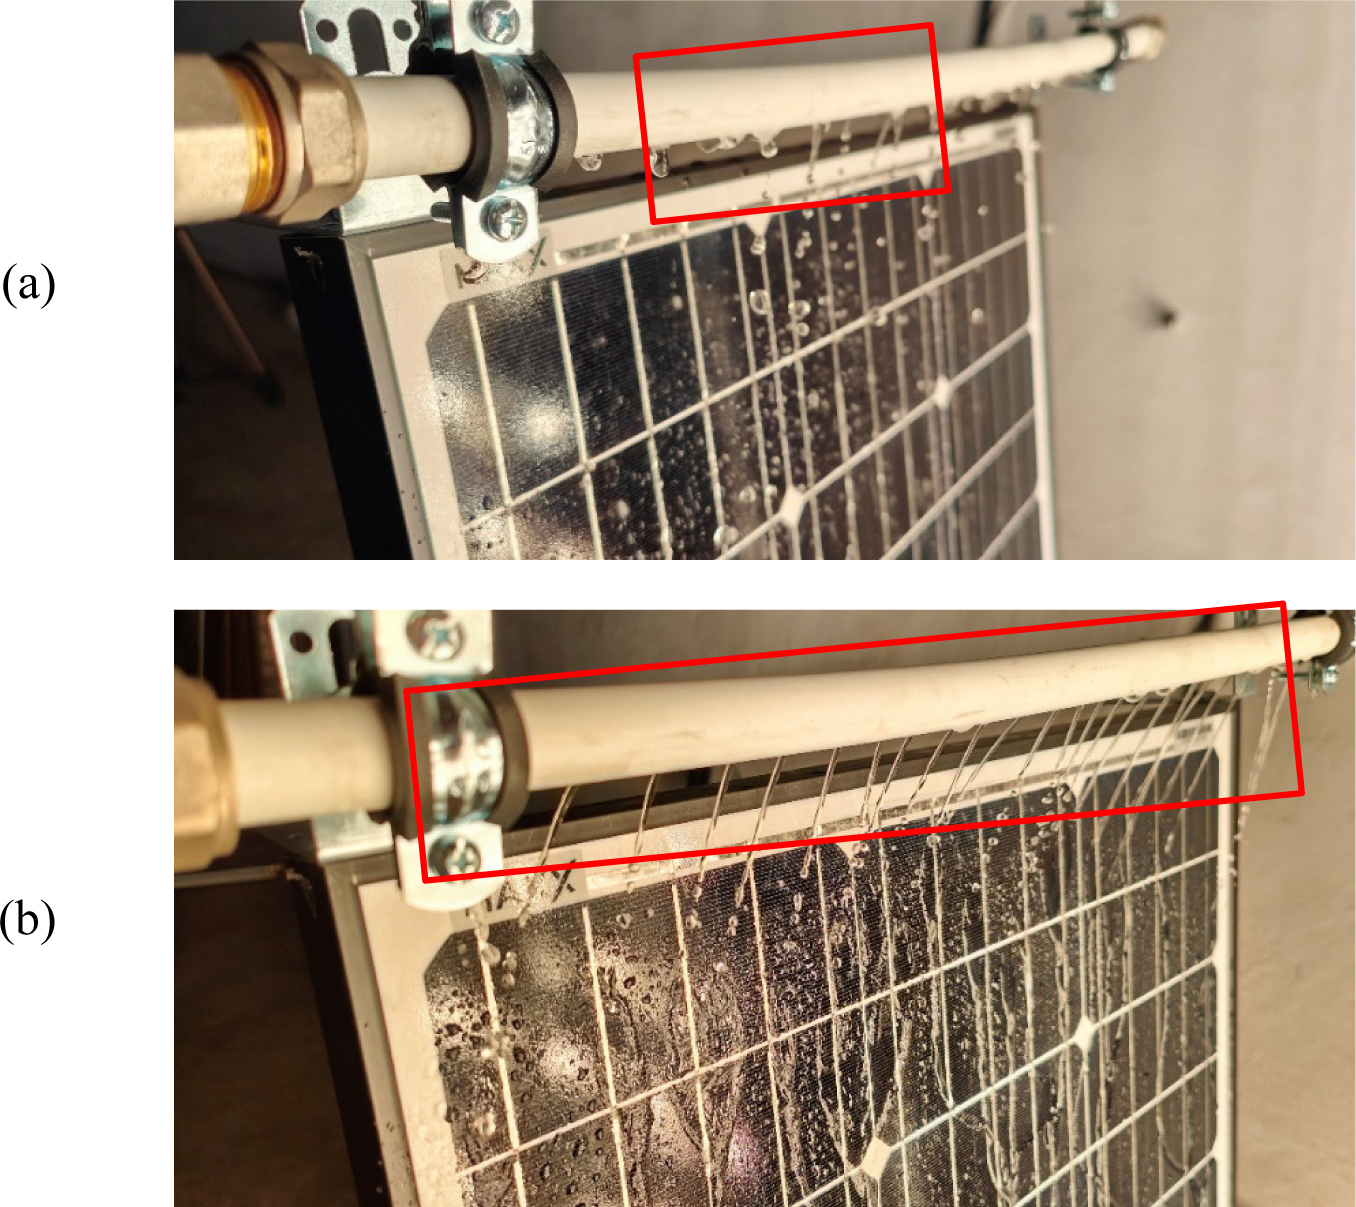
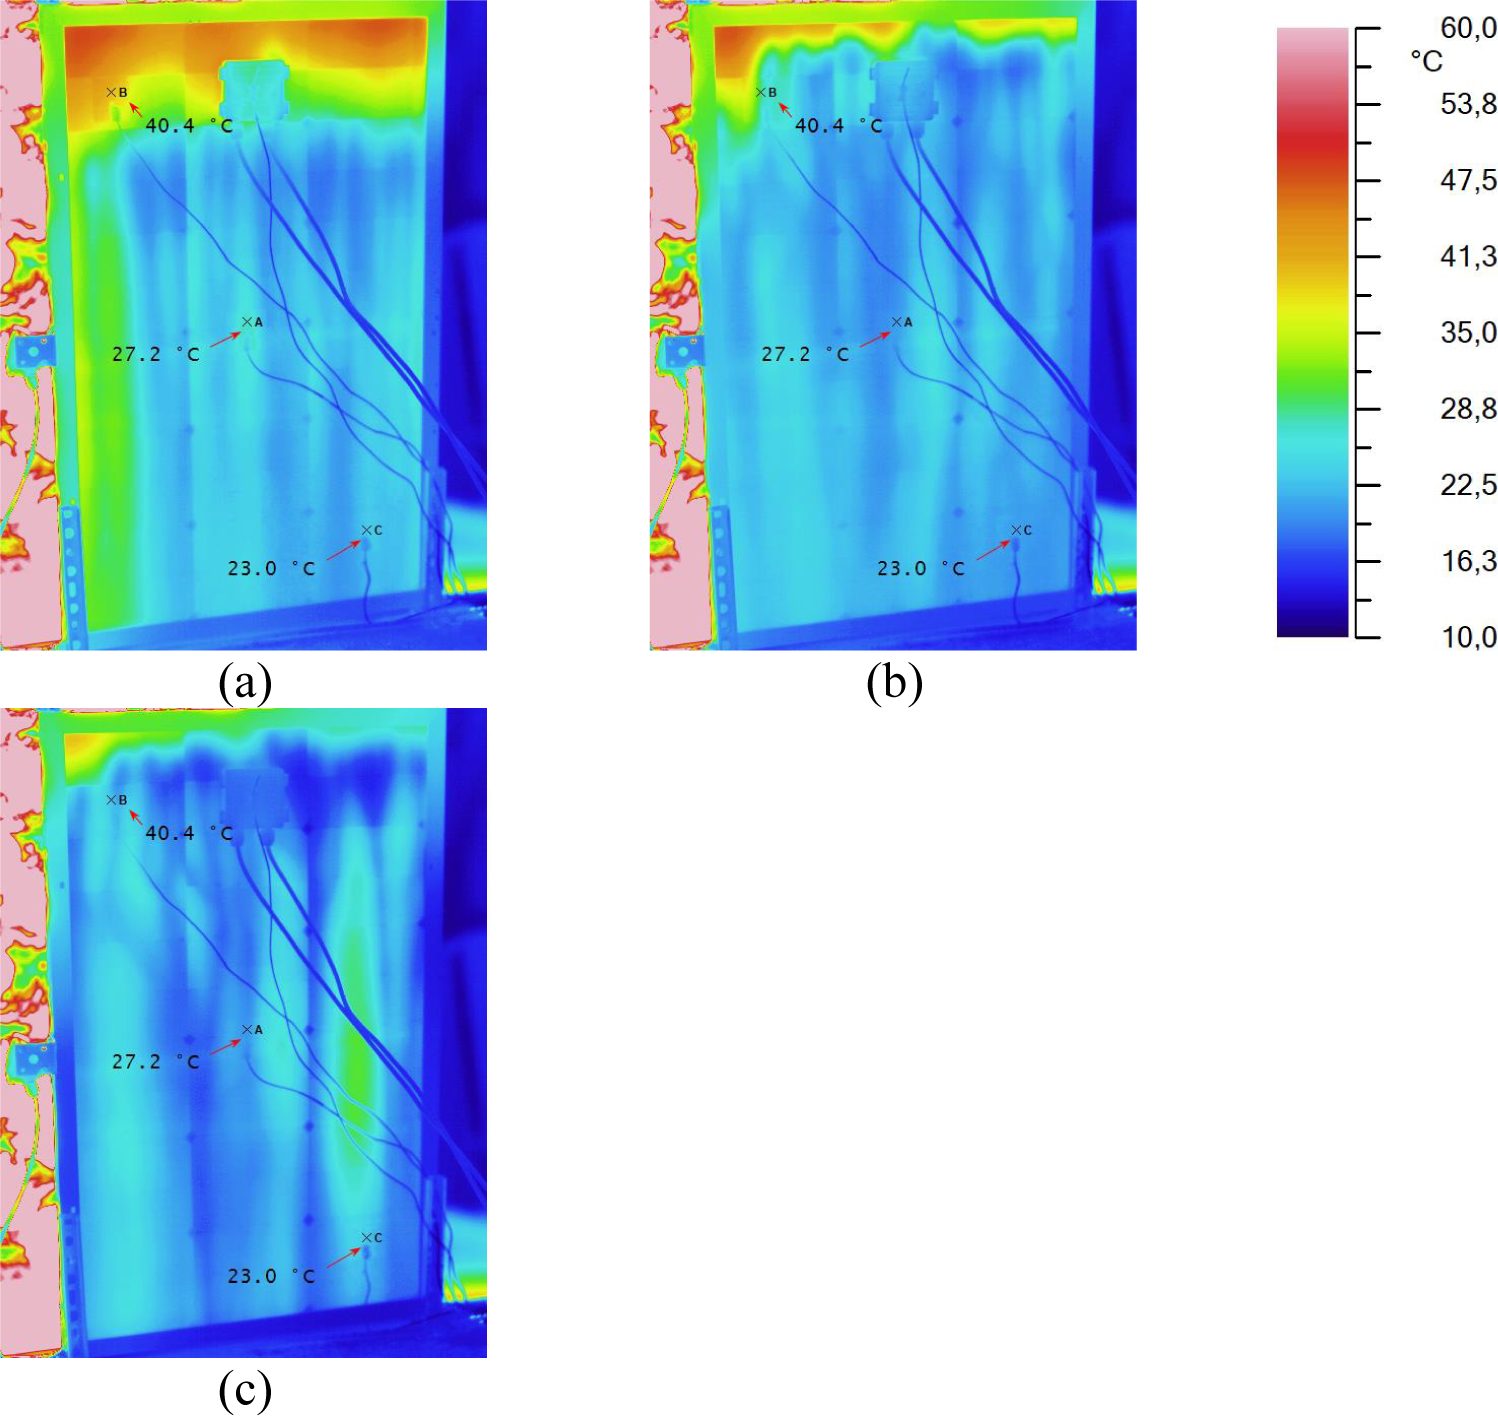
The second configuration of the DWC system was equipped with the header in the form of a pipe with a diameter of 16 mm, which was equipped with water inlets located each 10 mm and characterized by a diameter of 2.5 mm (see Figure 1b). As before, three levels of water flow were analyzed: 1.5, 2.0, and 2.5 L/min. Figure 10 shows water flow from nozzles in the case of flow 1.5 L/min (Figure 10a), 2.0 L/min (Figure 10b). In both cases, water flow was insufficient to provide uniform cooling on the whole surface of the analyzed PV panel. The proposed diameter of the water nozzles was too large compared to water flow and pressure. In the case of water flow 1.5 L/min (series S_3A), only half of the nozzles worked properly, while in the case of water flow 2.0 L/min (series S_3B), the number of active nozzles was higher and equal to 70%. Not sufficient water flow observed in series S_3A and S_3B resulted in the non-uniform temperature of the PV panel. Considering series S_3A, more than one-third of the PV panel surface was characterized by the temperature at a level of approx. 55 °C. For series S_3B the situation was better, but around 20% of the PV panel surface was still overheated. Only in the case of series S_3C, when the water flow was 2.5 L/min, the temperature distribution was acceptable (only the left top corner was characterized by higher temperature). However, it was still worse compared to the series S_2A – S_2C (see Figure 11).
Problems with water flow through the header
Temperature distribution on the PV panel surface during: series S_3A (a); series S_3B (b); and series S_3C (c)
The consequence of the non-uniform temperature distribution on the PV panel surface was its lower performance compared to series S_3A – S_3C. The maximum achieved power was 30.48 W, 31.26 W, and 31.38 W for series S_3A, S_3B, and S_3C, respectively. The average power achieved during this part of the study was 31.04 W, while the average power achieved during series S_2A – S_2C was 32.95 W (the difference was approx. 6.15%). Furthermore, this value was lower by 4.76% compared to series S_1A and higher by 4.72% compared to series S_1B. The configuration proposed in this step is worse than that analyzed in series S_2A – S_2B, regardless of the water flow. Figure 12 presents the operational characteristics of the PV panel determined during series S_5A – S_5C and compared with series S_1A and S_1B. The main parameters observed during series S_3A – S_3C are given in Table 6.
The impact of the direct water cooling on the operation of the tested PV panel: current-voltage characteristic (a), and power–voltage characteristic (b)
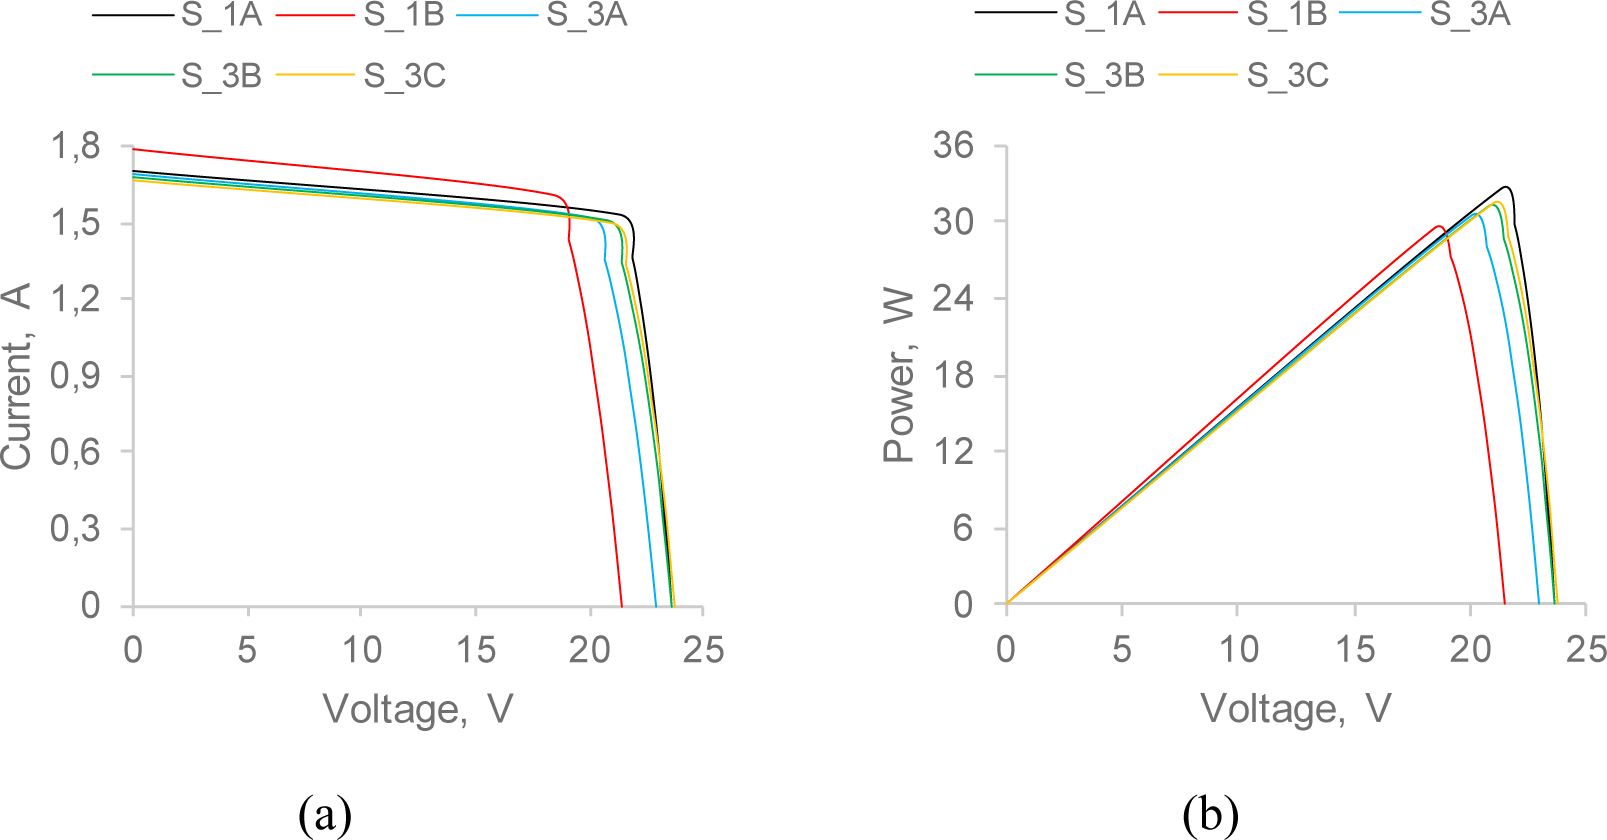
The main parameters of the tested PV panel resulted from the temperature of its surface
| Parameter | S_3A | S_3B | S_3C |
|---|---|---|---|
| Open circuit voltage VOC, V | 22.98 | 23.56 | 23.71 |
| Short circuit current ISC, A | 1.69 | 1.68 | 1.67 |
| Matched voltage VMPP, V | 20.05 | 20.70 | 20.92 |
| Matched current IMPP, A | 1.52 | 1.51 | 1.50 |
| Matched power PMPP, W | 30.48 | 31.26 | 31.38 |
The proposed configuration of the header caused an insufficient flow of water through the system. To get a more uniform temperature distribution on the PV panel surface, the water flow should be greater than 2.5 L/min or higher water pressure should be used. On the other hand, an increase in water flow or pressure will increase the amount of energy consumed by the pump.
Finally, the header in the form of a pipe with a diameter of 20 mm, equipped with water inlets located each 20 mm and characterized by a diameter of 1.5 mm, was introduced to the DWC system (see Figure 1c). Once again, it was observed that water flow at 1.5 L/min and 2.0 L/min was insufficient to effectively cool the PV panel surface (only part of the water nozzles worked properly, and some areas of the PV panel remained overheated). On the other hand, when a water flow of 2.5 L/min was used, the PV panel surface was cooled more effectively, and a uniform temperature distribution was observed (see Figure 13 and Figure 14).
Water flows through water inlets in: S_4A (a); and S_4C (b)
Temperature distribution on the PV panel surface during: Series S_4A (a); Series S_4B (b); and Series S_4C (c)
In series S_4A, S_4B, and S_4C, the maximum power reached levels 32.02 W, 32.04 W, and 32.09 W, respectively. These values were lower by approx. 1.66% compared to series S_1A, and higher by approx. 8.13% compared to series S_1B. However, the above-discussed limitations cause this configuration to be less promising than the variant analyzed in series S_2A – S_2C. The operating characteristics of the PV panel are shown in Figure 15, and the summarizing of the measured parameters is presented in Table 7.
The impact of the direct water cooling on the operation of the tested PV panel: current-voltage characteristic (a); and power–voltage characteristic (b)
The main parameters of the tested PV panel resulted from the temperature of its surface
| Parameter | S_4A | S_4B | S_4C |
|---|---|---|---|
| Open circuit voltage VOC, V | 23.56 | 23.79 | 23.98 |
| Short circuit current ISC, A | 1.72 | 1.70 | 1.68 |
| Matched voltage VMPP, V | 20.66 | 20.94 | 21.25 |
| Matched current IMPP, A | 1.55 | 1.53 | 1.51 |
| Matched power PMPP, W | 32.02 | 32.04 | 32.09 |
In addition to the analysis of the electrical performance of the PV panel, the possibility of using heat collected from the PV panel surface was investigated. As was observed, the increase in water temperature varied from 1.8 K to 3.3 K, depending on the series. Consequently, the thermal power collected by cooling water from the PV panel surface was calculated as 222.6 W – 420.6 W. The average increase in water temperature and thermal power measured during series S_2A – S_2C, S_3A – S_3C, and S_4A – S_4C are summarized in Table 8. Comparing individual values given in Table 8, it can be observed that an average power collected from the PV panel surface achieved the maximum values in series S_2A and S_2B when the water flow was set to 1.5 L/min and 2.0 L/min, respectively, and in series S_4C when the water flow was set to 2.5 L/min. Furthermore, an average power collected from the PV panel related to the surface of 1 m2 can be calculated. This value reached the maximum of 919.9 W/m2 in series S_2B, 749.2 W/m2 in Series S_3B, and 1 018.2 W/m2 in series S_4C. When the maximum electric power of 33.0 W was achieved in series S_2B, the thermal power was lower by 9.7% compared to series S_4C when the electric power was 32.09 W.
The impact of water flow on the thermal power collected from the PV panel surface
| Parameter | Series | |||
|---|---|---|---|---|
| S_2A | S_2B | S_2C | The average value | |
| An average increase in water temperature, K | 3.3 | 2.9 | 2.4 | 2.8 |
| An average power collected from the PV panel, W | 289.1 | 380.0 | 411.9 | 360.3 |
| S_3A | S_3B | S_3C | The average value | |
| An average increase in water temperature, K | 2.3 | 2.2 | 1.8 | 2.1 |
| An average power collected from the PV panel, W | 222.6 | 302.9 | 309.5 | 278.3 |
| S_4A | S_4B | S_4C | The average value | |
| An average increase in water temperature, K | 3.2 | 2.9 | 2.4 | 2.9 |
| An average power collected from the PV panel, W | 270.2 | 336.7 | 420.6 | 342.5 |
Table 9 summarizes the results for series S_1A – S_1B, S_2A – S_2B, S_3A – S_3C, and S_4A – S_4C. Series S_1B was assumed as the reference series, meaning all individual values were set to 1.00 (i.e., open-circuit voltage, short-circuit current, matched voltage, matched current, and matched power). The choice of series S_1B as a reference series results from the fact that during this series, the PV panel worked at such a temperature as in typical summer conditions (i.e., about 55 °C). Any other series included in Table 9 represents results relative to series S_1B. It can be observed that introducing the DWC system equipped with the header in the form of a pipe with a diameter of 16 mm, and water inlets located each 20 mm and characterized by a diameter of 1.5 mm, approx. 12% increase in the generated electric power can be achieved. An increase in generated power can be higher if the removal of contaminants from the PV panel surface is considered. Furthermore, in the case of other header configurations, electric power also increased compared to the reference system. In these situations, an increase in the power value was lower and ranged from approx. 3% to 9%. Analyzing all obtained results, it can be concluded that lowering the temperature by using the proposed system has a greater impact on the PV panel performance than a slight decrease in light illumination (the increase in matched voltage is significantly higher than the decrease in matched power compared to the reference values). Considering the comparison results in Table 9, the first configuration of the DWC system was implemented to the external rig ER-1 and used to carry out the tests in real conditions.
Similar values of the power increase of the cooled PV panels were obtained in the literature. Moharram et al. [35] using direct water cooling system achieved a power increase of 12.5% compared to the uncooled PV panel. Whereas Jailany et al. [36] for direct water cooling PV panel efficiency increased more than 9%. Rasool and Abdullah [37] depends of water flow the efficiency of the cooled PV panel increased by 10.4 - 19.7%. In other experimental studies, Fakouriyan et al. [38] using a water tank, an increase in efficiency of 12.3% was obtained. The angle of inclination of the PV panels can also play an important role. Muslim et al. [39], depending on the angle of inclination of the modules and the water flow of 4 L/min, achieved an increase in efficiency for cooled PV panels by 13.6 – 17%.
The comparison of electrical parameters of the tested PV panel depending on the configuration of the direct cooling system
| Series | Open circuit voltage VOC[-] | Short circuit current ISC[-] | Matched voltage VMPP[-] | Matched current IMPP[-] | Matched power PMPP[-] |
|---|---|---|---|---|---|
| S_1A | 1.11 | 0.95 | 1.16 | 0.96 | 1.10 |
| S_1B | 1.00 | 1.00 | 1.00 | 1.00 | 1.00 |
| S_2A | 1.12 | 0.98 | 1.15 | 0.98 | 1.12 |
| S_2B | 1.12 | 0.98 | 1.15 | 0.98 | 1.12 |
| S_2C | 1.13 | 0.97 | 1.16 | 0.97 | 1.12 |
| S_3A | 1.08 | 0.95 | 1.09 | 0.95 | 1.03 |
| S_3B | 1.11 | 0.94 | 1.13 | 0.94 | 1.06 |
| S_3C | 1.11 | 0.94 | 1.14 | 0.94 | 1.06 |
| S_4A | 1.11 | 0.97 | 1.13 | 0.97 | 1.09 |
| S_4B | 1.12 | 0.95 | 1.14 | 0.96 | 1.09 |
| S_4C | 1.13 | 0.94 | 1.16 | 0.94 | 1.09 |
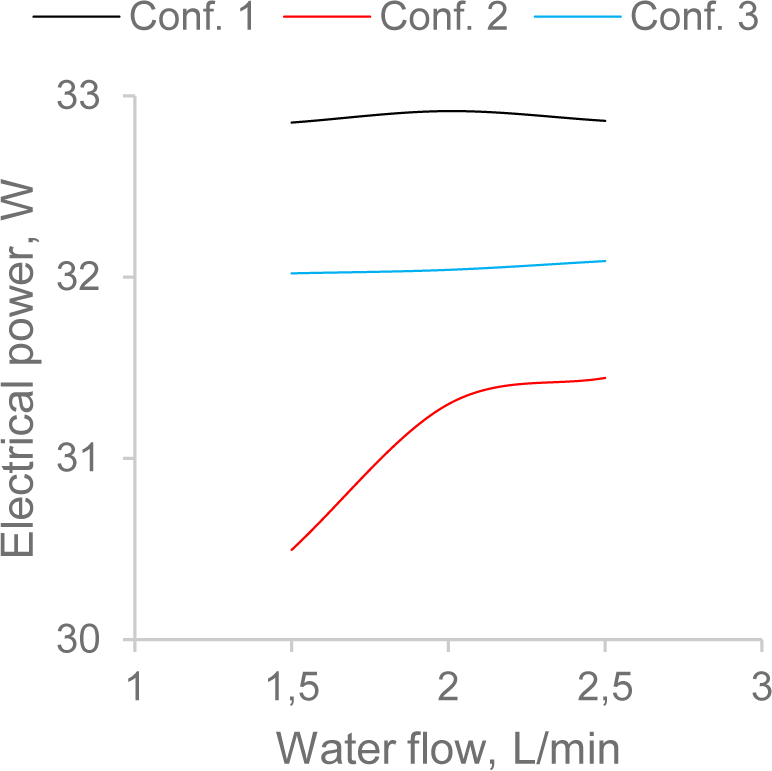
In addition to the general comparison presented in Table 9, the impact of the water flow on the electrical performance can be considered separately for each series. The electrical power generated during individual series in the function of water flow is illustrated in Figure 16. It can be observed that the power generated in the tested PV varied slightly in series S2_A – S_2C (when configuration no. 1 of the header was used) and in series S_4A – S_4C (when configuration no. 3 of the header was implemented). In contrast to this series, in series S_3A – S_3C (when configuration no. 2 of the header was tested), the generated power increased with the increase in water flow. It was caused mainly by problems with the proper operation of water nozzles and, consequently, the non-uniform temperature of the PV panel surface. Analyzing these results, it can be drawn that using a small diameter of water nozzles (in the analyzed case – 1.5 mm), the water flow level does not significantly affect the electrical performance of the PV panel. On the other hand, when the diameter of water nozzles is higher (for example, 2.5 mm), water flow at a level of at least 2.5 L/min should be provided. Alternatively, water could be pumped with higher pressure, but made at the beginning of the presented investigations, it was assumed to develop a non-pressurized water cooling system.
The impact of water flow on the electrical performance of the PV panel depending on the DWC system configuration
The configuration of the DWC system proposed during series S_2A – S_2C was implemented to the external rig ER-2 and used to carry out the field tests under real conditions. The discussed experiments were carried out for seven days at the beginning of Autumn 2022. The length of the header and the number of water nozzles were modified and adapted to the width of the PV panel used in this part of the conducted work. Additionally, due to the extension of the header, it was necessary to increase the water flow rate to ensure the even flow of the cooling water and its outflow from water nozzles. The water flow was set as 4.0 L/min (this value resulted from the fact that the length of the header has doubled, so the water flow has also doubled compared to the series S_2B). Water flow at a given level was sufficient for uniform temperature distribution on the PV panel surface. The water temperature during the performed experiments varied between 17 and 20 °C. The average temperature of the PV panel equipped with the DWC system ranged from 21 to 27 °C, depending on the intensity of solar radiation, while the average temperature of the non-cooled PV panel was at a level of 21-48 °C. In the examined period, depending on the day, the maximum intensity of solar radiation was approx. 165-815 W/m2.
Table 10 shows the amount of electricity produced by the PV panel with and without the developed DWC system installed. Due to the prevailing conditions of solar radiation intensity (days with long exposure to the sun or cloudy days), different energy yields were obtained each day. Depending on the weather conditions, the use of the cooling system allowed for a slight 1.2% increase in the performance of the PV panel (when cloud cover and low air temperature occurred), while during a sunny day with slight cloudiness and high air temperature, the increase in power generated in the PV panel was 13.7%. In total, for one test week, the average increase in energy production for the PV panel equipped with the DWC system was calculated as 10.3%.
The comparison of electrical parameters of the tested PV panel depending on the configuration of the direct cooling system (PV1 – with cooling system, PV2 – without cooling system)
| Day | Energy generated | Energy increase | |
|---|---|---|---|
| PV1 [Wh] | PV2 [Wh] | [%] | |
| 1 | 1 364.7 | 1 215.2 | 12.3 |
| 2 | 303.9 | 297.6 | 2.1 |
| 3 | 765.3 | 719.2 | 6.4 |
| 4 | 1 259.4 | 1 107.6 | 13.7 |
| 5 | 897.0 | 818.4 | 9.6 |
| 6 | 156.8 | 155.0 | 1.2 |
| 7 | 605.0 | 540.2 | 12.0 |
| Total | 5 352.1 | 4 853.2 | 10.3 |
In addition to the energy aspects, the economic premises of introducing a DWC system to the PV installation were analyzed. Since the first version of the developed prototype was tested, the following assumptions have been introduced:
three options for the nominal power of the PV system were considered: 5.0 kWp, 7.5 kWp, and 10.0 kWp;
an investment cost of introducing the DWC system (water headers, pipes, hydraulic fittings, pump, rainwater storage) to the PV system was estimated as approx. 1 000 EUR – 1 700 EUR, depending on the considered value of the installed power of the PV system;
it was assumed that the operation of the pump and controller would be covered by energy generated in the PV panels;
Polish climatic conditions, characterized by insolation of 1 000 – 1 100 kWh/(m2year), were considered [40];
the actual price of electricity was assumed as 0.2525 EUR/kWh (based on the average price in the EU-27 area for the first half of 2022) [41];
increase in electricity price 5% annually;
the yearly electricity generation can be increased by approx. 10%,
operation of the cooling system:
from beginning of April to end of October (214 days),
water pump works parallel (sequential cooling of two PV panels in one time - water pump power reduction), power of the water pump for 5 kWp, 7.5 kWp and 10 kWp is 40 W, 60 W and 80 W, respectively. Water pump works in average 6 h/day,
power consuming of cooling system controller is 10 W.
The results of an economic analysis were presented in Table 11.
The results of an economic analysis
| Parameter | PV system with an installed power of 5 kWp | PV system with an installed power of 7.5 kWp | PV system with an installed power of 10 kWp |
|---|---|---|---|
| The estimated investment costs, EUR | 1 000.0 | 1 400.0 | 1 700.0 |
| The estimated increase in generated energy, kWh | 500.0 | 750.0 | 1 000.0 |
| The estimated electricity consumption of cooling system, kWh | 64.2 | 89.9 | 115.6 |
| Net increase in generated energy, kWh | 435.8 | 660.1 | 884.4 |
| The estimated economic benefits in the first year, EUR/year | 110.0 | 166.7 | 223.3 |
| SPBT, years | 9.1 | 8.4 | 7.6 |
| The estimated cumulative economic benefits, EUR in 10 years | 1 588.0 | 2 382.0 | 3 176.0 |
| NPV (10 years, α = 10%), EUR | -60.7 | 8.9 | 178.6 |
| PI (10 years, α = 10%), EUR | 0.939 | 1.006 | 1.105 |
The SPBT calculated for installing the DWC system to the PV panels ranges from 7.6 to 9.1 years. Taking into account changes in the value of money, NPV ranges from -60.7 EUR (for a 5.0 kWp PV system) to 178.6 EUR (for a 10.0 kWp PV system) when ten years are considered. Consequently, PI ranges from 0.939 to 1.105. The most promising option is connected with the introduction of the DWC system to the PV system with an installed power of 10.0 kWp.
This paper investigates the possibilities of increasing energy yield from the PV system by introducing the dedicated direct water cooling system in two different conditions: in laboratory scale (PV panel of 70 Wp) and in real condition (PV panel of 310 Wp). Moreover, an economic analysis was performed to determine the reasonableness of using the developed solution in real PV installations. The following conclusions can be drawn:
An increase in the temperature of the PV panel surface from approx. 27 °C to approx. 55 °C can lower its performance by approx. 10% (the value 55 °C can be considered as the average operating temperature of the PV panels in real conditions in Poland).
Depending on the configuration of the DWC system in laboratory scale, an increase in the generated electric power ranged from 3.0% to 12.0%. The greatest increase was achieved when the header was introduced in the form of a pipe with a diameter of 16 mm, water inlets located each 20 mm, and characterized by a diameter of 1.5 mm. This configuration was implemented to the PV panel tested under real conditions.
The increase in water temperature during experiments conducted under laboratory conditions varied from 1.8 K to 3.3 K, and the thermal power collected by cooling water from the PV panel surface ranged from 222.6 W to 420.6 W. It means that by introducing the proposed solution, it will be possible to simultaneous heat and power generation.
Experiments conducted under real conditions confirmed the findings obtained during the tests conducted in the laboratory. Depending on the weather conditions (solar radiation intensity, degree of cloudiness, and air temperature), increasing energy generation by 1.2 – 13.7% was possible. The average increase in energy generation during the seven days of the experiments was approx. 10.3%.
The estimated Simply Payback Time varied from 7.6 to 9.1 years, depending on the assumed power of the final PV system. The highest value of the Net Present Value was calculated as 178.6 EUR when ten years were considered (the profitability index was assessed as 1.105, respectively).
Future works will be focused on the further examination of the proposed DWC system under real conditions. Then, the required modification will be introduced to the prototype, and the prototype will be installed on a higher number of PV panels. Furthermore, a mathematical model describing the operating parameters of the PV panels equipped with the DWC system will be developed and investigated.
This work was carried out under Subvention no. 16.16.210.476 from the Faculty of Energy and Fuels, AGH University of Science and Technology in Krakow.
- ,
Environmental Impact of Solar and Wind energy- A Review ,Journal of Sustainable Development of Energy, Water and Environment Systems , Vol. 10 (2),pp 1-23 , 2022, https://doi.org/https://doi.org/10.13044/J.SDEWES.D9.0387 - ,
The photovoltaic revolution is on: How it will change the electricity system in a lasting way ,Energy , Vol. 265 ,pp 126351 , 2023, https://doi.org/https://doi.org/10.1016/J.ENERGY.2022.126351 - ,
A comprehensive review on multi-physics modeling of photovoltaic modules ,Energy Convers Manag , Vol. 258 ,pp 115414 , 2022, https://doi.org/https://doi.org/10.1016/J.ENCONMAN.2022.115414 - ,
Application of nanofluids and fluids in photovoltaic thermal system: An updated review ,Solar Energy , Vol. 199 ,pp 796–818 , 2020, https://doi.org/https://doi.org/10.1016/J.SOLENER.2020.01.015 - Poland - Energy Sector, https://www.trade.gov/country-commercial-guides/poland-energy-sector
- ,
A comprehensive review on building integrated photovoltaic systems: Emphasis to technological advancements, outdoor testing, and predictive maintenance ,Renewable and Sustainable Energy Reviews , Vol. 156 ,pp 111946 , 2022, https://doi.org/https://doi.org/10.1016/J.RSER.2021.111946 - ,
Building-integrated photovoltaics in hot climates: Experimental study of CIGS and c-Si modules in BIPV ventilated facades ,Energy Convers Manag , Vol. 274 ,pp 116408 , 2022, https://doi.org/https://doi.org/10.1016/J.ENCONMAN.2022.116408 - ,
Economic analysis of BIPV systems as a building envelope material for building skins in Europe ,Energy , Vol. 204 ,pp 117931 , 2020, https://doi.org/https://doi.org/10.1016/J.ENERGY.2020.117931 - ,
An investigation of the aerodynamic parameters for Solar Plane wing profile using CFD modelling ,Computer Science , Vol. 22 (1),pp 123–142 , 2021, https://doi.org/https://doi.org/10.7494/csci.2021.22.1.3569 - ,
Development of a solar-powered small autonomous surface vehicle for environmental measurements ,Energy Convers Manag , Vol. 267 ,pp 115953 , 2022, https://doi.org/https://doi.org/10.1016/J.ENCONMAN.2022.115953 - ,
Influence of Electrical Yield on Temperature Drop of the Photovoltaic Panel: Numerical and Experimental Findings ,Journal of Sustainable Development of Energy, Water and Environment Systems , Vol. 8 (4),pp 641-652 , 2020, https://doi.org/https://doi.org/10.13044/J.SDEWES.D8.0329 - ,
Comprehensive analysis and general economic-environmental evaluation of cooling techniques for photovoltaic panels, Part II: Active cooling techniques ,Energy Convers Manag , Vol. 155 ,pp 301–323 , 2018, https://doi.org/https://doi.org/10.1016/J.ENCONMAN.2017.10.071 - ,
Development and Tests of the Water Cooling System Dedicated to Photovoltaic Panels ,Energies 2022, Vol. 15, Page 5884 , Vol. 15 (16),pp 5884 , 2022, https://doi.org/https://doi.org/10.3390/EN15165884 - ,
Sustainable passive cooling strategy for PV module: A comparative analysis ,Case Studies in Thermal Engineering , Vol. 27 ,pp 101317 , 2021, https://doi.org/https://doi.org/10.1016/J.CSITE.2021.101317 - ,
Experimental and economic analysis of passive cooling PV module using fins and planar reflector ,Case Studies in Thermal Engineering , Vol. 23 ,pp 100801 , 2021, https://doi.org/https://doi.org/10.1016/J.CSITE.2020.100801 - ,
Active cooling of photovoltaic (PV) cell by acoustic excitation in single-dimpled internal channel ,Appl Energy , Vol. 309 ,pp 118466 , 2022, https://doi.org/https://doi.org/10.1016/J.APENERGY.2021.118466 - ,
Experimental and numerical investigation for PV cooling by forced convection ,Alexandria Engineering Journal , Vol. 64 ,pp 427–440 , 2023, https://doi.org/https://doi.org/10.1016/J.AEJ.2022.09.006 - ,
A comprehensive investigation of the optimization cooling technique for improving the performance of PV module with reflectors under Egyptian conditions ,Solar Energy , Vol. 186 ,pp 257–263 , 2019, https://doi.org/https://doi.org/10.1016/J.SOLENER.2019.05.019 - ,
Modeling of a PV system by a back-mounted spray cooling section for performance improvement ,Appl Energy , Vol. 332 ,pp 120532 , 2023, https://doi.org/https://doi.org/10.1016/J.APENERGY.2022.120532 - ,
Performance of a PV module integrated with standalone building in hot arid areas as enhanced by surface cooling and cleaning ,Energy Build , Vol. 88 ,pp 100–109 , 2015, https://doi.org/https://doi.org/10.1016/J.ENBUILD.2014.12.012 - ,
Dynamic Simulation and Energy Economic Analysis of a Household Hybrid Ground-Solar-Wind System Using TRNSYS Software ,Energies 2020, Vol. 13, Page 3523 , Vol. 13 (14),pp 3523 , 2020, https://doi.org/https://doi.org/10.3390/EN13143523 - ,
A cooling design for photovoltaic panels – Water-based PV/T system ,Energy , Vol. 256 ,pp 124654 , 2022, https://doi.org/https://doi.org/10.1016/J.ENERGY.2022.124654 - ,
A comparative study on bifacial photovoltaic/thermal modules with various cooling methods ,Energy Convers Manag , Vol. 263 ,pp 115555 , 2022, https://doi.org/https://doi.org/10.1016/J.ENCONMAN.2022.115555 - ,
Improving Thermal and Electrical Efficiency in Photovoltaic Thermal Systems for Sustainable Cooling System Integration ,Journal of Sustainable Development of Energy, Water and Environment Systems , Vol. 6 (2),pp 305-322 , 2018, https://doi.org/https://doi.org/10.13044/J.SDEWES.D5.0187 - ,
A Review on Heat Extraction Devices for CPVT Systems with Active Liquid Cooling ,Energies 2022, Vol. 15, Page 6123 , Vol. 15 (17),pp 6123 , 2022, https://doi.org/https://doi.org/10.3390/EN15176123 - ,
The possibilities of upgrading an existing concentrating solar thermal system — Case study ,Energy Reports , Vol. 7 ,pp 28–32 , 2021, https://doi.org/https://doi.org/10.1016/J.EGYR.2021.05.059 - ,
Experimental investigations of the microscale concentrated photovoltaic/thermal system based on a solar parabolic trough concentrator ,Energy Reports , Vol. 9 ,pp 86–97 , 2023, https://doi.org/https://doi.org/10.1016/J.EGYR.2023.03.089 - ,
The Use of Fresnel Lenses to Improve the Efficiency of Photovoltaic Modules for Building-integrated Concentrating Photovoltaic Systems ,Journal of Sustainable Development of Energy, Water and Environment Systems , Vol. 6 (3),pp 415-426 , 2018, https://doi.org/https://doi.org/10.13044/J.SDEWES.D6.0204 - ,
Performance enhancement of concentrated photovoltaic systems CPVS using a nanofluid optical filter ,Case Studies in Thermal Engineering , Vol. 35 ,pp 102081 , 2022, https://doi.org/https://doi.org/10.1016/J.CSITE.2022.102081 - ,
Energy production features of rooftop hybrid photovoltaic–wind system and matching analysis with building energy use ,Energy Convers Manag , Vol. 258 ,pp 115485 , 2022, https://doi.org/https://doi.org/10.1016/J.ENCONMAN.2022.115485 - ,
Experimental and simulation investigations of CPV/TEG hybrid system ,J King Saud Univ Sci , Vol. 33 (2),pp 101321 , 2021, https://doi.org/https://doi.org/10.1016/J.JKSUS.2020.101321 - What is the temperature coefficient of solar panels, https://www.futurasun.com/en/temperature-coefficient
- ,
Assessment of the economic efficiency of energy-saving projects, methodology based on simple and compound methods ,Energy Sci Eng , Vol. 10 (2),pp 423–438 , 2022, https://doi.org/https://doi.org/10.1002/ESE3.1032 - Solvothermal modified nano-titania as the potential photocatalyst for the degradation of organic dyes, http://xisdxjxsu.asia
- ,
Enhancing the performance of photovoltaic panels by water cooling ,Ain Shams Engineering Journal , Vol. 4 (4),pp 869–877 , 2013, https://doi.org/https://doi.org/10.1016/J.ASEJ.2013.03.005 - ,
Effect of water cooling on photovoltaic performance ,Misr Journal of Agricultural Engineering , Vol. 33 (1),pp 257–268 , 2016, https://doi.org/https://doi.org/10.21608/MJAE.2016.98185 - ,
Experimental Study of PV Panel Performance Using Backside Water Cooling Chamber ,International Journal of Energy Production and Management , Vol. 8 (2),pp 89–95 , 2023, https://doi.org/https://doi.org/10.18280/IJEPM.080205 - ,
Experimental analysis of a cooling system effect on photovoltaic panels’ efficiency and its preheating water production ,Renew Energy , Vol. 134 ,pp 1362–1368 , 2019, https://doi.org/https://doi.org/10.1016/J.RENENE.2018.09.054 - ,
Enhancement of solar photovoltaic module performance by using a water-cooling chamber for climatic conditions of Iraq ,International Journal of Renewable Energy Research (IJRER) , Vol. 10 (3),pp 1103–1110 , 2020, https://doi.org/https://doi.org/10.20508/IJRER.V10I3.10937.G7984 - ,
An adjustable mounting rack or an additional PV panel? Cost and environmental analysis of a photovoltaic installation on a household: A case study in Poland ,Sustainable Energy Technologies and Assessments , Vol. 47 ,pp 101496 , 2021, https://doi.org/https://doi.org/10.1016/J.SETA.2021.101496 - Electricity price statistics - Statistics Explained, https://ec.europa.eu/eurostat/statistics-explained