


Waste and end-of-life plastics recycling emerges nowadays as one of the most severe issues with limited potential to be resolved by conventional recycling techniques. About 27 million tons of plastic waste was generated in the EU in 2018, of which only 31% is recycled, 42% is utilised in the energy recovery process, and almost 30% is landfilled, resulting in the irrevocable loss of valuable resources [1]. Energy recovery is especially interesting for such materials since it offers a sustainable method to deal with generated waste. Still, it even opens the possibility of producing alternative fuels that can be used elsewhere [2].
Biomass has been widely investigated since it is a feedstock utilised in numerous energy applications for a long time. Nevertheless, some issues constrain the broader deployment of such fuels, like low heating value, high acidity and viscosity, thermal instability, etc. [3]. For this reason, lately, co-pyrolysis with hydrogen-rich feedstock such as plastics has arisen as a potential solution to overcome these drawbacks [4]. Complex biomass structural composition depends on its origin, so that the decomposition mechanism can vary considerably [5]. The decomposition is even more complicated when it comes to waste biomass such as sawdust (SD), which often consists of different types of wood with a higher share of extractives like minerals. Alam et al. co-pyrolysed the homogenous bamboo sawdust with low-density polyethylene (LDPE) [6]. The main conclusion is that the increment of heating rates shifts the position of the peak temperatures and broadens the range of degradation mechanisms. Luo et al. conducted pyrolysis on beech sawdust to determine the decomposition mechanism and activation energies [7]. The three stages of the degradation mechanism have been identified by analysing the conversion rate. Zhang et al. studied wood sawdust in the pyrolysis process [8]. Observations confirmed the three stages of the decomposition mechanism, with the active pyrolysis stage as the most intensified due to the cellulose and hemicellulose degradation.
Like biomass, waste plastics were extensively investigated for fuel production individually and in blends with biomass. Han et al. analysed the kinetic behaviour of polypropylene (PP), two types of polyethylene (LDPE/HDPE), and polyvinyl chloride (PVC) with pine sawdust [9]. The most important observation from this work is that plastics soften at a lower temperature, but it does not decompose. In addition, this softening hinders heat and mass transfer, reflecting lower conversion rates for biomass fraction. Suriapparao et al. conducted microwave-assisted co-pyrolysis of PP and polystyrene (PS) with a different type of biomass to investigate the plastic influence on bio-oil quality [10]. The results show that PP and PS can enhance the bio-oil quality; nevertheless, more should be done to examine interactions of volatiles during the process. Burra and Gupta investigated the kinetics of pinewood and plastic wastes in co-pyrolysis [11]. Among the used plastics was the PP, for which it was concluded that two pseudo components are required for the modelling process, and the highest synergy was observed for a mixture with a low share of PP. Stančin et al. investigated kinetics and thermodynamics parameters from the sawdust and polyurethane foam (PUR) mixtures co-pyrolysis at different heating rates [12]. The results showed that Friedman's method gives the most accurate data regarding the activation energy (Ea). In addition, due to the nature of PUR, the main decomposition steps overlap even though the chemical mechanisms are entirely different. Finally, interesting observations were noticed regarding the behaviour of mixtures, which was more similar in values and trendline to individual PUR pyrolysis rather than SD. Wang et al. reviewed the possibilities to co-pyrolyse biomass and different types of waste plastics [13]. Even though the results regarding the obtained product are extensively presented, the kinetic and thermodynamic parameters data are either missing or briefly given. A similar is noted in the work by Zhang et al., where the focus is more on the obtained products than the process's kinetics [14].
This study presents the thermogravimetric analysis (TGA) on waste biomass sawdust (SD) composed of fir, oak, and beech wood with PP and PS. Even though these plastic materials have been widely investigated, the kinetic and thermodynamic analysis results are limited. It is especially evident in the case of co-pyrolysis with biomass, where most of the research focus was on the analysis of obtained pyrolysis products. Therefore, in this research, the complete focus was given to investigating the decomposition mechanism and related parameters of individual and respective sample mixtures. Evaluating the feedstock interaction during decomposition is crucial in the process modelling.
This section gives information about the used sample and pre-treatment methods. In addition, experimental conditions are presented, followed by a brief explanation of the applied isoconversional model-free methods.
The sawdust sample is a mixture of fir, oak, and beech wood obtained from a local sawmill, and polypropylene and polystyrene previously used as packaging materials for dairy products and cutlery. Investigations were carried out for individual and mixture samples where plastic content varied between 25% and 75%. The sample preparation was done according to the standard procedure [15]. The standard [16] was applied to determine the investigated samples' ultimate and proximate parameters. Results are presented in Table 1. Previously prepared samples were subjected to Simultaneous Thermal Analysis (STA), providing the data for TGA and differential thermal analysis (DTA) analysis on the same sample. The NETZSCH STA 445 F5 Jupiter system was used for STA measurements. The mass of the sample was 10 mg with a deviation of ± 0.5 mg, with particle sizes below 0.25 mm to ensure mixture homogeneity. Samples were heated from room temperature to 550 °C under the four heating rates of 5, 10, 20, and 30 °C/min. Argon was a carrier gas with a 70 mL/min flow.
Results of ultimate and proximate analysis of investigated samples
| Ultimate analysisa [wt.%] | Proximate analysis [wt.%] | HHVb [MJ/kg] | ||||||||
|---|---|---|---|---|---|---|---|---|---|---|
| Sample | C | H | Oc | N | S | Moisture | Volatiles | FC | Ash | |
| PP | 85.5 | 12.4 | 1.9 | 0.1 | 0.1 | 0.3 | 98.7 | - | 1.0 | 45.9 |
| PS | 90.3 | 8.5 | 1.0 | 0.1 | 0.1 | 0.2 | 99.3 | - | 0.5 | 39.2 |
| SD | 47.3 | 6.0 | 46.4 | 0.3 | - | 7.4 | 72.9 | 18.3 | 1.4 | 17.3 |
Dry basis
Higher heating value
By the difference, ash-free basis
For the analysis of activation energies (Ea), the three model-free isoconversional methods were used as follows: Friedman (eq. (1)), Kissinger-Akahira-Sonuse (KAS, eq. (2)), and Ozawa-Flynn-Wall (OFW, eq. (3)):
(1)
(2)
(3)
Where α stands for the degree of conversion, β represents the heating rate, and T is the temperature. The pre-exponential coefficient is A, E is the activation energy, and R represents the universal gas constant. The G(ɑ) represents a constant conversion rate after Doyle's estimation of temperature integral. The thermodynamic parameters and the pre-exponential factors are calculated with the following equations (4)-(7):
Pre-exponential factor (A) (4)
Changes in enthalpy (ΔH) (5)
Changes in entropy (ΔS) (6)
Changes in free Gibbs energy (ΔG) (7)
Where KB is Boltzmann constant (1.381×10⁻²³ J/K), h stands for the Planck constant (6.626×10⁻³⁴ Js), Tm is determined as the derivative thermogravimetric (DTG) peak temperature, and Tα is the temperature at the degree of conversion α [17].
This section first describes results from sample individual analysis and their respective mixtures, followed by a detailed analysis of activation energies. Finally, the section ends with a brief analysis of thermodynamic parameters.
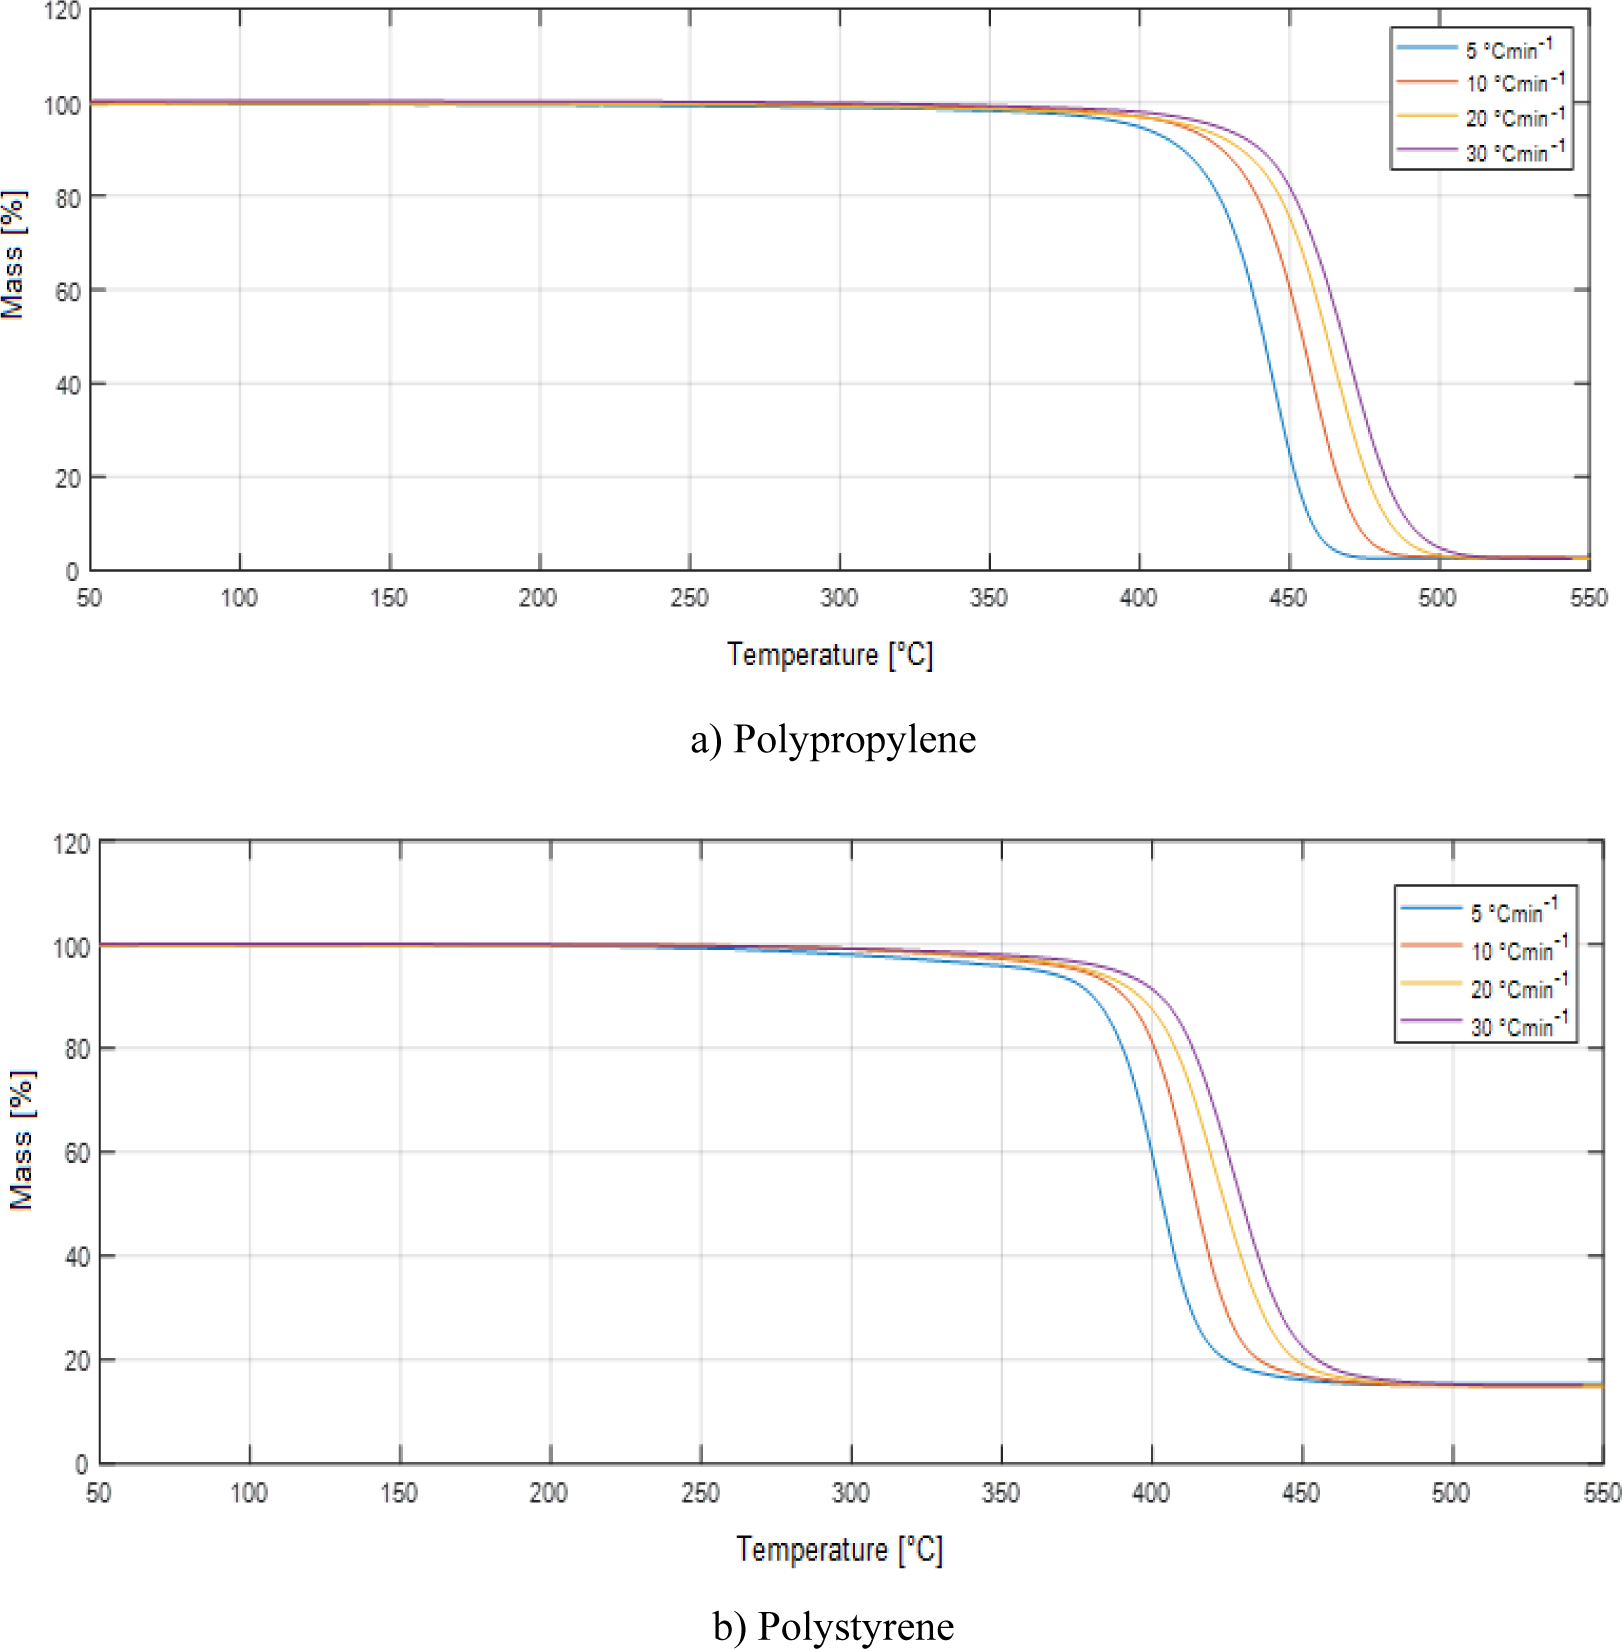
Figure 1 presents the thermogravimetric (TG) curves for individual polypropylene and polystyrene decomposition obtained at four heating rates. The sawdust decomposition was detailly investigated in previous work [12]; therefore, it would not be discussed extensively here. Briefly, decomposition starts with moisture evaporation below 100 °C and ends at 110 °C for a slow heating rate (5 °C/min) and 140 °C for higher heating rates (10 and 20 °C/min). The mass loss in this stage is around 5%. The main stage, where mostly cellulose and hemicellulose are decomposed, starts at about 290 °C for a slow heating rate, while increment of heating rates shifted this to slightly higher temperatures of 300 °C. From DTG curves, decomposition peaks are noted at 342, 352, and 358 °C, respectively. Several other studies already pointed out this shift in the temperature range due to the heating rate increment [18], [19]. The main reason for this phenomenon is heat transfer limitation derived from a temperature gradient between the inner part and particle surface, which blocks the complete release of volatiles [6]. The second stage ends between 370 °C (5 °C/min) and 383 °C (20 °C/min) while the mass loss is more than 60% of the initial sample. In the last stage, lignin is decomposed, and the final mass is about 20% of the initial sample.
As expected, the single-step mechanism is observed in the case of individual polypropylene and polystyrene decomposition (Figure 1), as has already been reported in the literature for plastic materials [20]. The degradation of PP starts at approximately 400 °C for all heating rates. The main peak is observed at 445 °C for a slow heating rate, gradually shifting to 455, 470, and 475 °C with the increment of heating rates, respectively. The visible degradation ends at approximately 470 °C for 5 and 10 °C/min, while for the high heating rate of 20 and 30 °C/min, the end temperature is slightly below 500 °C. PS degradation starts a bit earlier compared to PP, at 375 °C. The peaks occur at a lower temperature as well, between 405 °C for 5 °C/min and 435 °C in case of 30 °C/min.
The degradation is completed at 450 °C for 5 and 10 °C/min heating rates, while a slightly broader range is noted for high heating rates with an end temperature of approximately 475 °C. Regarding the final mass, about 5% of solid residue is left in the case of PP, while almost 18% is observed in the case of PS. The value for PP is expected since it is already reported in the literature [10]. Nevertheless, the value for PS is relatively high and unexpected since the values found in the literature are pronouncedly lower [21]. It might result from contamination or impurities related to the synthesis procedure's usage or nature. The nature of the product (extruded, expanded, foam, etc.) can significantly influence the properties of the plastic.
TG curves of decomposing polypropylene (a) and polystyrene (b)
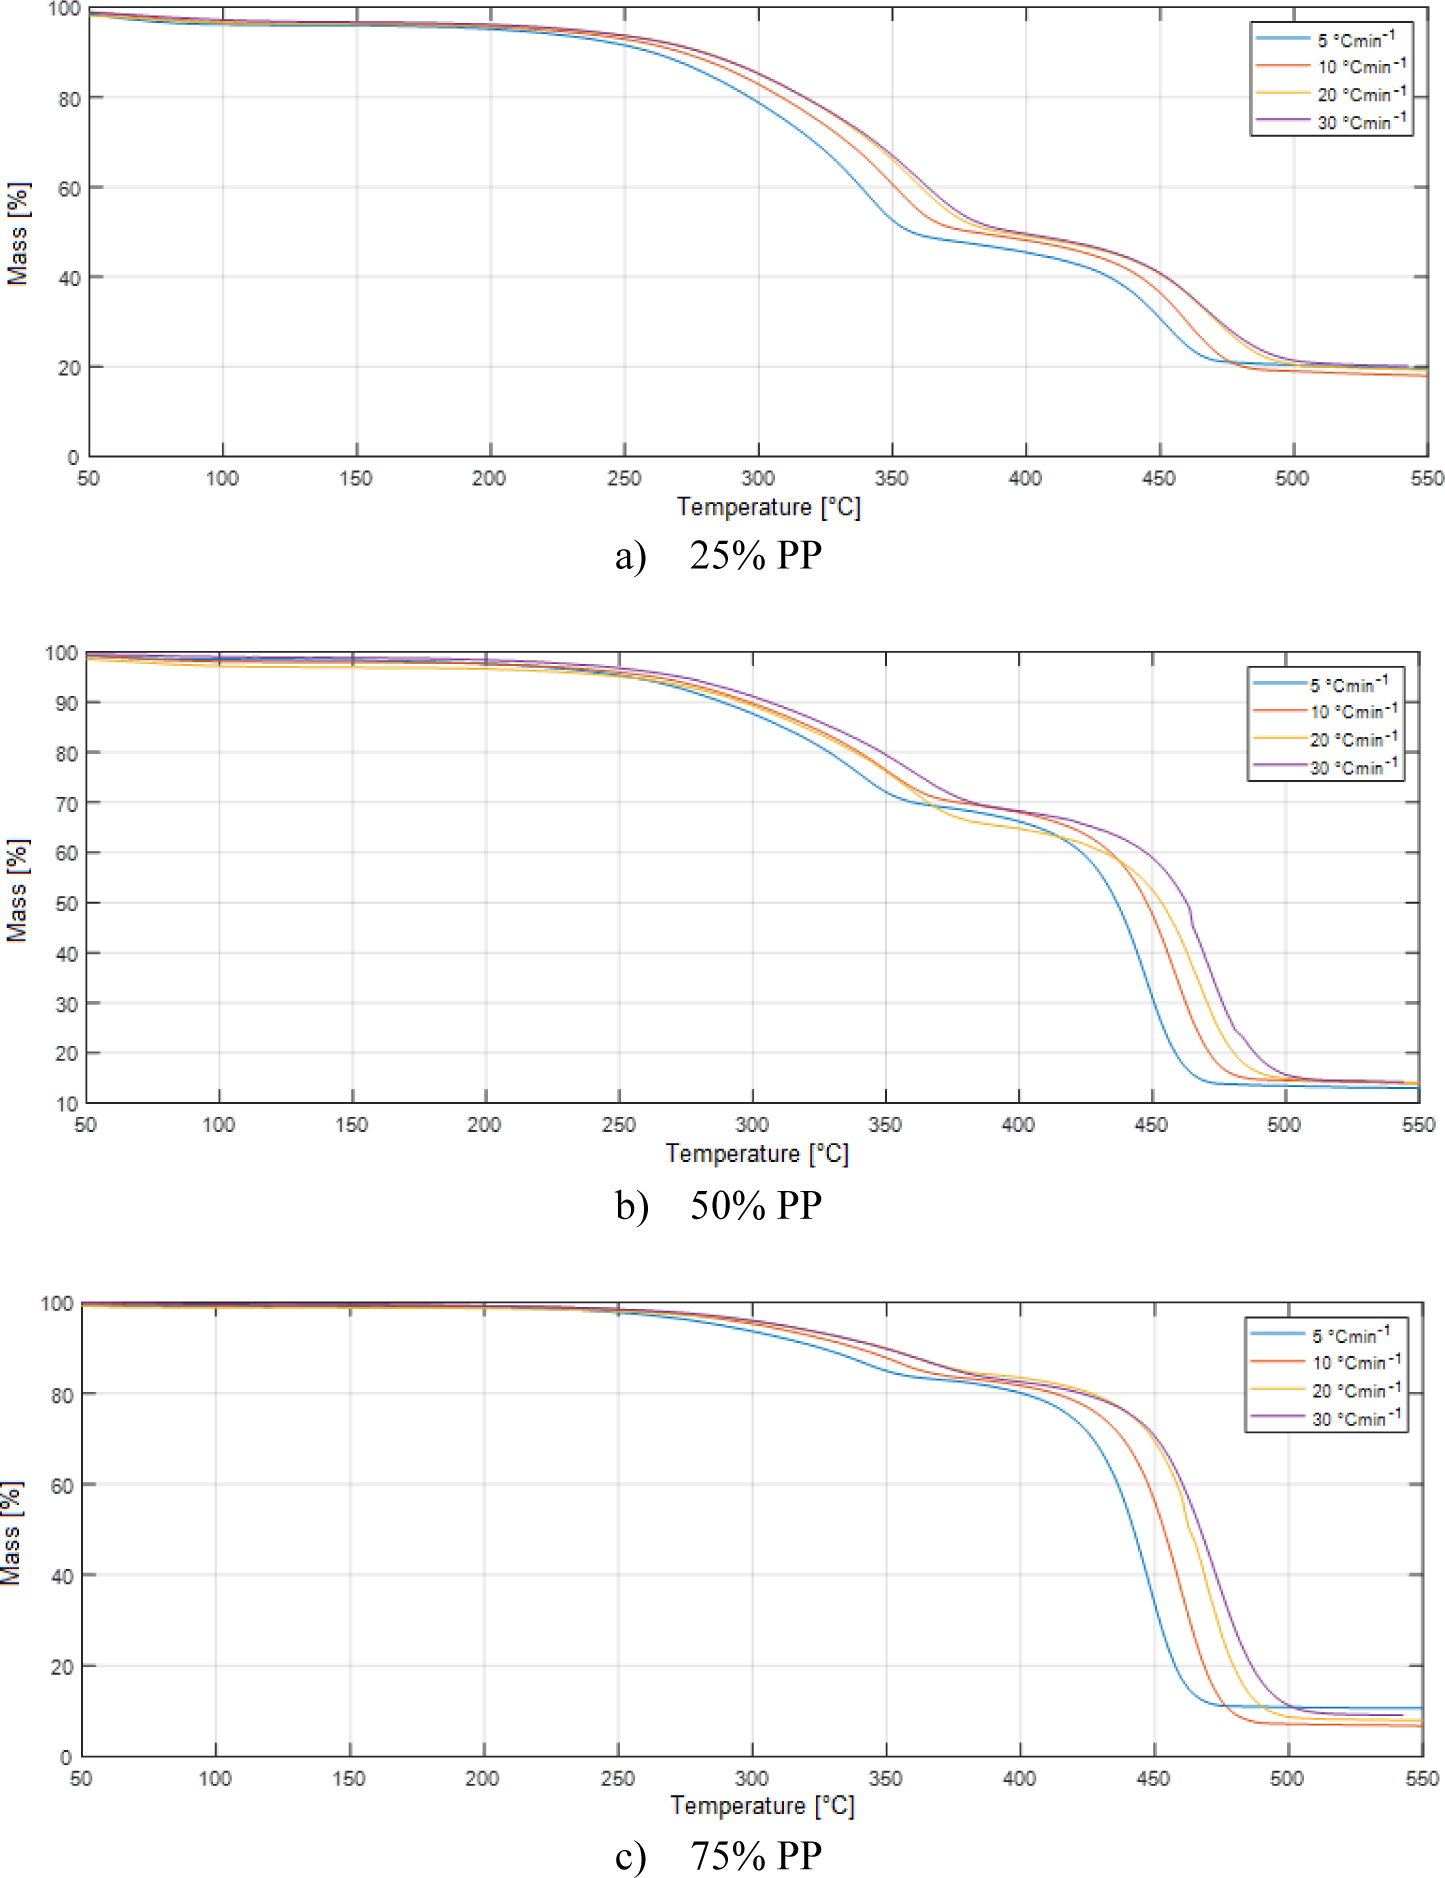
The thermal degradation of mixtures is presented in Figure 2 and Figure 3. It is observed from TG curves that the samples with 25% and 50% plastic content express two stages of degradation. The first stage, up to 400 °C, is primarily due to the decomposition of the biomass component, while the second stage represents plastic decomposition. Besides, for the mixtures with 25% plastics, it can be noted a small evaporation step below 100 °C accounted for less than 5% mass loss. The influence of the heating rate on this first stage is just slightly visible for investigated mixtures of both plastic materials. In the case of PP (Figure 3), increment of heating rates shifted the temperatures of the first peaks for approximately 5 °C with each increment of the rate, from 345 °C for 5 °C/min to 355 °C for 20 °C/min and 30 °C/min. Similar behaviour is also noted for PS (Figure 2), with the same positions as the first peaks. It implies that at this temperature range, only sawdust is decomposed.
TG curves from sawdust and PS mixture pyrolysis: 25% PS (a), 50% PS (b), and 75% PS (c)
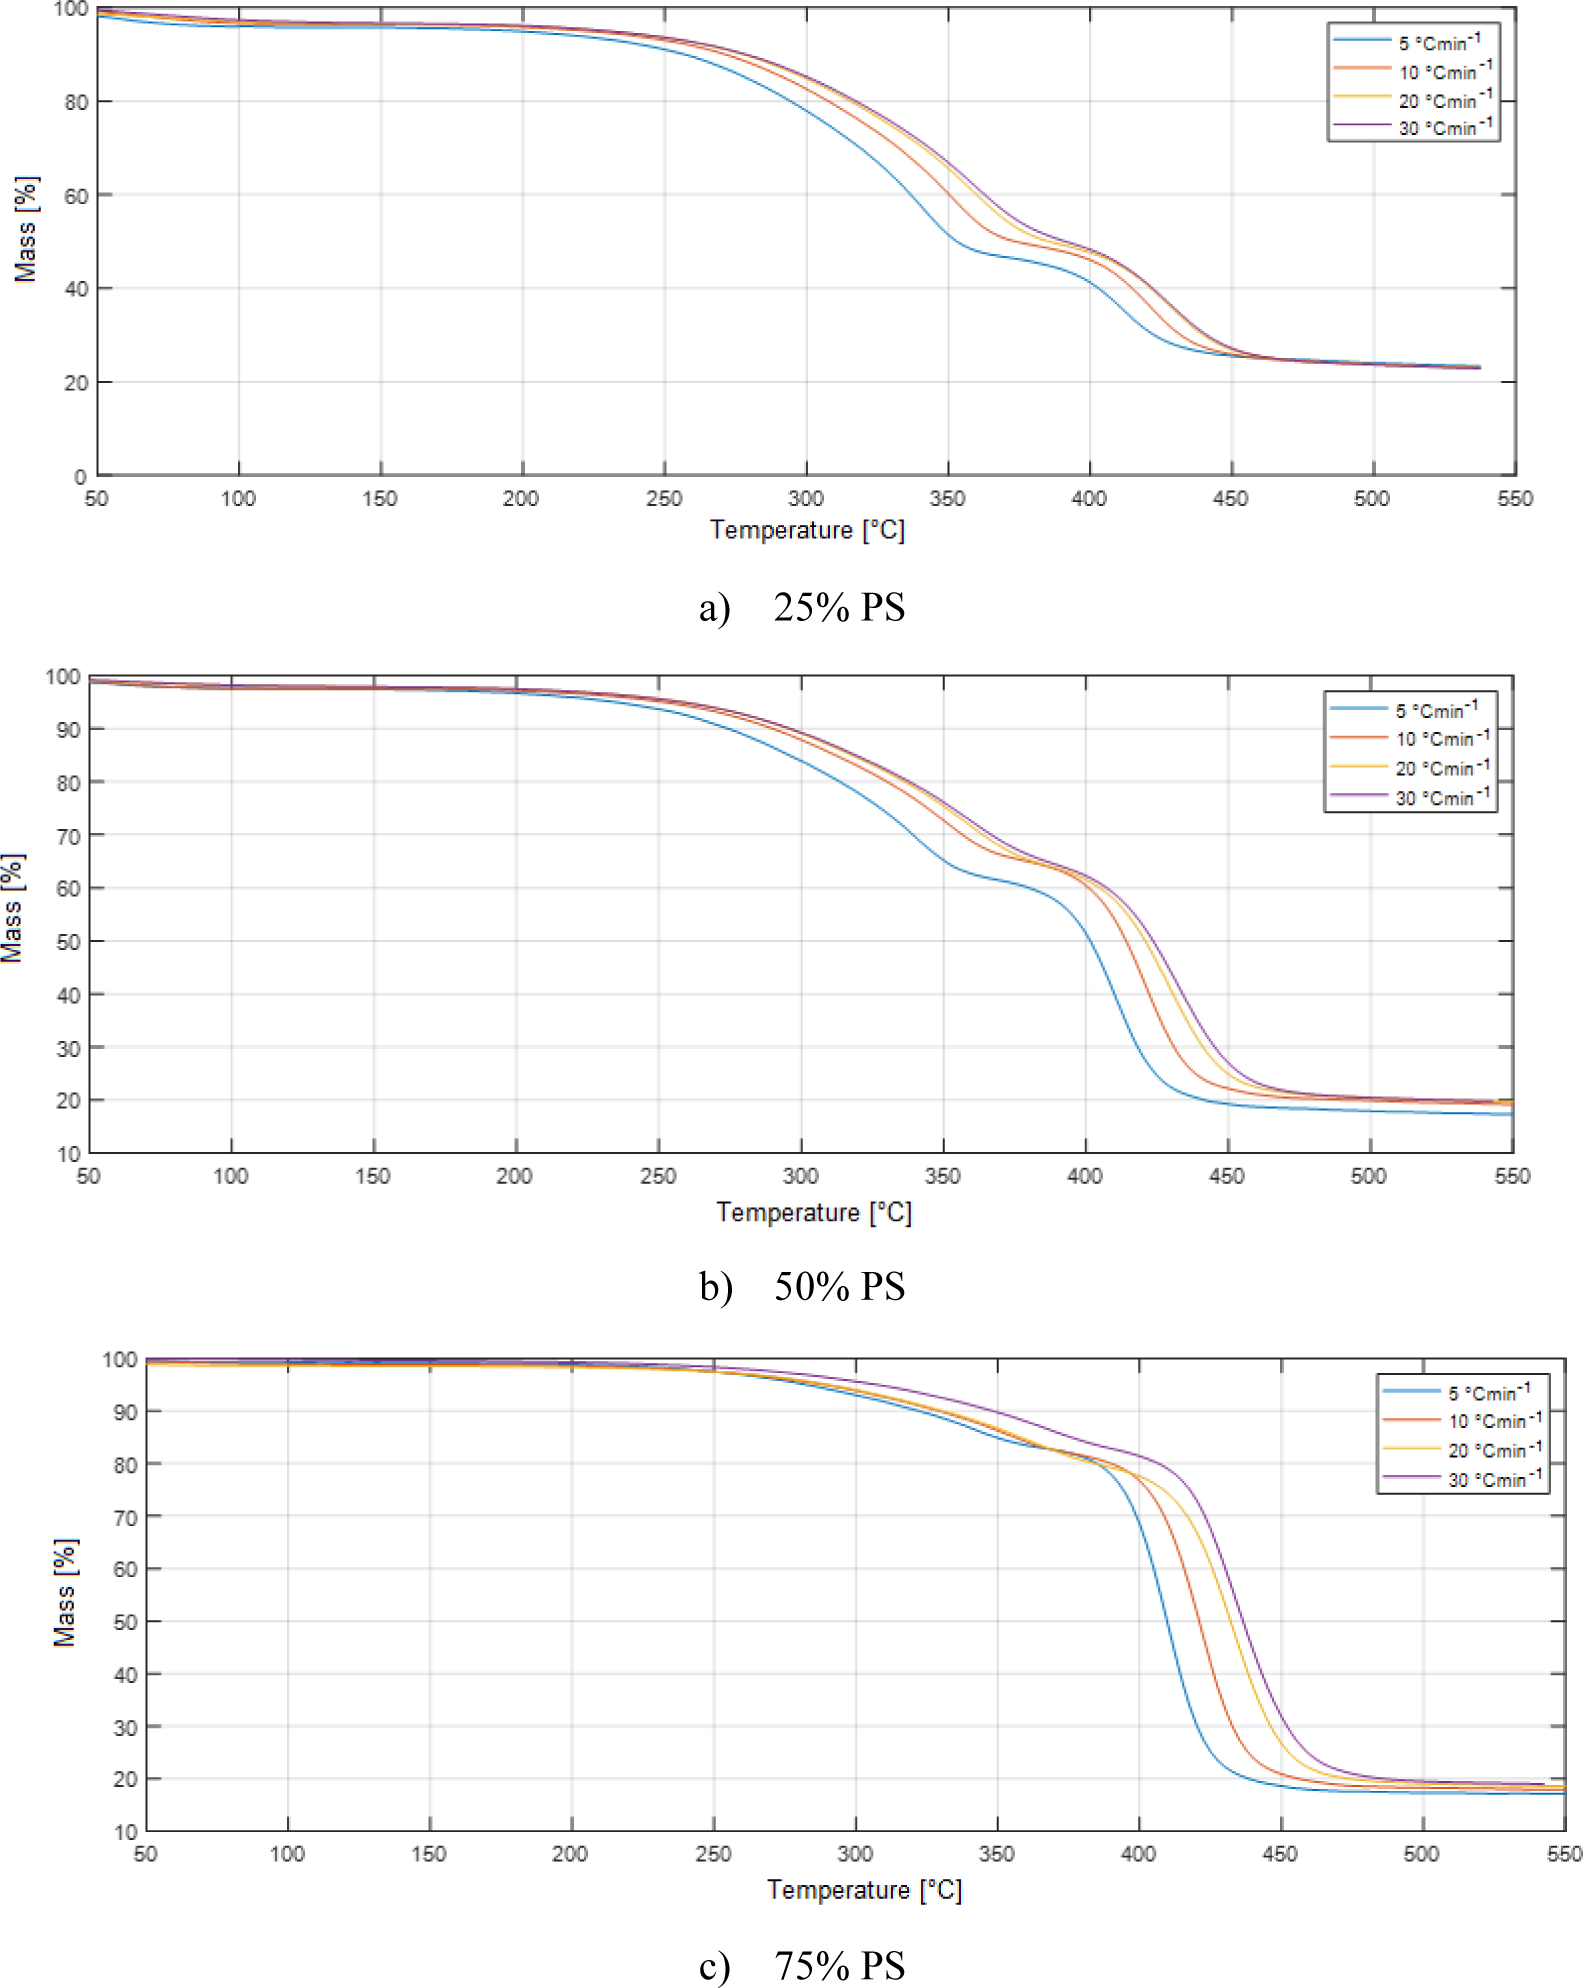
It should be noted that the increment of plastic content greatly reduces the intensity of the first peak. Even though this is expected, the reduction is quite pronounced for the mixtures with an equal share of both feedstocks, suggesting that plastics may hinder the complete sawdust decomposition in the first stage. This phenomenon was already reported by Han et al. and here confirmed for both investigated plastics [9]. It might directly affect the final product yield and distribution in the pyrolysis process but should be examined more. The end of the first stage is at about 375 °C for the case of 5 °C/min and 10 °C/min, while for higher heating rates of 20 °C/min and 30 °C/min, the end temperature is increased to 390 °C. As expected, the mixtures where sawdust is the main compound have a higher mass loss, almost half of the sample mass, in this first stage due to the decomposition of cellulose and hemicellulose. As the share of the plastic fraction increases, the mass loss decreases. Therefore, for the mixtures with an equal share of both feedstocks, the remaining masses at the end of the first stages are between 70-75%. Further increment of plastic content to 75% of the mixture composition reduces mass loss even more, and the remaining mass is up to 80%.
TG curves from sawdust and PP mixture pyrolysis: 25% PP (a), 50% PP (b), and 75% PP (c)
Importantly, the heating rate has a limited influence on mass loss in the first stage. A slow heating rate of 5°C/min ensures better heat transfer and release of volatiles. Therefore, the mass losses are more pronounced in this case. Nevertheless, the differences between the slowest and fastest heating rates are less than 10% in sample mass. Finally, it can be stated that the decomposition mechanism of the first stage is more influenced by the mixture composition rather than the heating rate [19]. The TG and DTG curves show that fast-heating rates of 20 °C/min and 30 °C/min express almost identical behaviour. The only visible stand-out is noted for 5 °C/min, even though this influence disappears as the share of plastics increases.
The second stage follows up immediately after the completion of the first one. In the case of PP-derived mixtures, the lag between the two stages of degradation is slightly more pronounced, especially for the mixture with 25% PP (plateau in Figure 3a). The second stage almost overlaps with the first one for PS-containing mixtures, which can be expected since the onset temperature for individual PS degradation is 375 °C. Consequently, the second peak corresponding to plastic decomposition appears in the case of PS earlier than PP. The main degradation step of the second stage for PS-containing mixtures occurs between 420 °C and 430 °C and increases with the increment of the heating rate. The sawdust has a limited influence on the position of the second peak since it is just slightly shifted to higher temperatures compared to individual PS analysis. The end of the second stage is slightly above 450 °C, like individual PS decomposition, confirming the limited influence of SD on the second stage.
Nevertheless, the influence of the mixture composition is a crucial parameter for the final mass. A mixture with 25% PS has a quite high final mass of residue, which accounts for 25% of the initial mass. It is even higher than the results from individual SD analysis, where approximately 20% of the final mass was observed. Further increment of the PS reduces the final mass below 20%, with only minor differences observed between applied heating rates. Generally, the heating rate has a moderate influence on the second stage of degradation. While the impact on final mass is almost negligible, the second peak's intensity and position depend highly on this parameter. An increment of the heating rate shifts the peak positions and end temperatures to higher values, broadening the range in which decomposition occurs. Besides, the degradation intensity is considerably higher with high heating rates, suggesting that most volatiles are released in the narrow temperature range shortly before the process is completed. Due to that, the residence time of volatiles released in the second stage is reduced, which might benefit the yield of condensable products obtained as bio-oil [22].
For the PP-containing mixtures, the second peak's position corresponds to the peak from individual PP decomposition. There are no visible differences among the investigated mixtures, which means that PP decomposition dominates in this stage. It is also supported by the fact that the mixtures with a higher portion of PP have a broader range in which decomposition occurs, similar to individual analysis. Nevertheless, there are pronounced differences in terms of applied heating rates. An increment of heating rate firstly shifts the temperature of the second peak to higher values but also broadens the range in which decomposition takes place. This difference between the slowest and fastest applied heating rate can be up to 40 °C in terms of ending temperature. Since both investigated parameters, heating rate and mixture composition, have a notable impact on the second stage, the differences between final masses are more pronounced. The mixture with 25% sawdust has a final residue of 20%, similar to individual SD. It is further reduced by incrementing plastic content to 15% and 10%, respectively. Interestingly, in the case of a mixture with 75% PP, the lowest final mass (5%) is noted for the heating rates of 10 °C/min and 20 °C/min, while almost 10% is observed for 5 °C/min.
Table 2 summarises the final mass values for all investigated samples and applied heating rates. Interestingly, only the mixture with 25% PS yields a higher final mass of residue than individual sample analysis. It implies that the synergistic effect could be very strong for this mixture and that feedstock interaction hinders the complete release of volatiles. The influence of heating rates on final mass residue is less pronounced than that of the mixture composition.
Final mass of solid residues from individual and mixture pyrolysis at applied heating rates
| Heating rate [°C/min] | 5 | 10 | 20 | 30 | |
|---|---|---|---|---|---|
| Final mass [%] | Sawdust | 19.6 | 20.6 | 20.7 | - |
| 25% PP | 19.5 | 18.0 | 19.2 | 20.1 | |
| 50% PP | 12.9 | 13.9 | 14.0 | 14.2 | |
| 75% PP | 10.6 | 6.8 | 8.0 | 9.1 | |
| PP | 2.6 | 2.7 | 2.5 | 2.5 | |
| 25% PS | 23.4 | 22.9 | 22.9 | 22.9 | |
| 50% PS | 17.3 | 19.1 | 19.7 | 19.8 | |
| 75% PS | 17.1 | 17.9 | 18.6 | 19.0 | |
| PS | 15.4 | 15.0 | 14.9 | 15.1 |
The activation energy (Ea) was calculated using the model-free isoconversional Friedman, Kissinger-Akahira-Sonuse, and Ozawa-Flynn-Wall methods. Obtained values show excellent statistical correspondence by observing the statistical R2 factor (> 0.877) for the range of conversion between α = 0.1-0.9. The obtained activation energies below and above these points show bigger discrepancies and lower statistical agreement, as already reported in the literature [8]. Only minor differences are observed between the methods used (Figure 4). The results are plotted in separate figures for each method.
Calculated activation energies for individual samples and respective mixtures for investigated samples: PS (a), (c) and (e), and PP (b), (d) and (f)
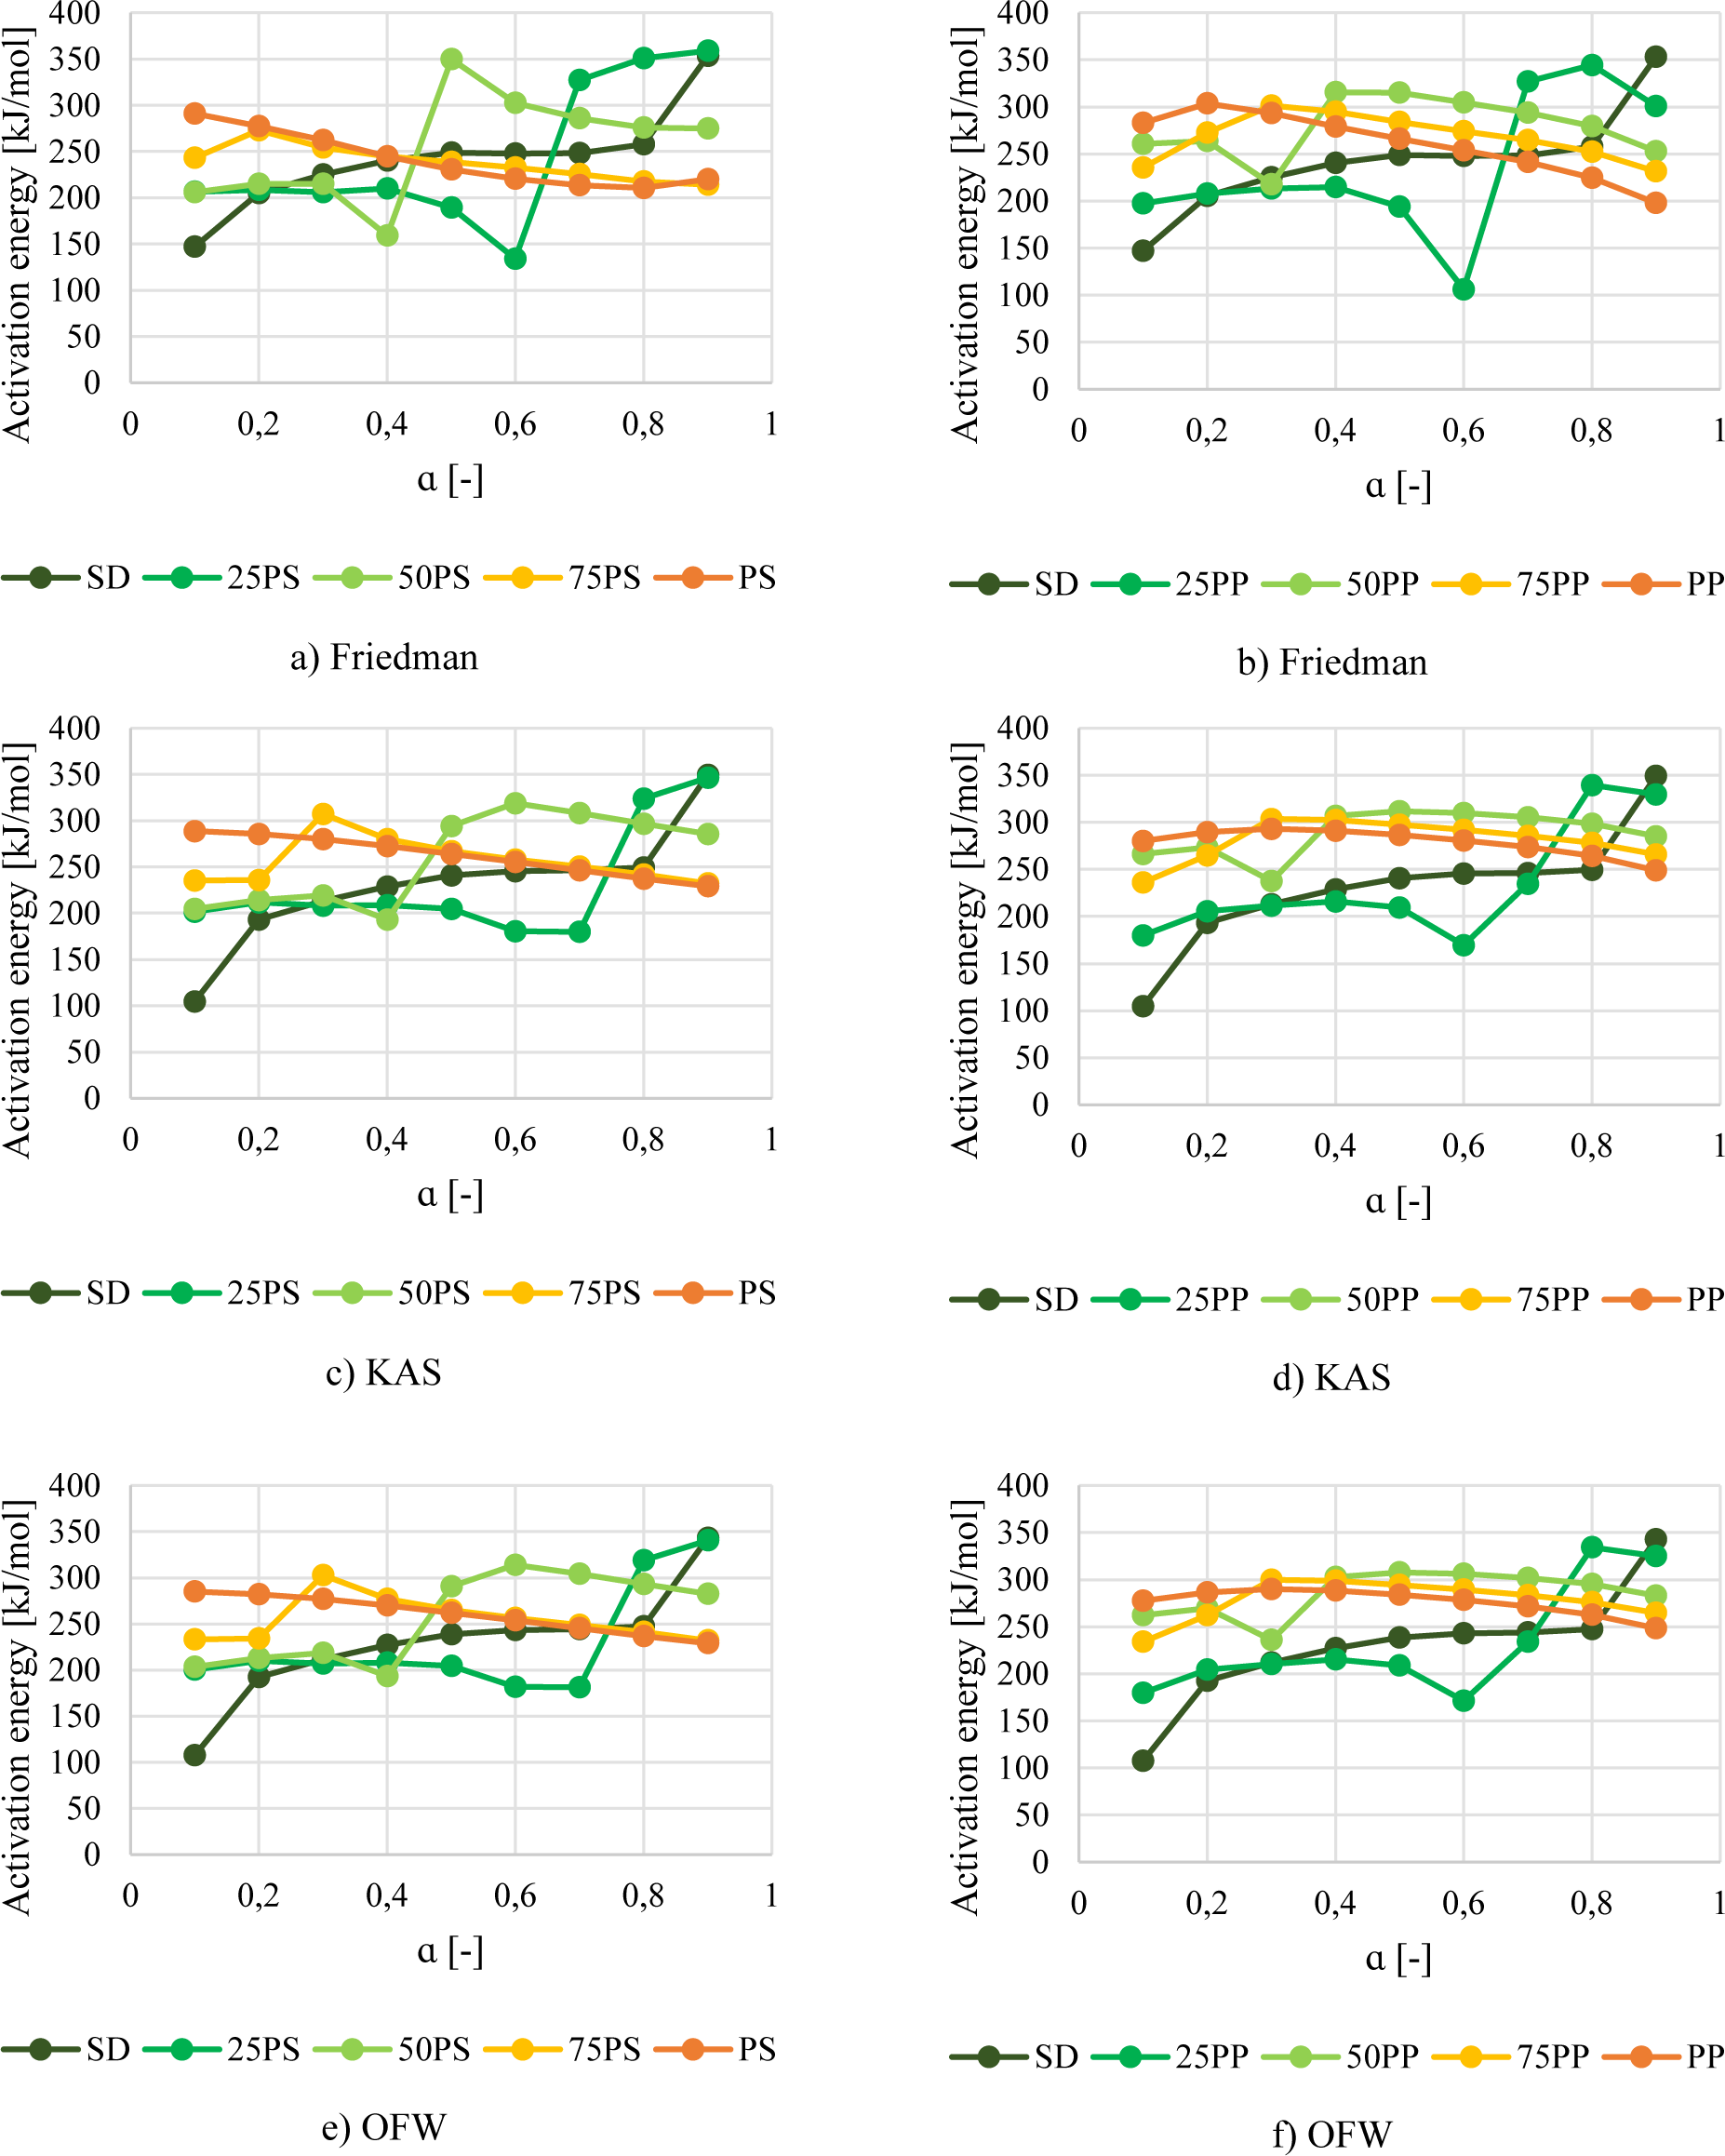
For individual samples, the activation energies follow the same pathway for the whole range of conversion (α = 0.1-0.9). In the case of PS, the activation energies are around 290 kJ/mol at α = 0.1 for all used methods. As the decomposition proceeds, the values of activation energies decrease, following the linear pathway until the end of the process. Friedman's method gives the activation energy of 220 kJ/mol at α = 0.9, while 229 kJ/mol is obtained for the other methods. It should be noted that the reported values and trends are entirely different and reversed here compared to a study by Ozsin et al. [23]. We have found significantly higher values in this work, which might explain why the final mass was notably higher here. Activation energies of PP show slightly lower values at α = 0.1, being 283, 280, and 277 kJ/mol for Friedman, KAS, and OFW methods. As the decomposition continues, a minor increase of 10 kJ/mol is noted for KAS and OFW at α = 0.3, starting with a linear decrease until the end of the process. Final activation energy values at α = 0.9 show more significant discrepancies between the methods used. For Friedman's method, 198 kJ/mol is calculated, while KAS and OFW give pronouncedly higher values of 248 kJ/mol. Once again, values reported in this work are greatly higher than those found by Han et al. [9], and the trend is also reversed. Here, the Ea is high at the beginning of the process and decreases as the conversion proceeds, while in the case of work carried out by Han et al., the values are constantly increasing throughout the process. Sawdust was analysed in previous work, but it should be mentioned that activation energies can be divided into three stages. The first one is between conversion rates 0.1 and 0.2, with a steep increment from 150 to 200 kJ/mol. The second stage expresses a linear increase from 200 to 250 kJ/mol for α = 0.2-0.8. This stage is known as the active pyrolysis range, where cellulose and hemicellulose decompose. The steep increase is again noted in the last stage, with a final value of 350 kJ/mol at α = 0.9. This steep increase in the last stage for the SD can be expected since most of the sample is already decomposed here. In the case of plastics, this phenomenon is not observed since the final residue of plastic is occasionally below 5% of initial mass, which means that decomposition happens in a broader conversion range and is usually done at this last stage. Literature reported that mean values for sawdust Ea differ, but the most often are below 200 kJ/mol [24]. This value is pronouncedly lower in comparison with polyethylene (PE), polystyrene (PS), or polypropylene (PP), where mean values are about 250 kJ/mol [25]. Table 3 shows that mean activation energies for PS and PP used in this work are close to values reported in the literature with a notable coefficient of determination (R2).
Activation energy Ea [kJ/kmol] and respective statistical agreement R2 for investigated samples
| Method | Friedman | KAS | OFW | |||
|---|---|---|---|---|---|---|
| Ea | R2 | Ea | R2 | Ea | R2 | |
| Sawdust | 241.8 | 0.963 | 229.3 | 0.949 | 227.5 | 0.959 |
| 25% PP | 230.6 | 0.887 | 228.0 | 0.973 | 226.8 | 0.887 |
| 50% PP | 274.4 | 0.947 | 285.1 | 0.943 | 281.7 | 0.946 |
| 75% PP | 264.1 | 0.965 | 278.4 | 0.958 | 275.7 | 0.995 |
| PP | 259.2 | 0.988 | 276.8 | 0.985 | 274.5 | 0.986 |
| 25% PS | 238.1 | 0.914 | 228.7 | 0.899 | 227.2 | 0.906 |
| 50% PS | 253.2 | 0.917 | 254.9 | 0.907 | 252.5 | 0.914 |
| 75% PS | 235.8 | 0.938 | 254.9 | 0.944 | 253.0 | 0.946 |
| PS | 239.9 | 0.995 | 254.5 | 0.993 | 252.7 | 0.994 |
Analysis of activation energies of investigated mixtures is important to identify their decomposition mechanism, which can later be used in the modelling procedure. As can be seen, the activation energies are strongly dependent on mixture composition. In addition, similar to individual sample analysis, the activation energies of all investigated mixtures show slight differences between Friedman's and the other two methods, where values are almost identical.
For the mixtures where SD is the dominant compound, a slight increase of activation energies in the first stage (α = 0.4) can be observed, like individual SD. In the case of a 25% PS mixture, the activation energy at α = 0.1 is 200 kJ/mol, which is only slightly increased to 210 kJ/mol at α = 0.4. The values are similar for the methods used. On the other hand, for the mixture with 25% PP at α = 0.1, Friedman's method gives 200 kJ/mol, while KAS and OFW values are around 180 kJ/mol. Since the sawdust decomposition is happening at the beginning of the process, and the values from Friedman's method correspond to those obtained for PS mixtures, it is evident that KAS and OFW underestimate activation energies for the mixture with 25% PP.
The second stage for this mixture can be observed between the conversion range of 0.4 and 0.6. In this range, activation energies continuously decrease, but the differences between the methods are more pronounced. Friedman's method shows greatly lower values at α = 0.6 for the mixture with 25% PS 134 kJ/mol, while 106 kJ/mol is noted for 25% PP. The KAS and OFW values are 180 kJ/mol and 170 kJ/mol for mixtures with 25% PS and PP, respectively. A sharp increase is noted until α = 0.8, indicating the changes in the decomposition mechanism. At this stage, activation energies are higher compared to individual samples, which might imply that sawdust and plastic decomposition interfere. Friedman's method slightly overestimates the Ea for the mixture with 25% PS. Values between 320 kJ/mol and 340 kJ/mol are obtained for all other mixtures. The activation energy slightly increases for the mixture with 25% PS until the end of the process, while a minor reduction occurs for the mixture with 25% PP.
The equal share of sawdust and plastic compounds reflects an equal division between the conversion ranges. For the PS/SD mixtures, the first stage is between conversion rates 0.1 and 0.4, where a more-less constant value of activation energies (t215 kJ/mol) is observed, with a smooth decrease to 193 kJ/mol at the end. This reduction is more pronounced in the case of Friedman's method. A steep increment can be seen between conversion rates 0.4 and 0.5, indicating the decomposition mechanism shifts from sawdust to PS component. This change in mechanism shows more uncertainties for the Friedman method compared to KAS and OFW. The second stage of decomposition occurs in the range 0.5 < α < 0.9, where activation energy slowly decreases to final values of 275 kJ/mol and 285 kJ/mol for Friedman and the other two methods, respectively.
A mixture with an equal share of polypropylene and sawdust shows interesting results in terms of decomposition stages. The first stage, related to sawdust decomposition, goes until α = 0.3, which is quite a short range compared to one attributed to PP decomposition. Here, the activation energy decreases from a starting value of about 260 kJ/mol to 236 kJ/mol for KAS and OFW methods and slightly lower 218 kJ/mol for Friedman's. A sharp jump to almost 310 kJ/mol follows at α = 0.4. The second stage, which accounts for PP decomposition, shows a decreasing trend of activation energies. Friedman's method gives 253 kJ/mol as the final value, while slightly higher values (/285 kJ/mol) are noted for the KAS and OFW methods.
The obtained values for the second stage's activation energies are pronouncedly higher than individual PS and PP decomposition; this suggests that proceeding sawdust decomposition significantly influences the degradation of plastic components afterwards. It is an important observation related to pyrolysis since it shows notable volatile interactions inside the reactor. Finally, a mixture with dominant plastic compounds expresses almost the same behaviour as the individual plastic samples. Only discontinuity is seen at the beginning of the degradation until α = 0.3, where values sharply rise from 234 to 307 kJ/mol for both types of plastic feedstock. After this, the activation energies almost overlap until the α = 0.9. For both PS and PP, the final value of activation energy is around 230 kJ/mol. Friedman's method underestimates the final activation energy compared to KAS and OFW methods for 20 kJ/mol and 30 kJ/mol for PS and PP, respectively.
Results given in Table 3 represent the mean activation energy for all investigated samples and used methods. Since the mixtures have two decomposition mechanisms, they can only be used as orientational values. From the results, it is interesting that mixtures with an equal share of both feedstocks express the highest values. It could mean that mixture heterogeneity, most visible here, greatly impacts the required energy to decompose samples.
Apparent Friedman's activation energies are used to calculate the pre-exponential factors and thermodynamic parameters. A similar analysis was not found in the literature; therefore, the results cannot be compared. Figure 5a and Figure 5b plotted calculated values of Ea from the Friedman method at 10 °C/min. Usage of this heating rate for thermodynamic calculations reduces the impact of constituent interaction that increases with the increment of the heating rate. Since the extensive analysis of activation energies is given in the previous chapter, it will not be discussed further here.
Kinetic parameters for analysed samples: activation energy (a) and (b), and pre-exponential factors (c) and (d)
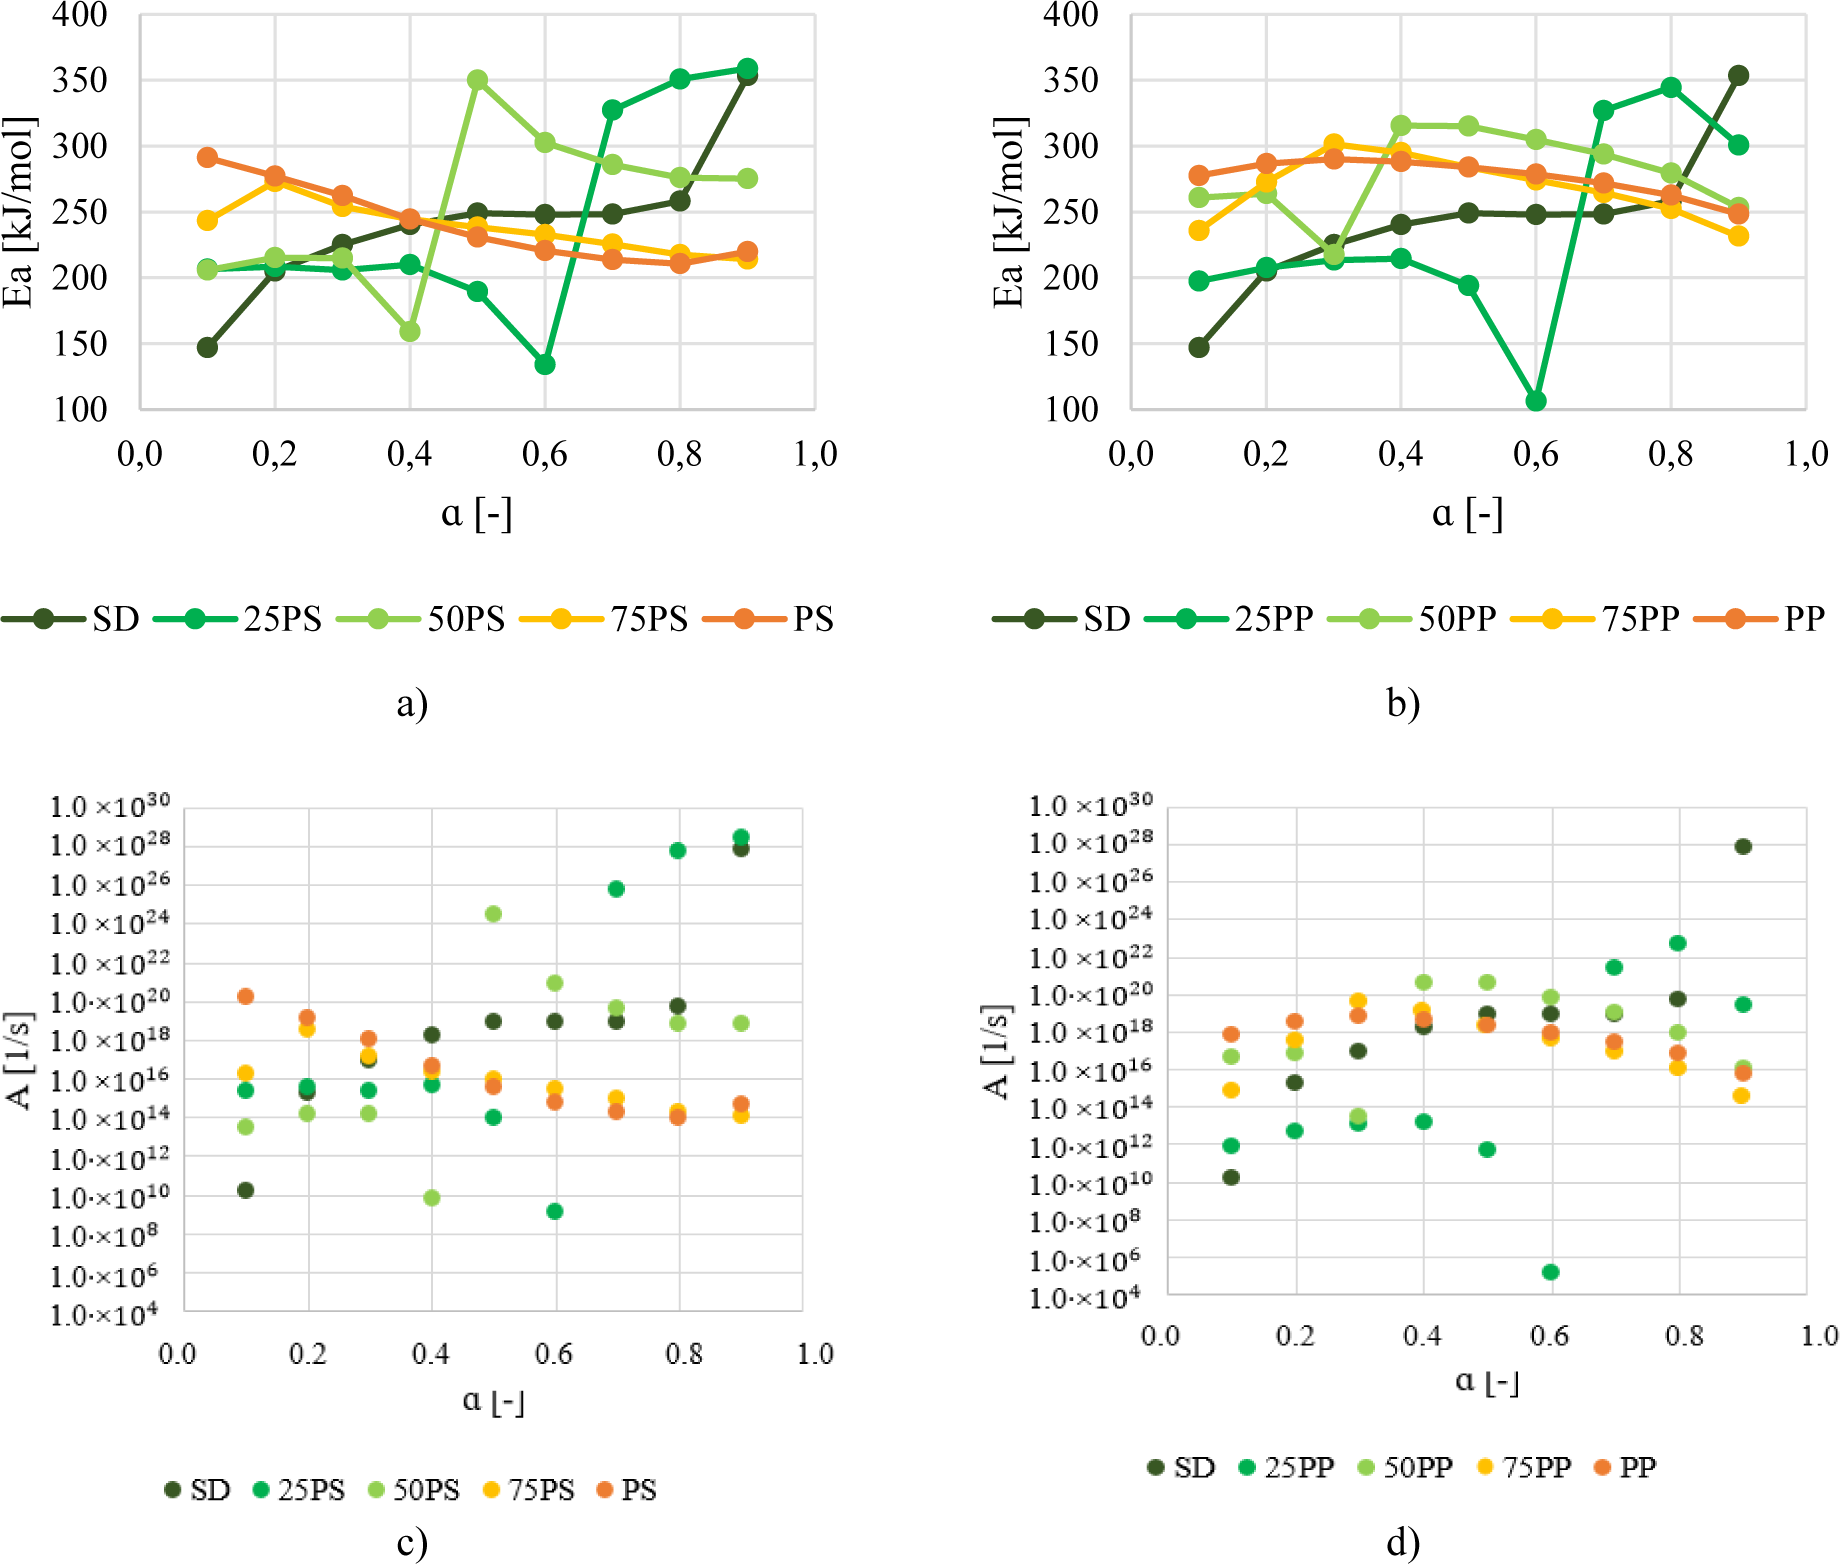
The pre-exponential factor was calculated based on Friedman's method and with the general assumption that a conversion function considers reaction order equals 1 [9]. In general, for all investigated samples, they are above 1010 1/s immediately after α = 0.1. For the sawdust sample, these values are remarkably high (1013< A <1027) and are increasing as the conversion proceeds in the range of 0.1< α <0.9.
A complete reversal trend is observed for plastic materials. For both plastic samples, the pre-exponential factor is high at the beginning of conversion (1.8×10²⁰ 1/s and 7.6×10¹⁷ 1/s for PS and PP, respectively) and, after that, gradually decreases (Figures 5c and 5d). It implies that samples are highly reactive at the beginning of the decomposition, but this characteristic fades away as the conversion intensifies. The values of pre-exponential factors greatly vary for PS-containing mixtures, especially for 25% and 50% of PS mixtures. Steep increments are observed at conversion ranges 0.6 and 0.4 for mixtures with 25% and 50% of PS, respectively, suggesting the change of decomposition mechanism already reported above. This observation also applies to the changes in enthalpy and entropy, which will be discussed later.
In the second stage of decomposition, values of pre-exponential factors are further increased. It implies frequent collision between volatiles released from SD decomposition in the previous step and PS in this stage. In the case of a mixture with 25% PP, the first stage and mechanism change are quite similar to the counterpart with PS, with slightly lower values. Lower values of pre-exponential factors mean that PP notably hinders sawdust decomposition, probably due to plastics softening. It is even more evident from the mixture with 50% PP, where pre-exponential values follow the trend of the individual PP sample. Observed values of the pre-exponential factor for the second stage are lower in the case of PP-containing mixtures compared to PS ones, suggesting the lower reactivity of PP.
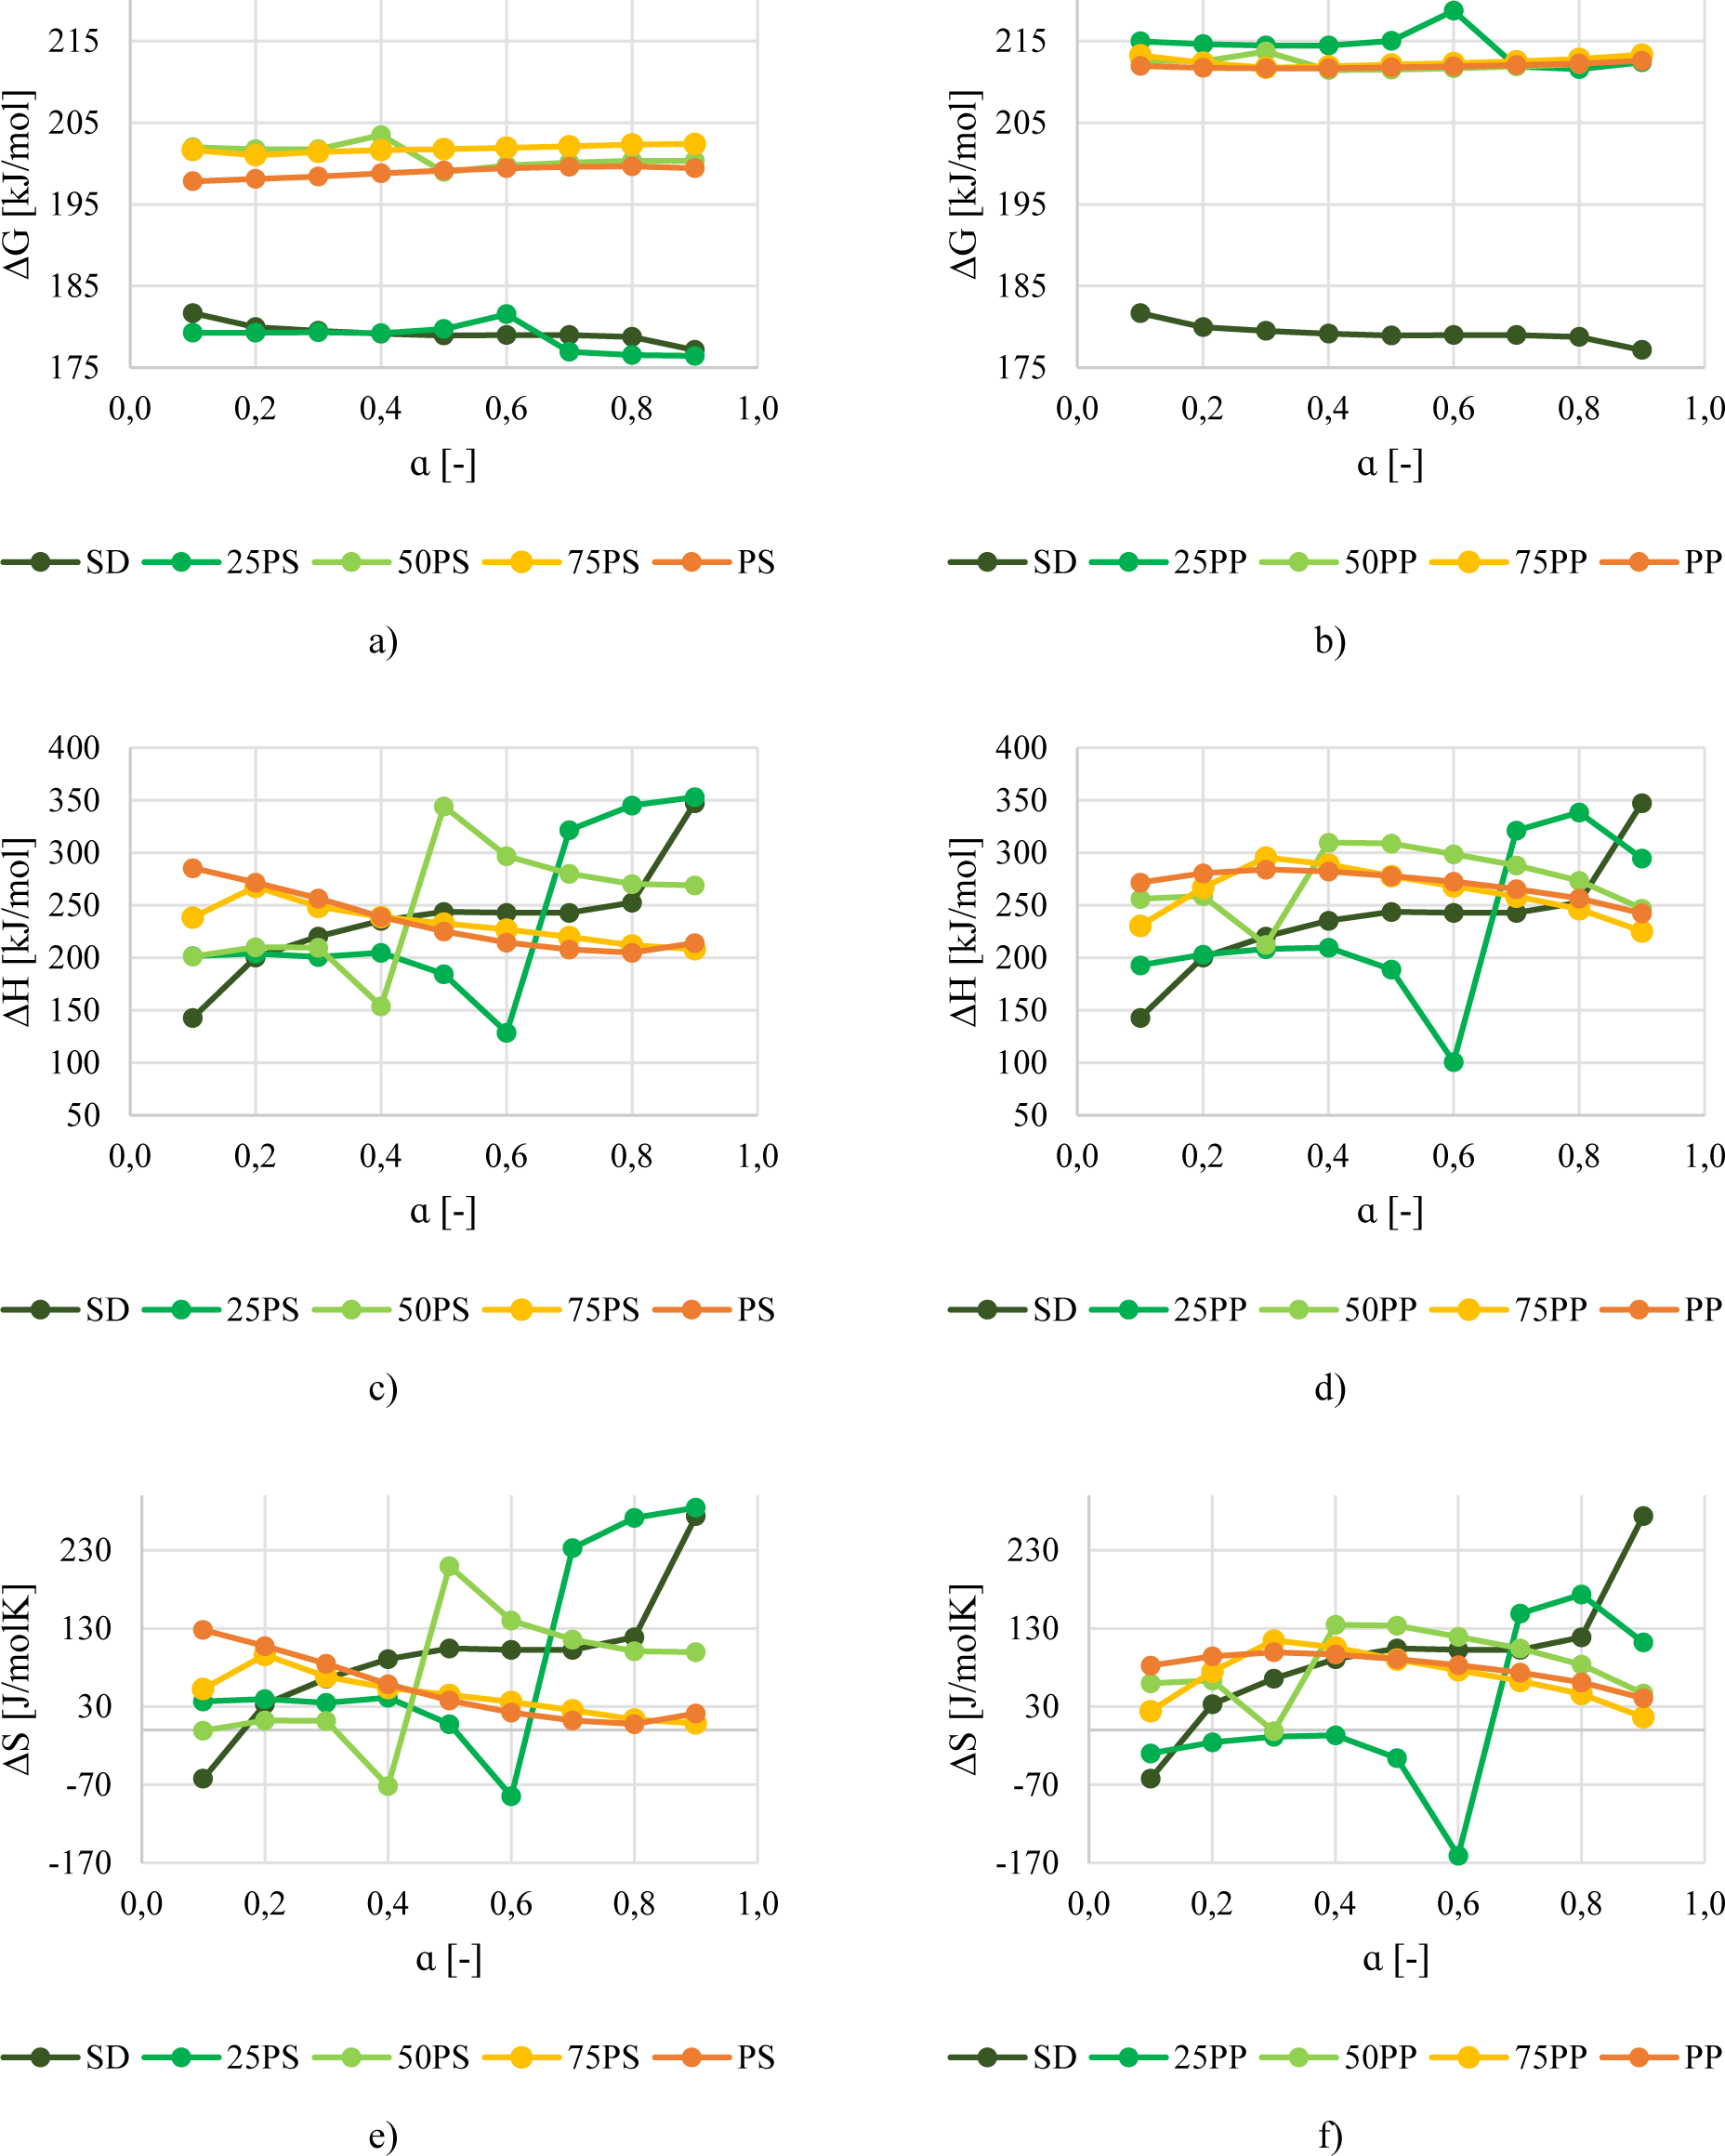
The changes in Gibbs energy are almost negligible throughout the process (Figures 6a and 6b). It is only interesting to see that the values for the mixture with 25% PS are similar to individual SD decomposition. On the other hand, the values for the mixture with 25% PP are more like individual PP decomposition. It again confirms the hypothesis that PP significantly impacts sawdust decomposition since even a small presence greatly influences the process.
The changes in enthalpy and entropy are firmly following the activation energy trendline. This trend is expected since activation energy and enthalpy changes have the same meaning, representing the amount of energy that needs to be brought to the system to initiate chemical reactions. Therefore, from a thermodynamic perspective, it can be stated that introducing a small plastic fraction (up to 25%) reduced the required energy to support the sawdust decomposition. Nevertheless, it causes a tremendous increase in energy needed for the second stage of decomposition, visible in Figures 6c and 6d. A mixture with an equal share of SD and PS follows a similar trendline as a mixture with 25% of PS until the changes in the decomposition mechanism. In this case, an even greater amount of energy is required to initiate plastic fraction decomposition. Even though once initiated, the reactions require less energy and enthalpy changes are decreased, like individual PS.
The opposite is noticed for the mixture with an equal share of SD and PP. Here, the presence of PP immediately raises the required energy to initiate the mixture decomposition. Nevertheless, in the case of PP-containing mixtures, its presence did not affect the second stage of the process that much. Obtained changes in enthalpy are higher than individual PP, but their differences are visibly lower compared to PS-containing mixtures.
Changes in entropy give information about the level of order inside the system. Higher entropy also implies higher reactivity of the system. As expected, the highest level of disorder for analysed mixtures occurs after the change of decomposition mechanism (Figures 6e and 6f). Therefore, it can be stated that interaction between biomass and plastic-derived compounds can only happen in the second stage of decomposition. In this stage, temperatures are sufficient to initiate plastic decomposition and support the complete decomposition of the solid and volatile products obtained in the previous step.
Finally, the results for mixtures containing 75% PS or 75% PP were not discussed because values strongly correlate with the values from the individual sample analysis. The only valuable observation is related to reduced values of all investigated parameters at the beginning of the process. It means that a small portion of biomass can slightly lower the energy consumption at the beginning of the process. Still, the process will be governed by a plastic decomposition mechanism.
Thermodynamic parameters for analysed samples: Gibbs free energy (a) and (b), changes in enthalpy (c) and (d), and changes in entropy (e) and (f)
Carried out work that consisted of thermogravimetric, kinetic, and thermodynamic analysis shows some interesting results and valuable inputs for experimental and computational modelling of the co-pyrolysis process.
The heating rate has a limited impact on process kinetics in that the increment of the heating rate slightly shifts the observed temperatures to higher values. The impact on the final mass of residue is almost negligible since the differences are less than 3%.
The mixture's composition greatly influences the final mass residue, which decreases with the increment of plastic content. Furthermore, the mixture composition plays a crucial role in the decomposition mechanism and, consequently, the kinetic and thermodynamic parameters. First of all, the share of each component determines the conversion range at which changes in the decomposition mechanism occur. Secondly, a low portion of sawdust decreases the mean activation energies of the process, while a high share of plastic fraction closes the values to individual plastic samples. Finally, the highest values of activation energies are noted for the mixture with an equal share of both feedstocks, indicating that the mixture's heterogeneity is an important issue.
For the mixtures with equal shares of both components, polypropylene leads the decomposition mechanism almost through the entire conversion range, while polystyrene follows the sawdust mechanism. It implies that PP can soften and hinder the SD decomposition in the first stage, consequently interfering with heat and mass transfer.
From the perspective of synergistic effect, it can be stated that the mutual interaction of feedstock hinders the complete release of volatiles from the first stage, resulting in a tremendous increase in activation energy in the second stage. However, the detailed analysis of the synergistic effect and how the feedstock mutually interacts requires more in-depth investigation where results from kinetic analysis are coupled with product yield and distribution.
Finally, for future work, it is recommended to couple the results from kinetic analysis with laboratory investigation and product characterisation, which would give a comprehensive overview of how the feedstock interacts and, even more importantly, how this interaction reflects on the final product quantity and quality. Especially critical seems to be the part where the decomposition mechanism switches from biomass to plastic constituent. This shifting results in a tremendous increase in activation energy, suggesting that the complete release of volatiles from the first stage was hindered. It could reduce the reaction time needed for complete devolatilisation of the prepared mixture and result in lower overall product quality.
- ,
Global Plastics Outlook , 2022, https://doi.org/https://doi.org/10.1787/DE747AEF-EN - ,
A review on alternative fuels in future energy system ,Renewable and Sustainable Energy Reviews , Vol. 128 , 2020, https://doi.org/https://doi.org/10.1016/j.rser.2020.109927 - ,
A review on advanced catalytic co-pyrolysis of biomass and hydrogen-rich feedstock: Insights into synergistic effect, catalyst development and reaction mechanism ,Bioresource Technology , Vol. 310 , 2020, https://doi.org/https://doi.org/10.1016/j.biortech.2020.123457 - ,
Co-pyrolysis of waste plastic and solid biomass for synergistic production of biofuels and chemicals-A review ,Progress in Energy and Combustion Science , Vol. 84 , 2021, https://doi.org/https://doi.org/10.1016/j.pecs.2020.100899 - ,
Biomass pyrolysis: A review of the process development and challenges from initial researches up to the commercialisation stage , Vol. 39 , 2019, https://doi.org/https://doi.org/10.1016/j.jechem.2019.01.024 - ,
Co-pyrolysis of bamboo sawdust and plastic: Synergistic effects and kinetics ,Renew Energy , Vol. 149 ,pp 1133–1145 , 2020, https://doi.org/https://doi.org/10.1016/j.renene.2019.10.103 - ,
Insight into Pyrolysis Kinetics of Lignocellulosic Biomass: Isoconversional Kinetic Analysis by the Modified Friedman Method ,Energy and Fuels , Vol. 34 (4),pp 4874–4881 , 2020, https://doi.org/https://doi.org/10.1021/acs.energyfuels.0c00275 - ,
Pyrolytic behavior and kinetic of wood sawdust at isothermal and non-isothermal conditions ,Renew Energy , Vol. 142 ,pp 284–294 , 2019, https://doi.org/https://doi.org/10.1016/j.renene.2019.04.115 - ,
Co-pyrolysis behaviors and kinetics of plastics-biomass blends through thermogravimetric analysis ,J Therm Anal Calorim , Vol. 115 (1),pp 227–235 , 2014, https://doi.org/https://doi.org/10.1007/s10973-013-3228-7 - ,
Microwave assisted co-pyrolysis of biomasses with polypropylene and polystyrene for high quality bio-oil production ,Fuel Processing Technology , Vol. 175 ,pp 64–75 , 2018, https://doi.org/https://doi.org/10.1016/j.fuproc.2018.02.019 - ,
Kinetics of synergistic effects in co-pyrolysis of biomass with plastic wastes ,Appl Energy , Vol. 220 ,pp 408–418 , 2018, https://doi.org/https://doi.org/10.1016/j.apenergy.2018.03.117 - ,
Thermogravimetric and kinetic analysis of biomass and polyurethane foam mixtures Co-Pyrolysis ,Energy , Vol. 237 , 2021, https://doi.org/https://doi.org/10.1016/j.energy.2021.121592 - ,
Co-pyrolysis of waste plastic and solid biomass for synergistic production of biofuels and chemicals-A review ,Progress in Energy and Combustion Science , Vol. 84 , 2021, https://doi.org/https://doi.org/10.1016/j.pecs.2020.100899 - ,
Catalytic co-pyrolysis of lignocellulosic biomass with polymers: A critical review ,Green Chemistry , Vol. 18 (15),pp 4145–4169 , 2016, https://doi.org/https://doi.org/10.1039/c6gc00911e - ,
ISO 14780:2017 - Solid biofuels — Sample preparation , 2022 - ,
ISO 17225-1:2014(en), Solid biofuels — Fuel specifications and classes — Part 1: General requirements , 2014 - ,
Cattle manure pyrolysis process: Kinetic and thermodynamic analysis with isoconversional methods ,Renew Energy , Vol. 107 ,pp 489–496 , 2017, https://doi.org/https://doi.org/10.1016/j.renene.2017.02.026 - ,
Pyrolysis kinetics and thermal behavior of waste sawdust biomass using thermogravimetric analysis ,Bioresour Technol , Vol. 251 ,pp 63–74 , 2018, https://doi.org/https://doi.org/10.1016/j.biortech.2017.12.029 - ,
Thermogravimetric analysis investigation of polyurethane plastic thermal properties under different atmospheric conditions ,J. Sustain. Dev. Energy, Water Environ. Syst. 7, 355–367 , 2019, https://doi.org/https://doi.org/10.13044/j.sdewes.d6.0254 - ,
Catalytic pyrolysis of plastic waste: A review ,Process Safety and Environmental Protection , Vol. 102 ,pp 822–838 , 2016, https://doi.org/https://doi.org/10.1016/j.psep.2016.06.022 - ,
Co-pyrolysis and synergistic effect analysis of biomass sawdust and polystyrene mixtures for production of high-quality bio-oils ,Process Safety and Environmental Protection , Vol. 145 ,pp 1–11 , 2021, https://doi.org/https://doi.org/10.1016/j.psep.2020.07.023 - ,
A review on co-pyrolysis of biomass: An optional technique to obtain a high-grade pyrolysis oil ,Energy Convers Manag , Vol. 87 ,pp 71–85 , 2014, https://doi.org/https://doi.org/10.1016/j.enconman.2014.07.007 - ,
Investigating the interactions between lignocellulosic biomass and synthetic polymers during co-pyrolysis by simultaneous thermal and spectroscopic methods ,Biomass Convers Biorefin , Vol. 9 (3),pp 593–608 , 2019, https://doi.org/https://doi.org/10.1007/s13399-019-00390-9 - ,
Study on the pyrolytic behaviors and kinetics of rigid polyurethane foams ,Procedia Eng , Vol. 52 ,pp 377–385 , 2013, https://doi.org/https://doi.org/10.1016/j.proeng.2013.02.156 - ,
Co-pyrolysis behaviors and kinetics of plastics-biomass blends through thermogravimetric analysis ,J Therm Anal Calorim , Vol. 115 (1),pp 227–235 , 2014, https://doi.org/https://doi.org/10.1007/s10973-013-3228-7