


In the hydrologic cycle, infiltration illustrates how quickly water enters the soil through the pores [1]. Infiltration significantly affects the water balance because it affects surface runoff [2] and subsequent water movement [3]. Land use is an essential factor in influencing the infiltration rate [4], especially in the rainfall kinetic intercept [5], increasing the soil surface roughness [6], improving soil structure stability, and increasing porosity due to the organic matter produced [7].
Ironically, from 1960–2019, there has been a 32% global change in land use (LU), four times greater than the estimated predictions [8]. It also affected the average annual runoff increase by 5% [9]. Human activities and demand are the direct drivers of land-use change [10]. The indirect driver of climate change affects land conditions and influences suitable land use [11]. This change has reduced water catchment capability to infiltrate water [12] and increased the occurrence of hydrometeorological disasters such as droughts [13], floods [4] and landslides [14].
Land use is closely related to the land arrangement process, following land use considerations, social needs, and economic and political aspects [15]. Land planning certainly has considered various aspects; however, its implementation often goes beyond the regulations set by the government [16]. For instance, even though it has been regulated in the Indonesian Republic’s policy (no. 26 year 2007) and concerning spatial planning regulation, Indonesia continues to experience deforestation of about 29.1 million ha in only five years on agricultural land [17]. It reduces the water absorption areas and decreases infiltration rates [18]. Using the latest technology to monitor land use changes and their impact on infiltration needs to be developed as an early warning system before it worsens.
There have been many developments and uses of remote sensing to monitor land use changes [19] and its impact on the water cycle [20] from researchers worldwide. A recent study has used Sentinel 2A (S2A) and obtained a relatively good accuracy to monitor land use change [21]. However, previous studies still have weaknesses when exposing land use as a factor influencing infiltration [22]. This problem occurs because the data used is only a single year’s worth of data, and geostatistical extrapolation is not reasonable. There is a need for baseline data on land use change whose results can holistically view the dynamics of infiltration rates from time to time. Meanwhile, due to the low level of accuracy, machine learning-based geostatistical analysis has the potential to be applied [23]. Machine learning can overcome the limitations of processing single-year data and replace it with multi-year data to identify changing trends well and in detail.
By analysing baseline data [24], future land use mosaics (business as usual) can be predicted using an artificial neural network cellular automata Markov chain (ANN CA Markov) [25]. Business as Usual (BAU) land use scenario is then compared with other land use scenarios, such as regional spatial planning (RSP) and land use according to carrying capacity [26]. These three scenarios are used as material for predicting infiltration in an area through machine analysis [27].
The machine learning analysis method that is known to be effective and has the potential to be developed in this research is the random forest [28]. Random forest is a supervised machine-learning algorithm that makes predictions that combine decision trees [29]. Predictions can be made through classification or regression. Random forests have been widely used in hydrological research and have a high accuracy in their results [30]. This study aims to apply a random forest to get the best infiltration-friendly land use scenario, an effective and efficient method. This research will provide an overview of how land use affects infiltration at the sub-watershed level as a case study.
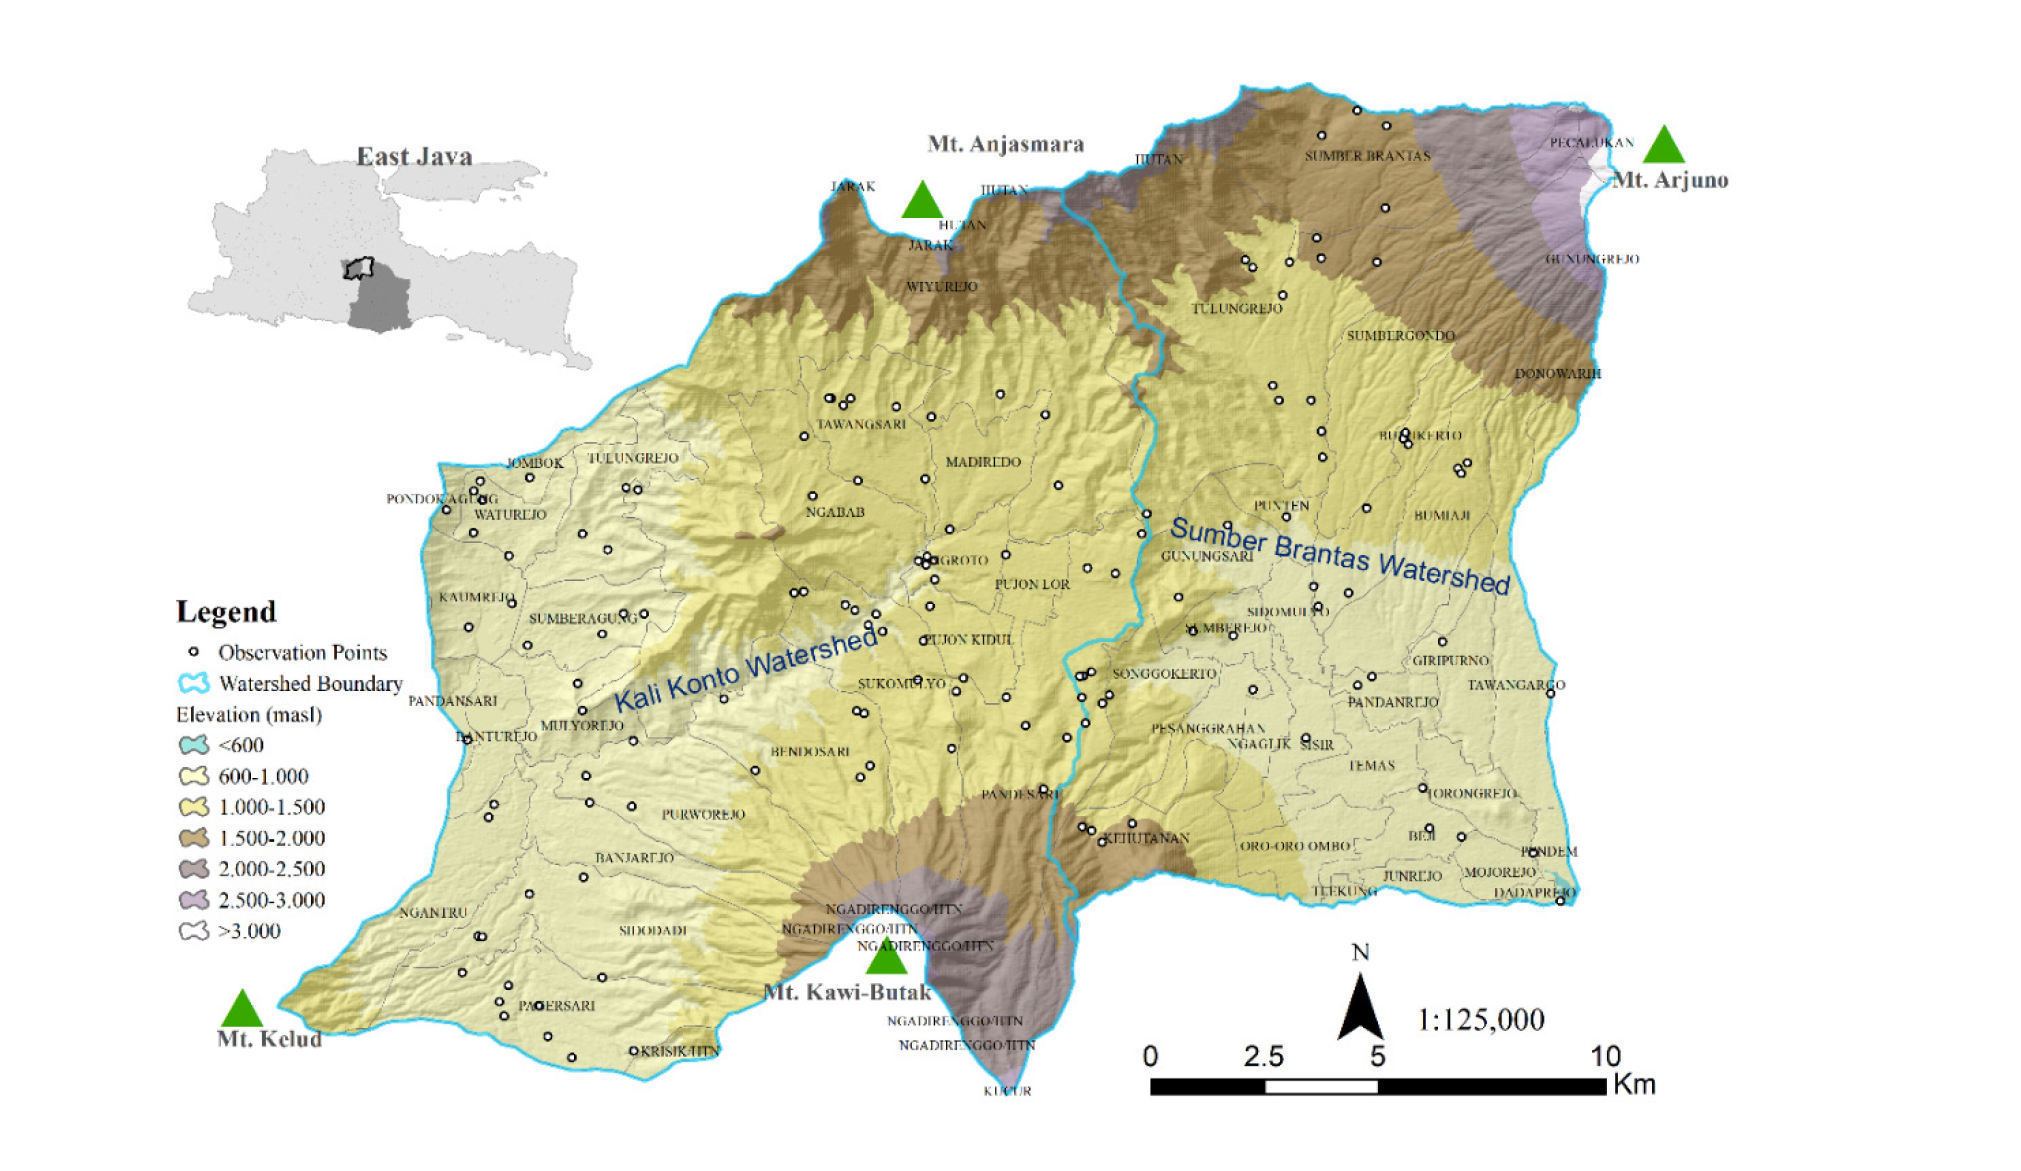
The research was conducted in the critical Sumber Brantas and Kali Konto sub-watersheds [31] with a total area of 40,943.50 ha Figure 1 from July to December 2022. The geographical location of the research location is at 7°44’47.8896”–7°56’52.026” South Latitude and 112°19’22.0008”–112°35’22.8048” East Longitude. The selection of the research location was based on the status of the watershed, which is classified as critical, where the two upstream watersheds experience high levels of land conversion and have a historical potential for landslides [32] and high floods [33] as the end product of unhealthy sub-watershed.
The Sumber Brantas and Kali Konto sub-watersheds are volcanic regions surrounded by active and inactive volcanoes. Mount Anjasmoro is the oldest mountain in the north, while Mount Kawi-Butak is on the southeast side. Mount Kelud is an active volcano southwest of the research location.
Sub-catchment boundaries and infiltration measurement locations in the field
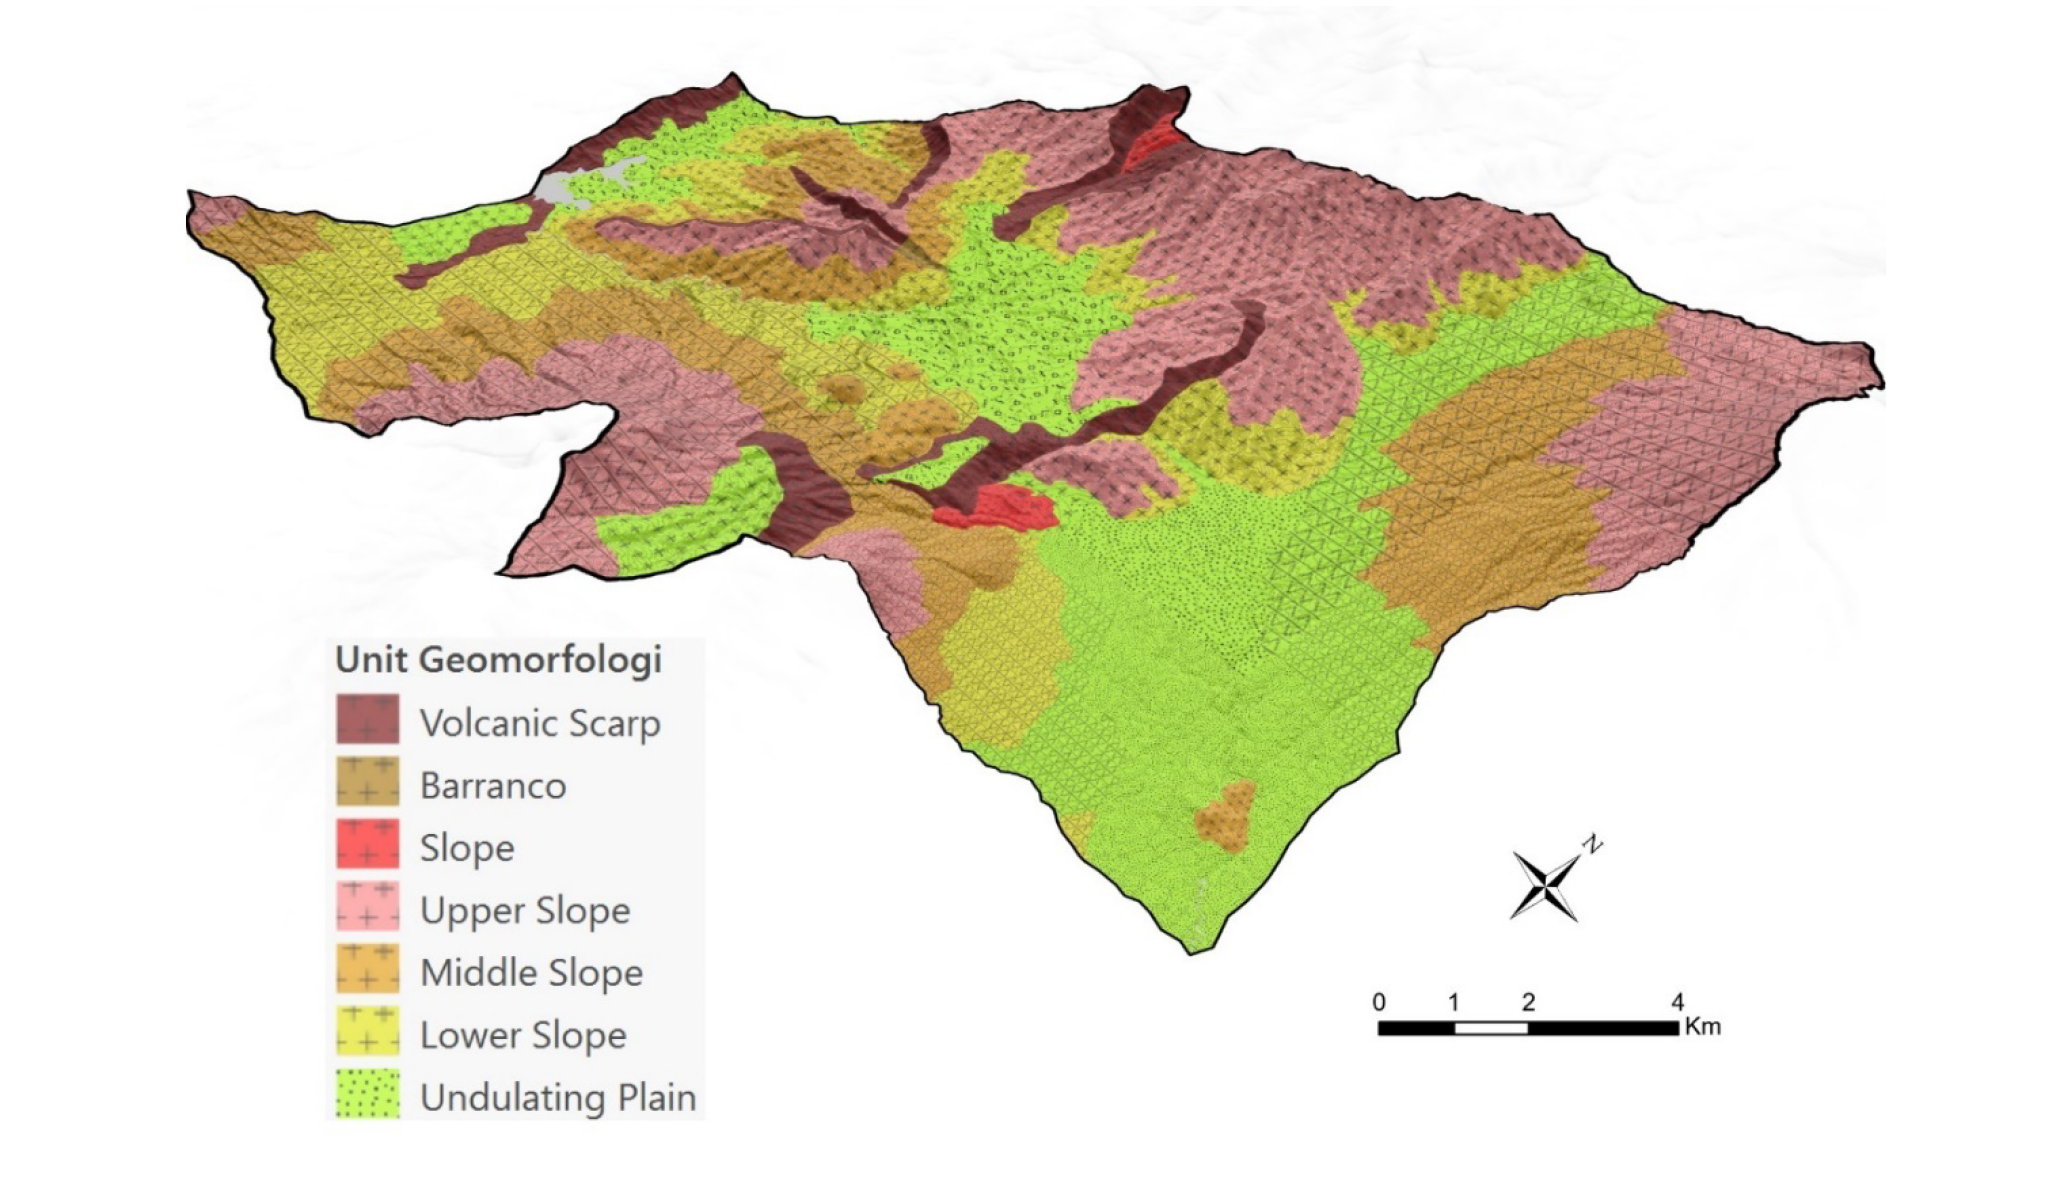
Geomorphology of the research location
The Sumber Brantas sub-watershed has a longer circumference of 122.03 km than the Kali Konto sub-watershed of 75.79 km. It also has a higher flow density of 2.93 km km-2 than the Kali Konto sub-watershed. Both sub-watersheds are part of the elongated sub-watershed, with a circularity ratio of 0.38 or greater.
Rainfall at the study site averages 2,276 mm year-1 and is included in the “C” climate type based on the Schmidt-Ferguson classification system. The development of soil types in the Kali Konto sub-watershed was influenced by the volcanic activity of Mount Anjasmoro Tua in the north and Mount Kawi-Butak in the south [34]. The types of soil that develop at the study site are udepts, udands, psamments and orthents [35]. The geomorphology in the site location is divided into seven groups to figure out and fulfil the research location. A volcanic scarp, barranco, slope and upper slope have been identified in the upper part of the sub-watersheds. Subsequently, a middle slope formed in the middle part, while in the lower part, a lower slope and undulating plain (inter volcanic plain), Figure 2.
This research uses several combinations of methods stated in the form of a framework. To expedite the data analysis process, the tools used in the research activities included laptops, ArcMap 10.8 software, QGIS 2.18 software, Garmin 78s GPS, a single-ring infiltrometer (10–50 cm in diameter and 10–20 cm in height), a casserole, wooden blocks, a hammer, a stopwatch, a jerry can, a ruler, duct tape, stationery, a camera, R Studio software, and Microsoft Office software. Materials that support research activities included Sentinel-2A imagery, geological maps at a scale of 1:100,000, digital elevation model DEMNAS, maps of the Indonesian Topic Earth at a scale of 1:25,000, maps of RSP at a scale of 1:25,000, maps of land systems at a scale of 1:50,000, rainfall data for 1992–2021, and maps of the Sumber Brantas and Kali Konto sub-watersheds.
Land-use change analysis was carried out by classifying Sentinel-2A satellite imagery with four years of recording, namely 2017, 2019, 2021, and 2022. Sentinel-2A satellite imagery, which has a spatial resolution of 10 m, can be downloaded via the Copernicus website (
The image pre-processing stage is the improvement stage of satellite imagery before it is used. This stage consists of geometric correction, radiometric correction, atmospheric correction, and haze removal. The Sentinel-2A satellite image pre-processing stage used QGIS and PCI Geomatica software [36].
The image classification method used is the supervised classification method or the guided classification method. Sentinel-2A satellite image classification was carried out using ArcGIS software [37]. The image classification results are land use classes, categorised into agroforestry, natural forest, artificial forest, production forest, built-up areas, orchards, vacant land, grasslands, paddy fields, shrubs, dry fields, and bodies of water.
The naming of land use (LU) or land cover (LC) classes is based on a hierarchy following the Indonesian National Standard on land cover classification at a scale of 1:250,000 [26].
The results of the land use classification are then carried out in an accuracy test by comparing the 100 points resulting from the classification of land use in 2022 with the land use results from ground checks in the field. The accuracy test aims to quantitatively determine how pixels are grouped into the correct feature class in the observed area [38]. The coordinates of the validation point are recorded using the Garmin 78s GPS. The accuracy test used is the Kappa analysis method by creating a confusion matrix [39].
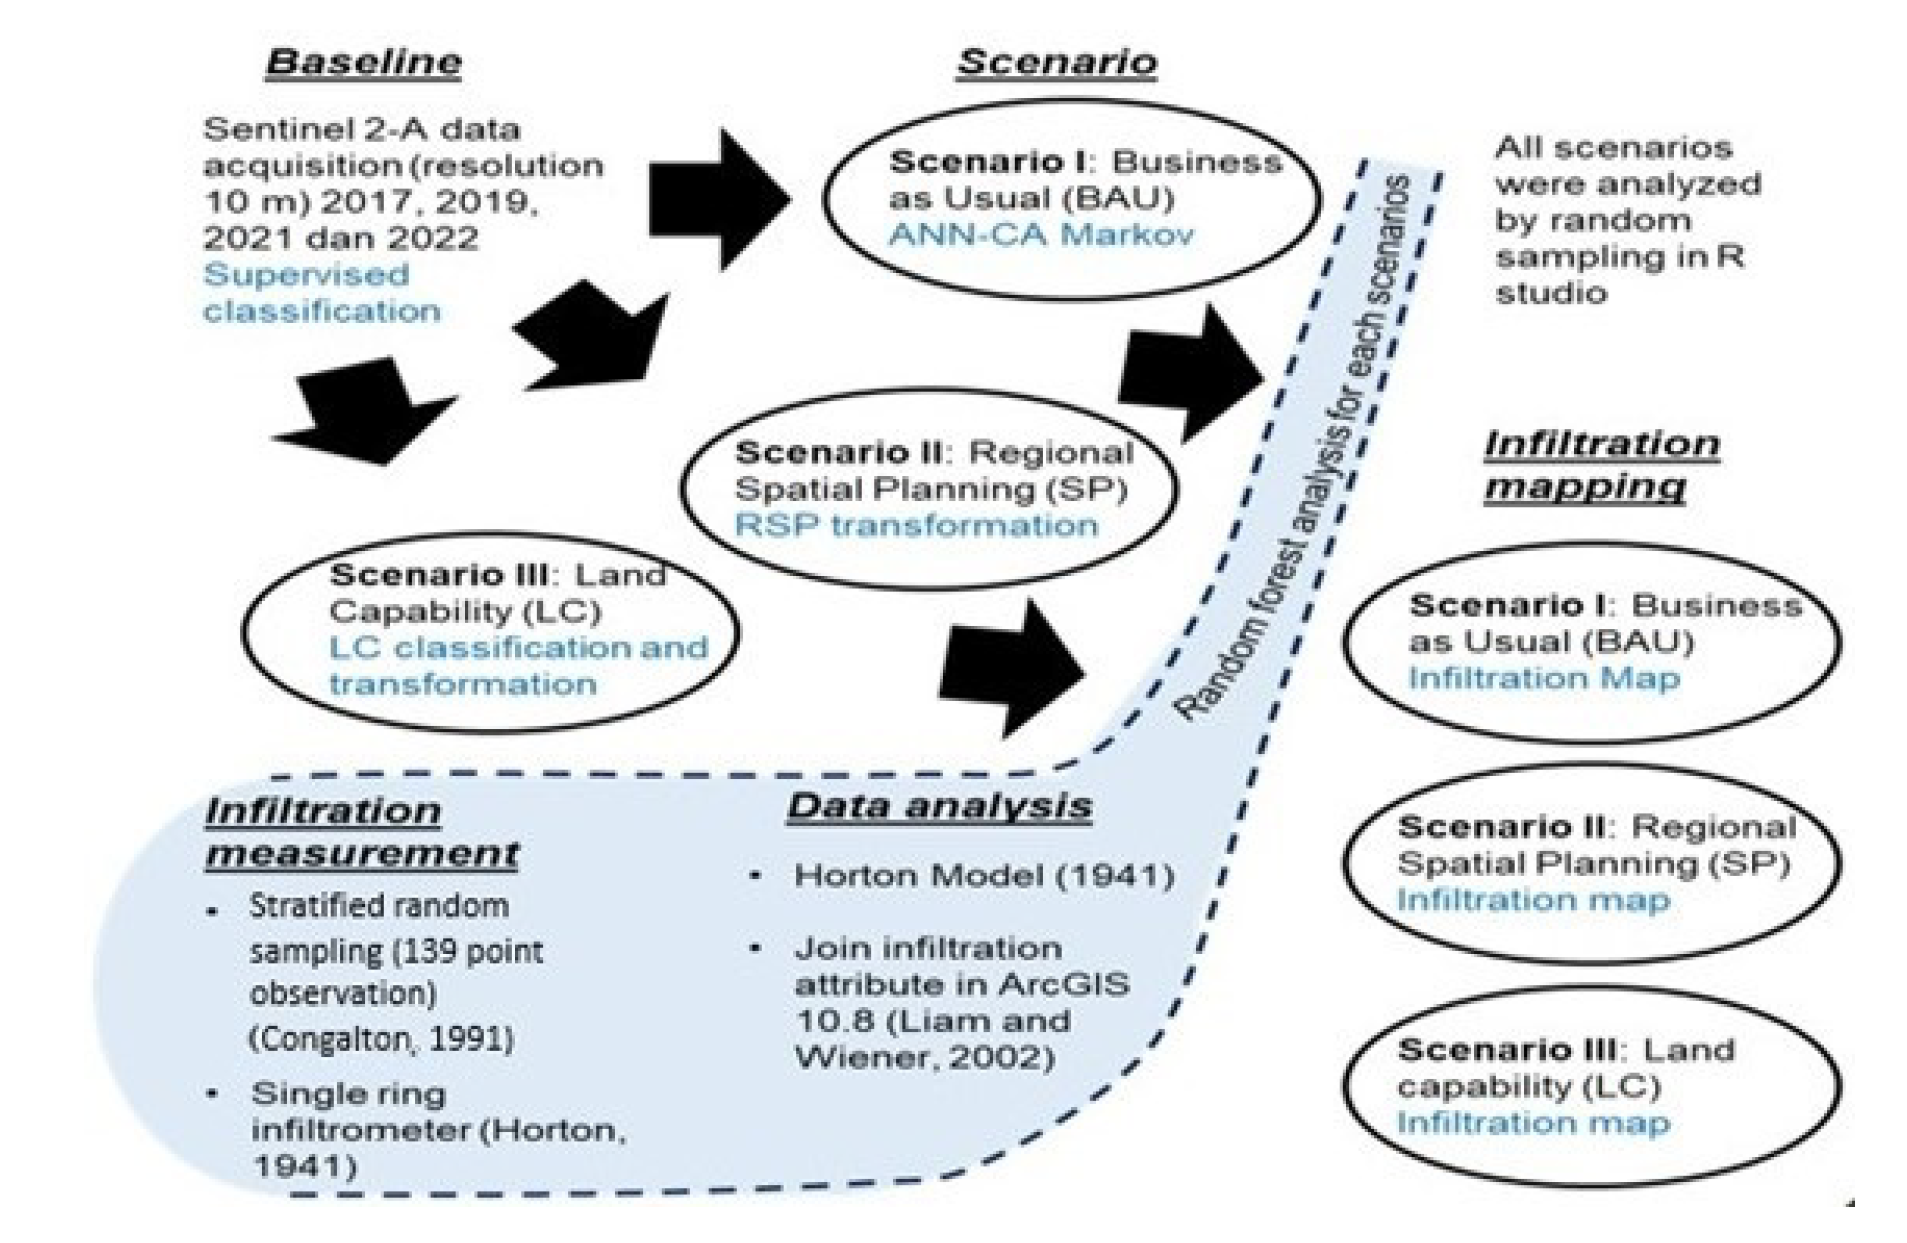
The results of the analysis of land use classification for 2017, 2019, 2021, and 2022 are used to compile baseline trends of land use change [36]. This changing trend is then used to determine the BAU scenario using cellular automata. As a comparison, the RSP and LC land use analyses were carried out Figure 3.
Research framework and scenarios
The BAU land use scenario represents land use and cover developments without intervention. Data on road area (
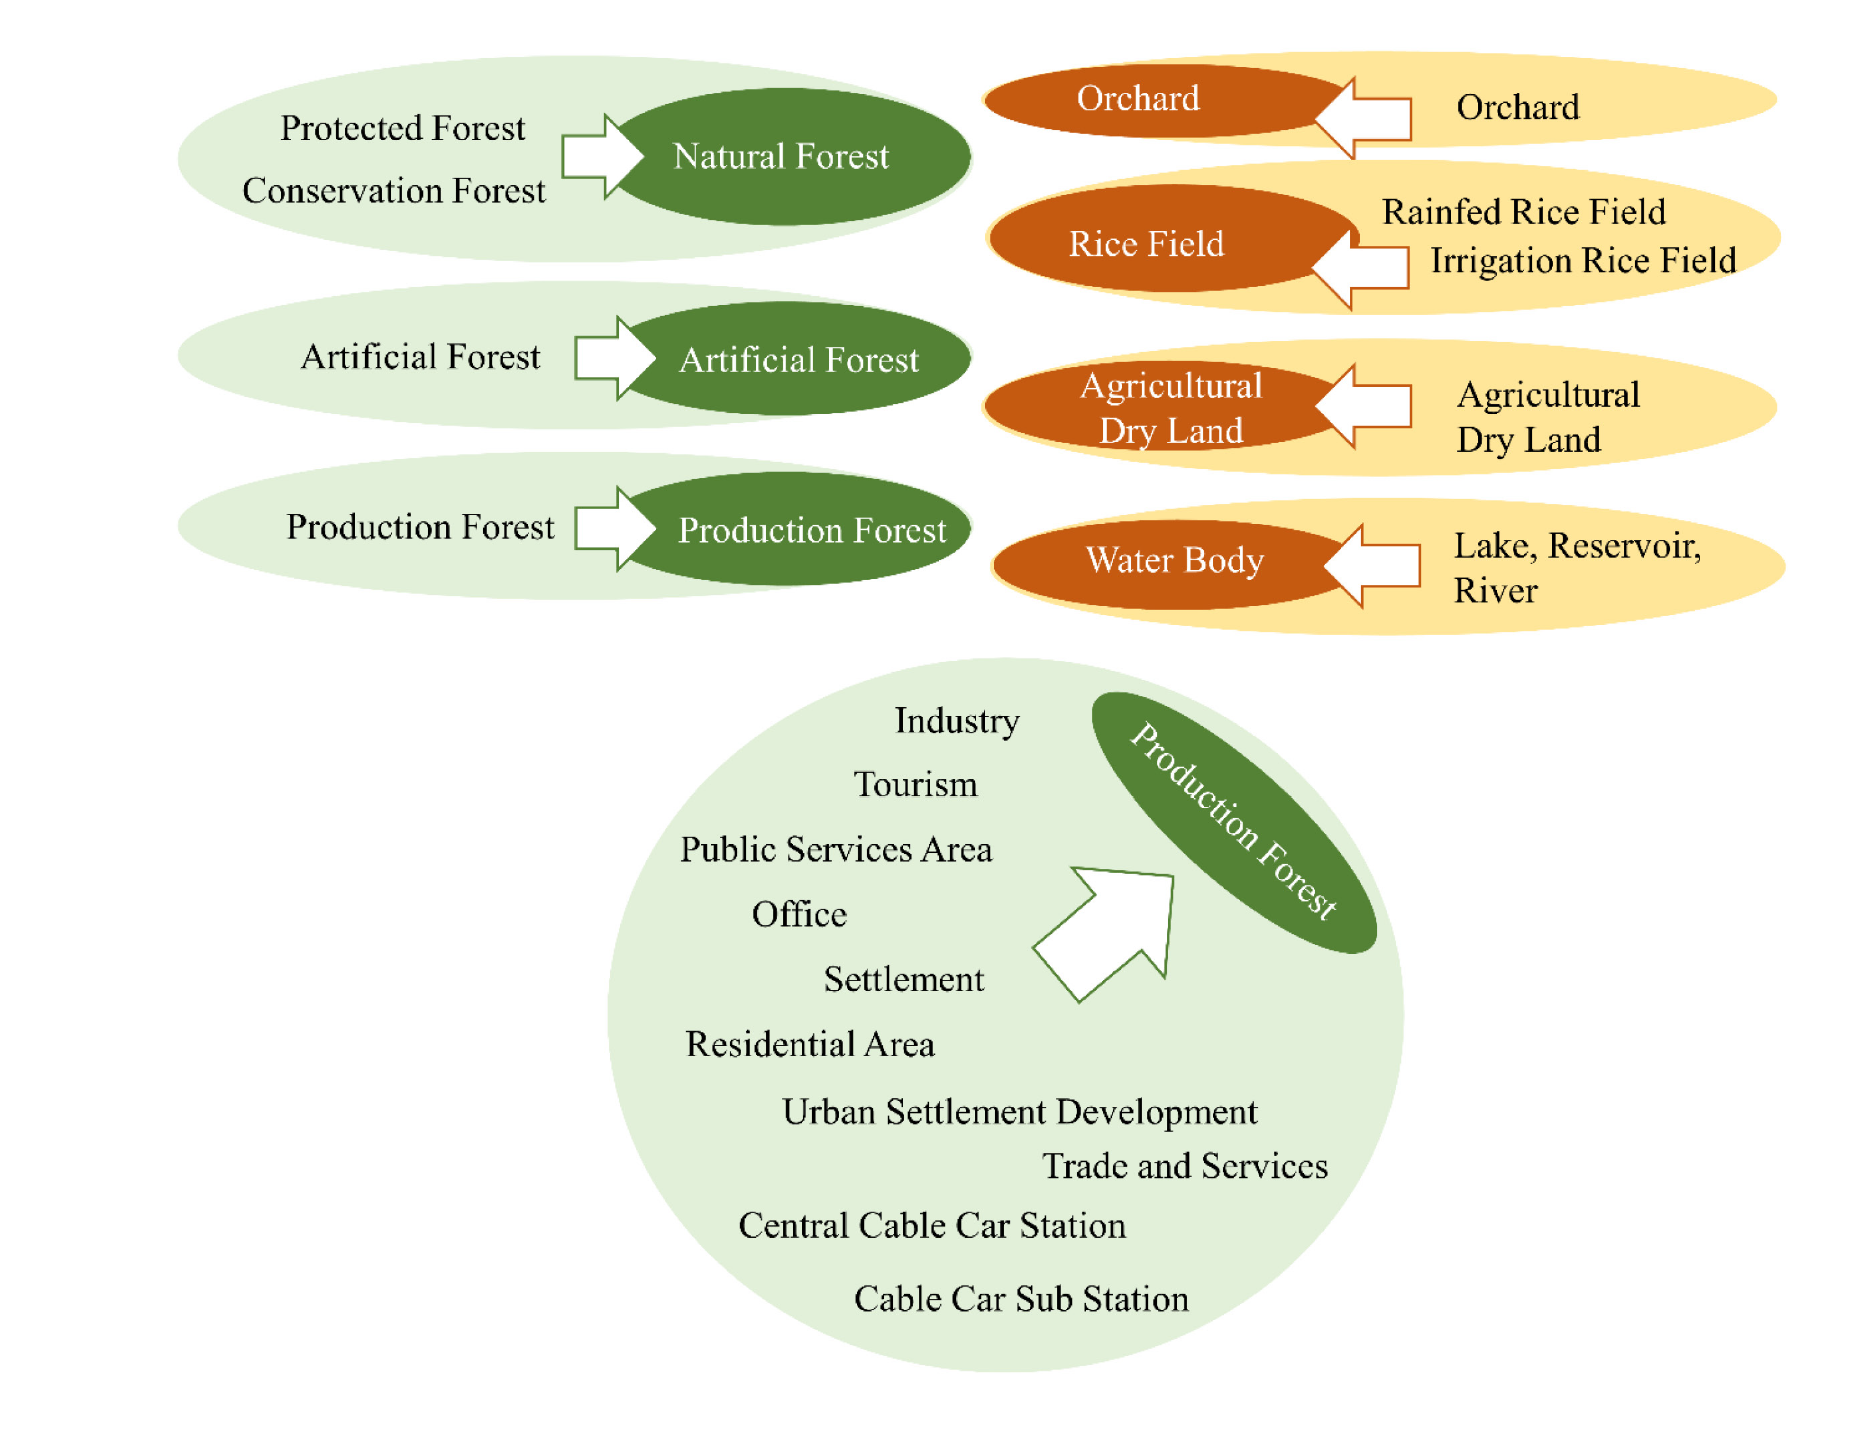
The Regional Spatial Planning (RSP) scenario includes policies, strategies, plans and directions for spatial patterns for 20 years prepared by the government (Ministry of Agrarian Affairs and Spatial Planning/Head of the National Land Agency, 2018). The RSP map was obtained from the Directorate General of Spatial Planning (
Regional Spatial Planning transformation to Land Use classification
The LC scenario refers to grouping potential land to support sustainable agriculture based on the land characteristics [41]. Land Capability Class (LC) maps were prepared using a 1:50,000 scale Land System Map as a secondary data source from soil texture maps, drainage maps, permeability maps, and effective depth maps [42] and DEMNAS BIG data (
Infiltration rate values were obtained through field measurements at 36 points, distributed using a stratified random sampling method representing 11 types of land use Figure 1. Infiltration measurements were carried out using the single-ring infiltrometer method, which can describe infiltration in the soil [44].
The average infiltration rate [45] was calculated using the Horton equation [28].
(1)
Where ft is the infiltration rate [cm h-1], ∆h is the lowering of the water level [cm], and ∆t is the measurement time [h]. The validation test was carried out using a paired t-test at Rstudio.
Infiltration mapping in the Sumber Brantas and Kali Konto sub-watershed areas was done using random forest analysis in the R Studio software [28]. The data needed in the random forest analysis are infiltration measurements and land use data at observation points in the field. As much as 80% of infiltration data from measurements in the field is used for model development, and 20% of infiltration data from the field is used for validation. Infiltration mapping was carried out based on land use scenarios to obtain infiltration maps for 2017, 2019, 2021, 2022, and 2025 (BAU), infiltration maps based on LCs, and infiltration maps based on RSP. Spatial data for the random forest model was created using R software packages, including rsample, random forest, ranger, caret, and snow. Spatial data manipulation was done using R packages raster, rgeos, sf, sp, rgdal, classInt, ggmap, tmap, leaflet, and ggpubr [28].
The validation test compared the infiltration model with the infiltration value measured in the field. The validation test method is the Nash-Sutcliffe Model Efficiency Coefficient (NSE) [46]. The NSE method efficiently evaluates rainfall-runoff models for estimating infiltration [28]. The NSE score criteria are divided into good (above 0.75), acceptable (0−0.75), and bad (below 0).
The Results and Discussion section represents the pivotal phase of this study, where we delve into the outcomes of land use changes across different scenarios, infiltration data analysis, infiltration modelling, the interconnectedness of land use with infiltration, and the inherent limitations of this research.
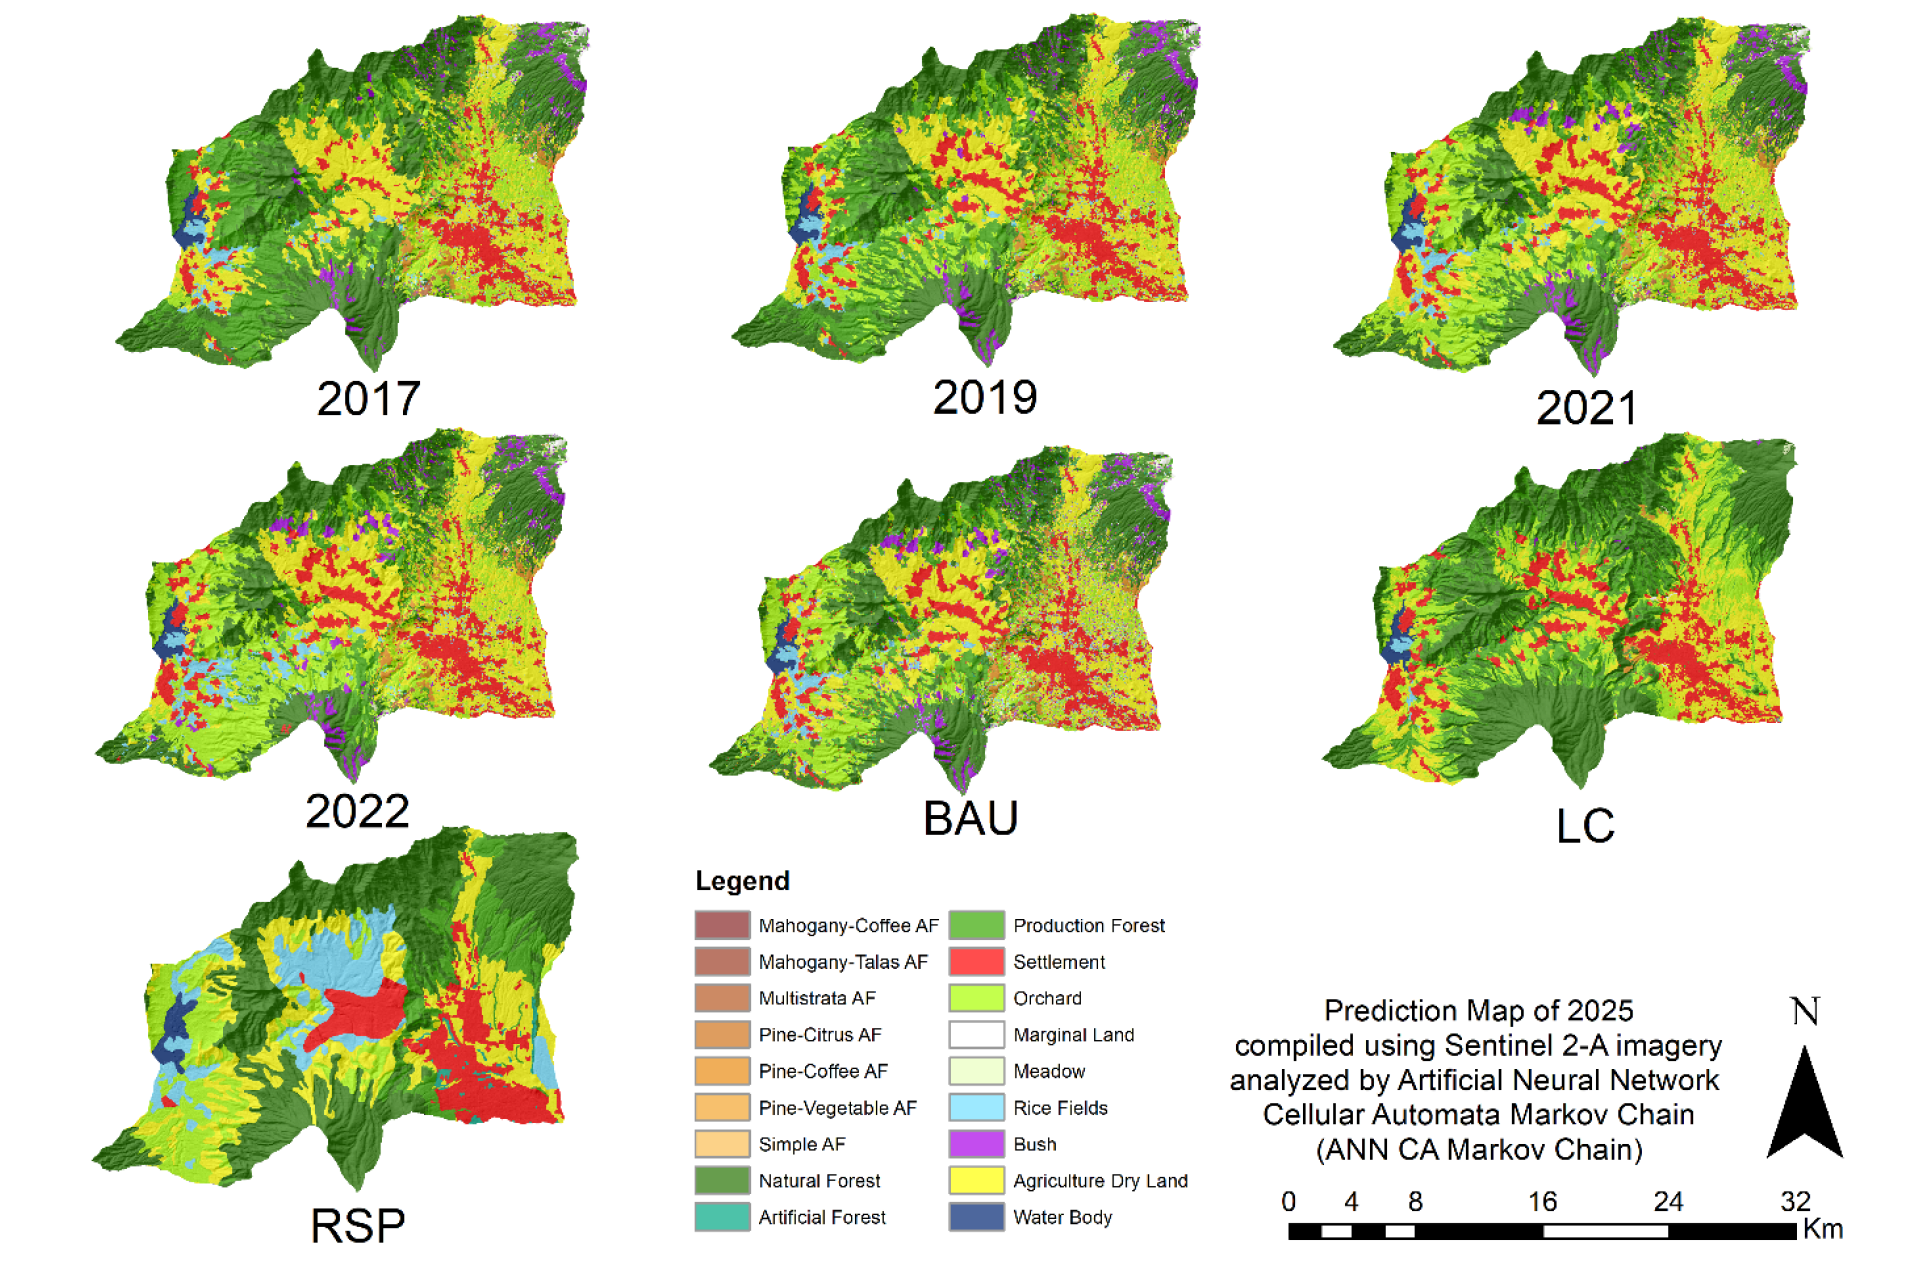
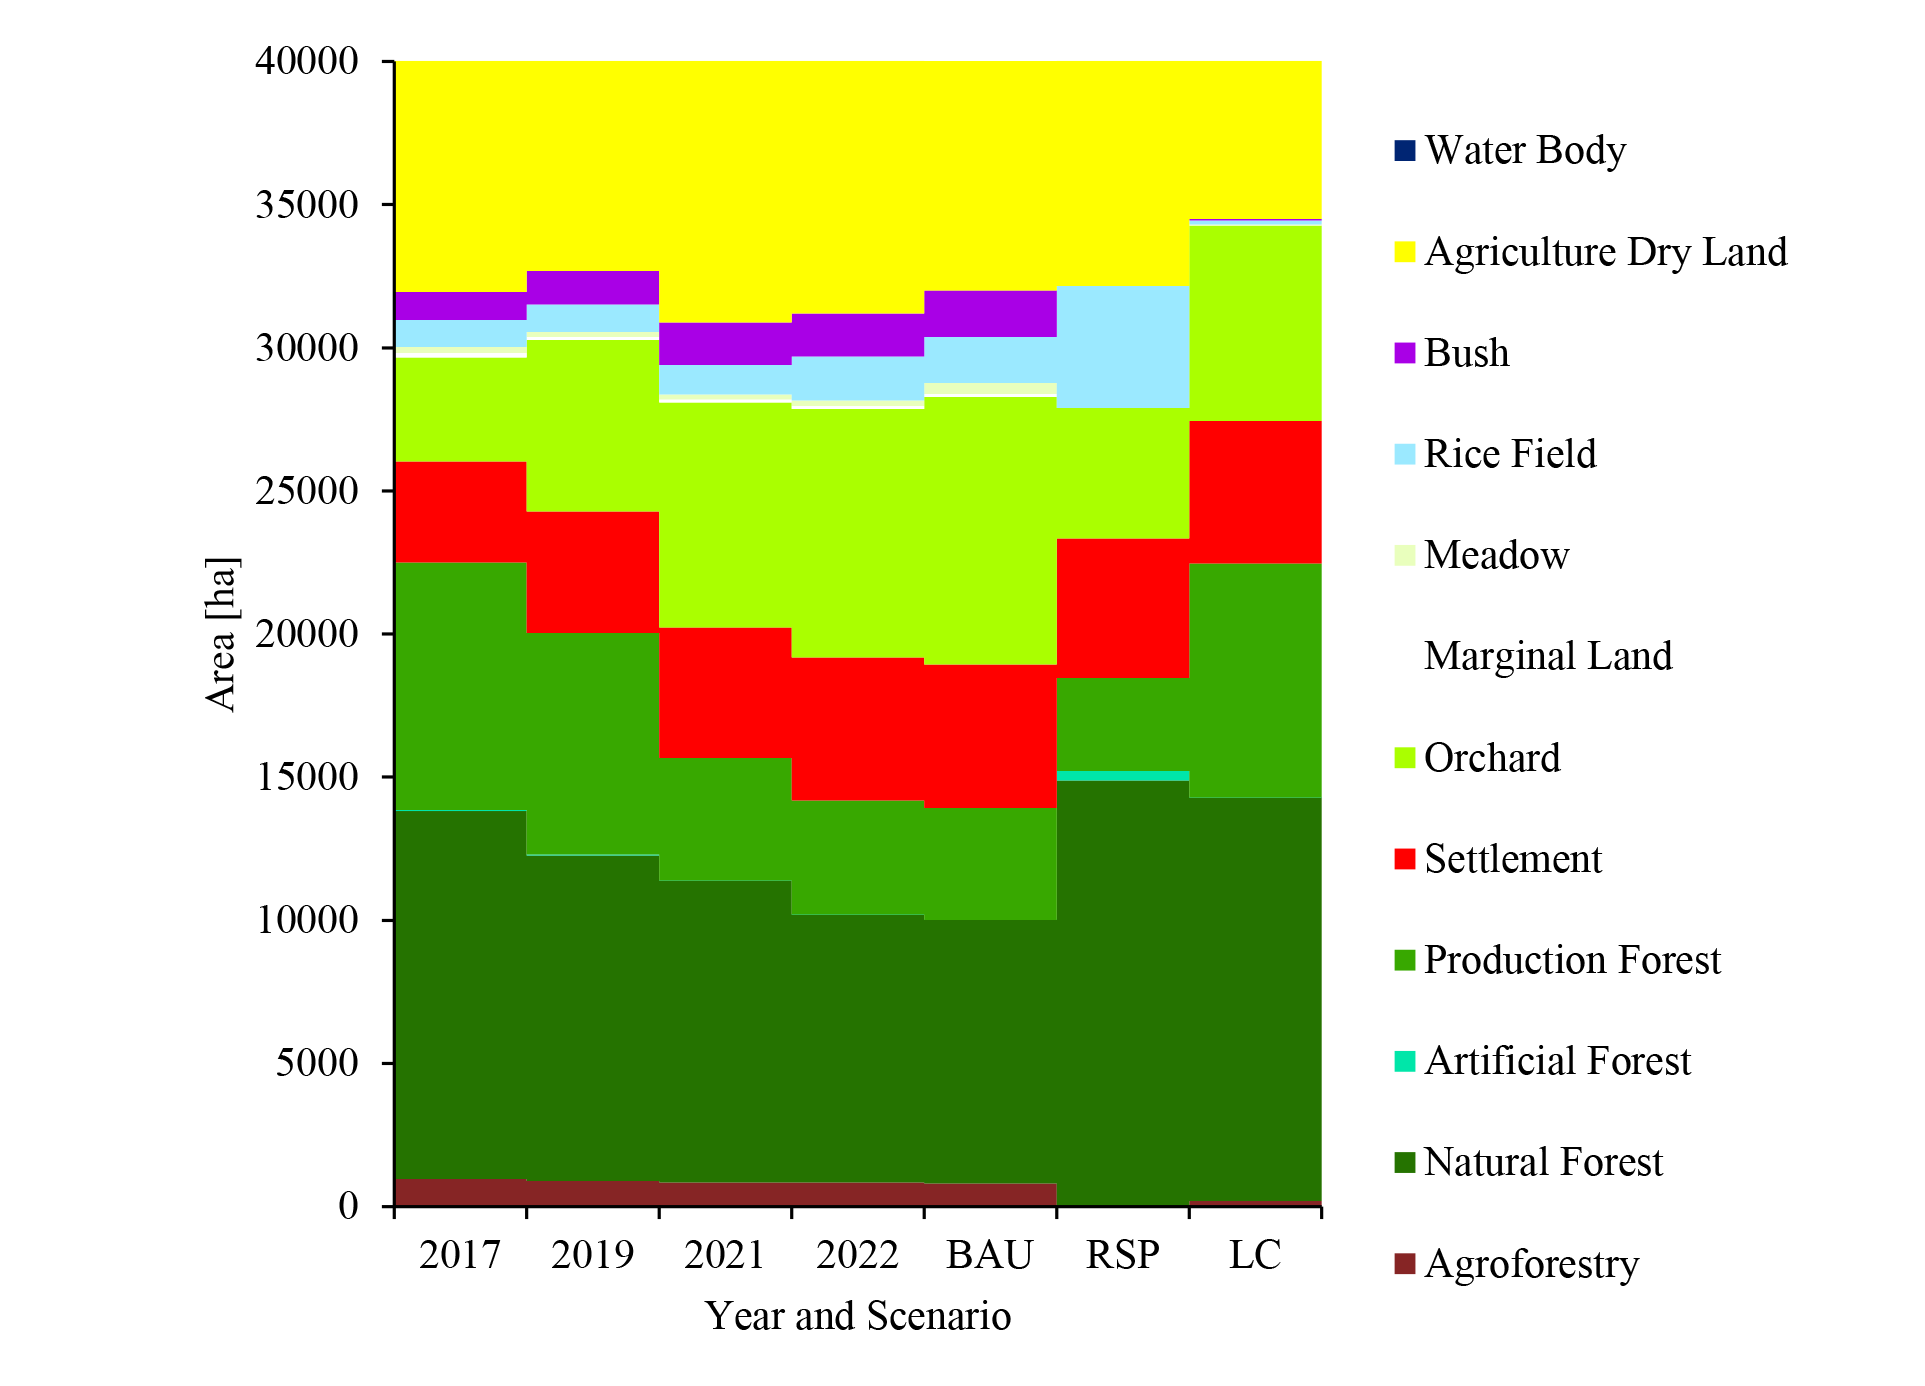
Forest areas of 2017 were identified as the main land use, covering 31% of the Sumber Brantas and Kali Konto sub-watersheds. The dominant land use type is natural forest (12,855 ha). Dry land agriculture was identified as the second largest land use (8,683 ha), followed by production forest (8,637 ha), orchards (3,646 ha), and built-up areas (3,533 ha). Using the supervised method used in 2017, the Land Use Land Cover (LULC) classification in 2022 will produce 18 LULC species in the Sumber Brantas and Kali Konto sub-watersheds. Dryland farming is the dominant land use (9,439 ha). In comparison, natural forest was identified as the second largest land use (9,366 ha), followed by orchards (8,688 ha) and built-up areas (4,981 ha).
A multi-temporal comparison of land use (2017–2022) shows some land-use configuration changes. Natural and production forests decreased by 3,489 ha and 4,661 ha, respectively. On the other hand, the built-up area has increased by 1,555 ha. On agricultural land, agroforestry has decreased by 110 ha. Meanwhile, paddy fields experienced an increase of 488 ha. Details of changes in the 18 types of LULC from 2017 to 2022 are presented in Figure 5 and Figure 6.
The Kappa accuracy test results for the 2022 LULC classification show a value of 0.79, which is included in the excellent category [47] so that the 2017 to 2022 classification can be used as a baseline, followed by three land use scenarios consisting of Business as Usual (BAU) in 2025, Regional Spatial Planning (RSP), and Land Capability Class (LC).
Based on the results of the LULC classification (2017–2022), it can be seen that mosaics typical of mountainous areas are found in the Sumber Brantas and Kali Konto sub-watersheds. The upper slope is included in the Tahura or Perhutani area, which is dominated by land use in the form of natural forest and production forest and shrubs. The middle slope is dominated by land use in the form of plantations, several villas, and tourist buildings. Meanwhile, the lower slopes are dominated by seasonal crops (agricultural dry land fields and paddy fields) and built-up areas.
Land use change patterns 2017−2022 and land use scenarios
Graph of 2017−2022 land use areas and scenarios
The analysis results of land use in 2019 and 2021 are used to predict land use in 2025 using the ANN Cellular Automata-Markov Chain, showing a Kappa accuracy rate of 82% and is included in the excellent category [48]. Orchard land use will dominate 22.82% of the sub-watershed area in 2025, with a changing pattern of decreasing natural forest area and production forest (2%) followed by agroforestry (4%) and increasing built-up area (1%) from 2022. The pattern predictions of changes in land use like this will also occur in Selangor, Malaysia, in 2031, 2041, and 2051, which state that there has been a decrease in the area of forest area of 1,357.74 ha and an increase in the built-up area of 2,585.08 ha since 1991 [19].
There are vast differences in the use of existing land (2022), the 2025 scenario, and RSP because of population growth, which encourages the development of built areas and infrastructure (roads), as well as agricultural land, to meet the economic needs of the community [49]. Meanwhile, land incompatibility based on LCs and existing land occurs due to human intervention in cultivating land [50], land clearing, or land not following its designation due to population density factors [51].
Variations in infiltration rates in the Sumber Brantas sub-watershed and Kali Konto sub-watershed are strongly influenced by the land use type, Figure 7. The natural forest in the two sub-watersheds has the highest infiltration value compared to other land uses. Artificial forests, production forests, agroforestry and orchards are in the same class as natural forests. However, there is a tendency where the quality of cover decreases and the rate of infiltration decreases. One of the many factors that affect a watershed’s rate of infiltration is management and land cover, which are typically linked to the characteristics of the soil. Rainfall volume, infiltration rate, and surface runoff correlate with soil infiltration [52]. Suppose the phenomenon increases the level of soil density. In that case, it is likely to slow down soil infiltration because the level of management with a certain intensity has to change the soil moisture level, affecting how much water can be absorbed into the soil [53].
Infiltration rate for each land use (NF: Natural Forest; ArtF: Artificial Forest; PF: Production Forest; MD: Meadow; AF: Agroforestry; RF: Rice Field; OC: Orchard; BU: Bush; ADL: Agricultural Dry Land; ST: Settlement; ML: Marginal Land)
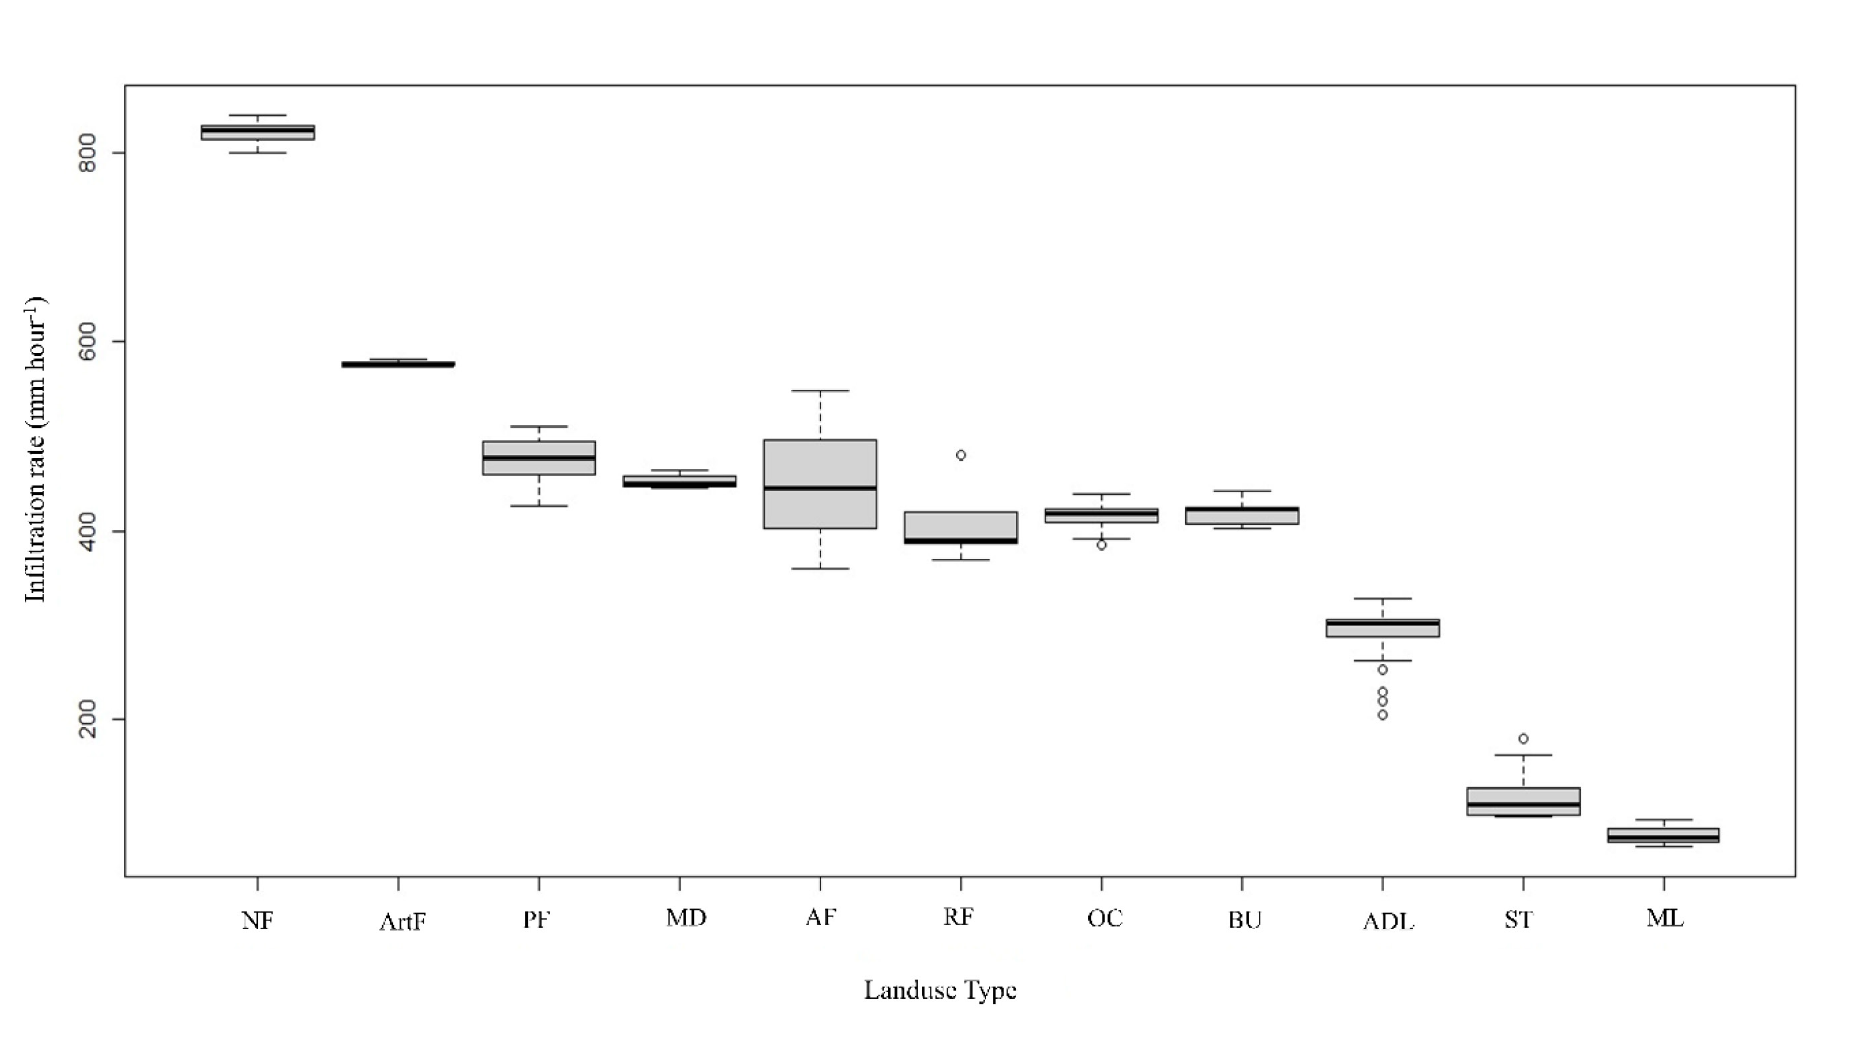
Classification very quickly entered into agroforestry land use, natural forest, artificial forest, production forest, orchards, grasslands, paddy fields, and shrubs. Fast infiltration rates are found in land use in built-up and agricultural dry land areas, while infiltration rates are relatively fast in vacant land use. The faster the infiltration rate, the better the absorption capacity of the land [54]. Land use is quickly dominated by forest land and dense vegetation. Trees can increase soil pores and soil organic matter due to a large amount of litter and tree roots, thus influencing the rate of soil infiltration [28].
The Sumber Brantas and Kali Konto sub-watersheds are volcanic regions surrounded by active and inactive volcanoes. Volcanic eruption activity with various materials significantly impacts soil formation in these two sub-watersheds, resulting in a variety of parent materials and resulting variances in soil texture characteristics. Soil texture also influences the results of observations of soil infiltration rates. The soil texture at the study site is dominated by clay loam, loam, and sandy loam textures. Soil texture is related to the number of soil pores. The coarser the soil texture, the more macro pores it has, so the water can enter the soil faster [55]. The fine soil fraction can inhibit water movement because when the soil is moist, it expands and closes the pore spaces [56]. Compared to soil with a lot of clay, soil with lots of macropores makes it faster for water to infiltrate the soil [57].
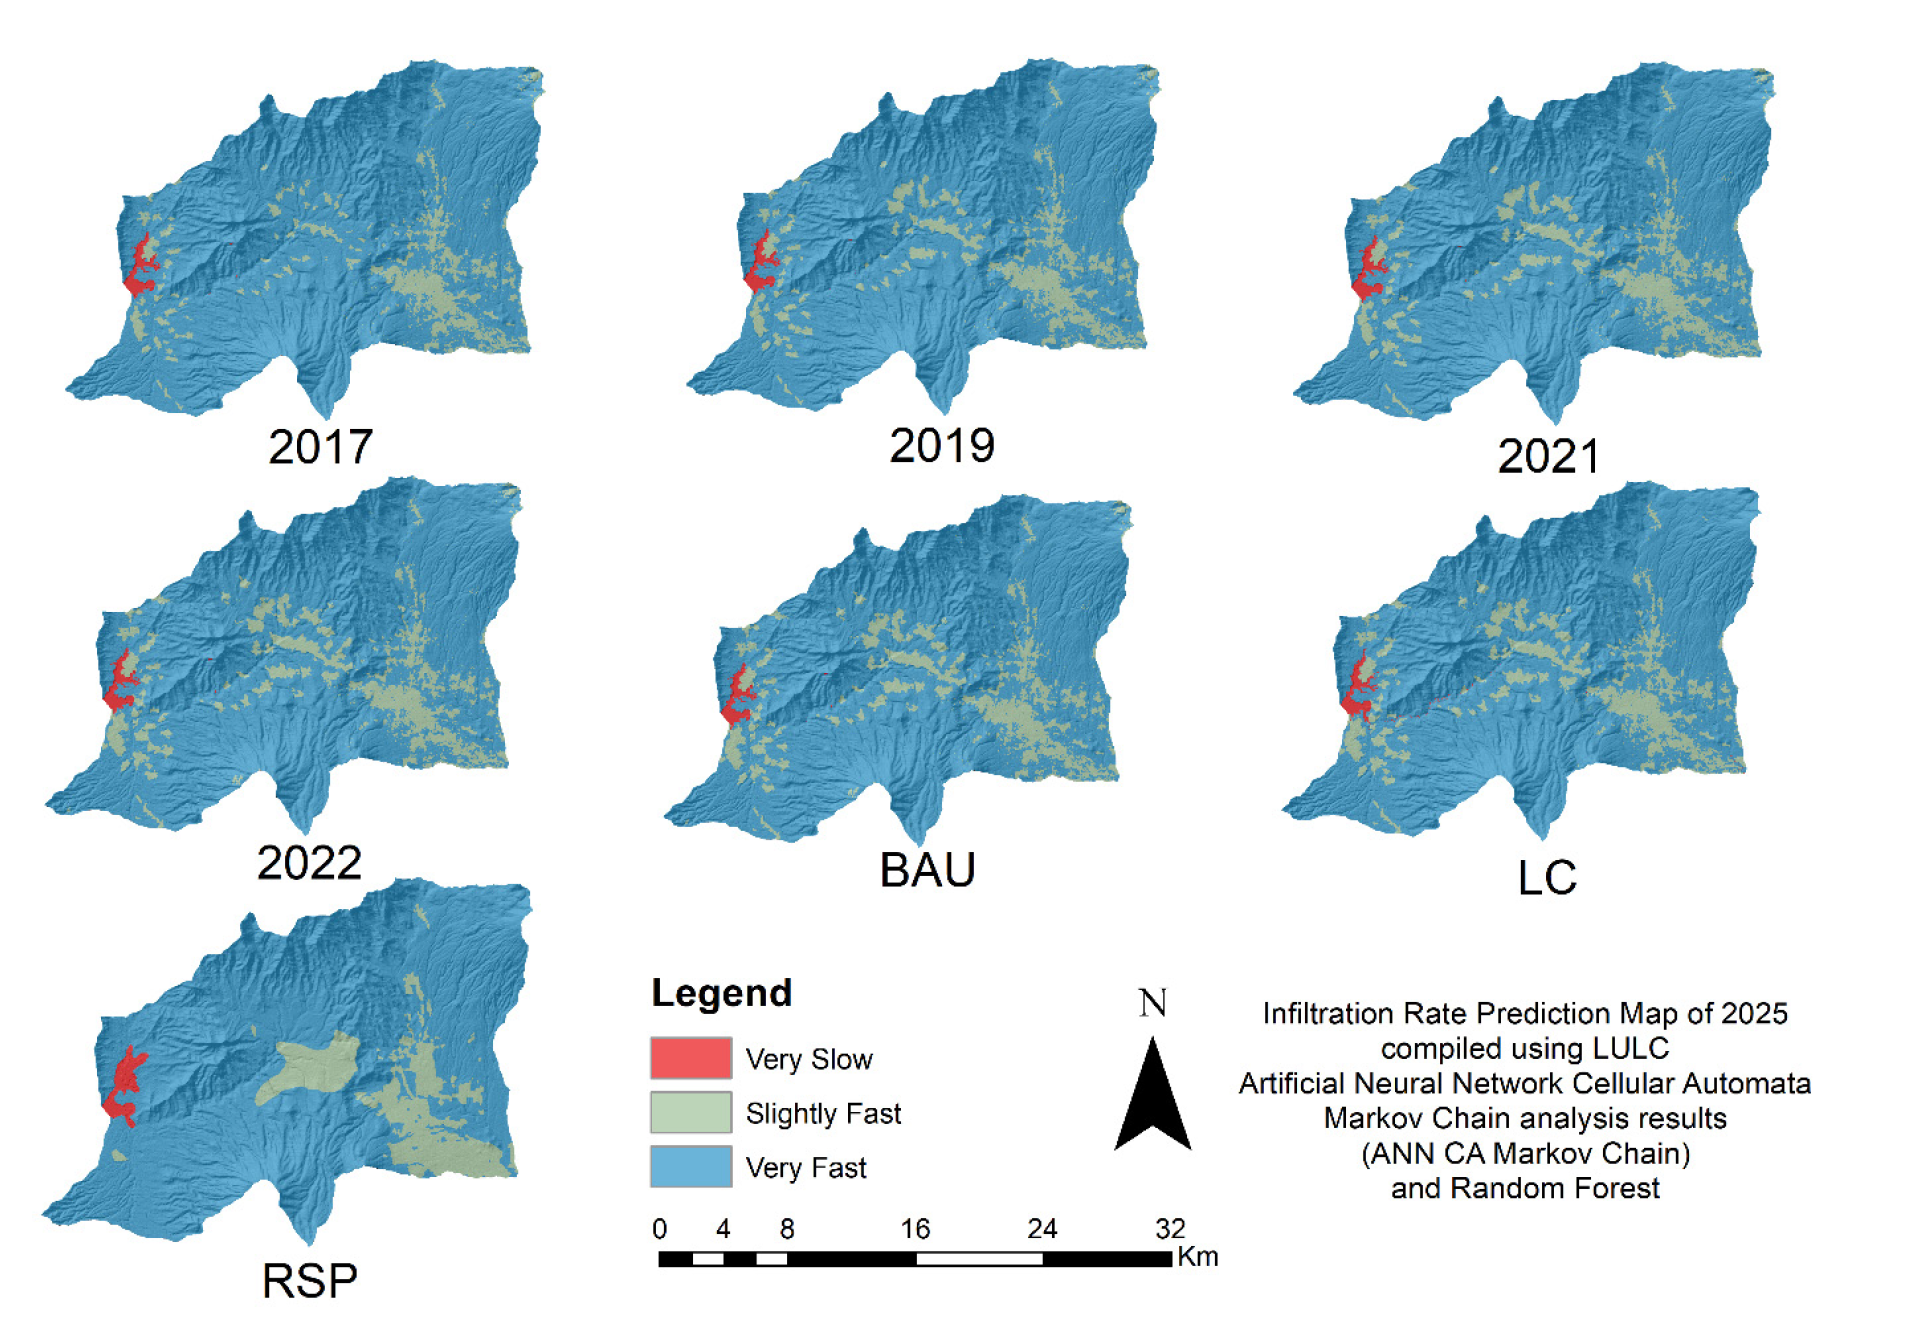
The results of the infiltration analysis were categorised into three classes: very slow, somewhat fast, and very fast. The infiltration rate class in 2017 was dominated by the very fast class, covering 36,958.40 ha (90.27%); the rather fast class, covering 3,679.18 ha (8.99%); and the very slow class (body of water), covering 305.88 ha (0.75%). In 2019, the infiltration distribution was dominated by the very fast class covering 36,284.56 ha (88.62%), the rather fast class covering 4,351.51 ha (10.63%), and the very slow class (body of water) covering 307.39 ha (0.75%). In 2021, the distribution of infiltration was dominated by the very fast class with an area of 35,547.69 ha (86.82%), the rather fast class with an area of 5,091.12 ha (12.43%), and the very slow class of 304.65 ha (0.74%). Meanwhile, in 2022, the infiltration rate class will be dominated by the very fast class covering 35,547.69 ha (86.82%), the rather fast class covering 5,091.12 ha (12.43%), and the very slow class covering 304.65 ha (0.74%).
Based on the results of the BAU 2025 scenario, the speedy class dominates the distribution of infiltration with an area of 35,413.23 ha (86.49%), the relatively fast class of 5,239.38 ha (12.8%), and the prolonged class (water body) with an area of 290.85 ha (0.71%). Meanwhile, in the RSP scenario, the high-speed category is dominated by 35,567.76 ha (86.87%), the relatively fast class is 4,864.98 ha (11.88%), and the prolonged class (body of water) is 510.78 ha (1.25%). Meanwhile, based on the LC scenario, the broadest distribution of infiltration is in the high-speed class, with an area of 40,604.33 ha (99.17%), and the prolonged class (body of water), with an area of 339.13 ha (0.83%) Figure 8 and Figure 9.
Random forest algorithms can be used for classification (discrete data) or regression (continuous data) [58]. This technique was chosen because of its ability to model non-linear relationships, handle multicollinearity, reduce model overfitting, and consider qualitative and quantitative variables [59]. The random forest consists of a bagging method with random feature selection to produce a decision tree, and each decision tree will predict the response or class. The final prediction result is calculated based on the average response of each tree. Compared to the single tree method, the bagging method in the random forest can reduce the variance in the estimation of the predictive function [60].
Map of infiltration distribution in the Sumber Brantas and Kali Konto sub-watersheds
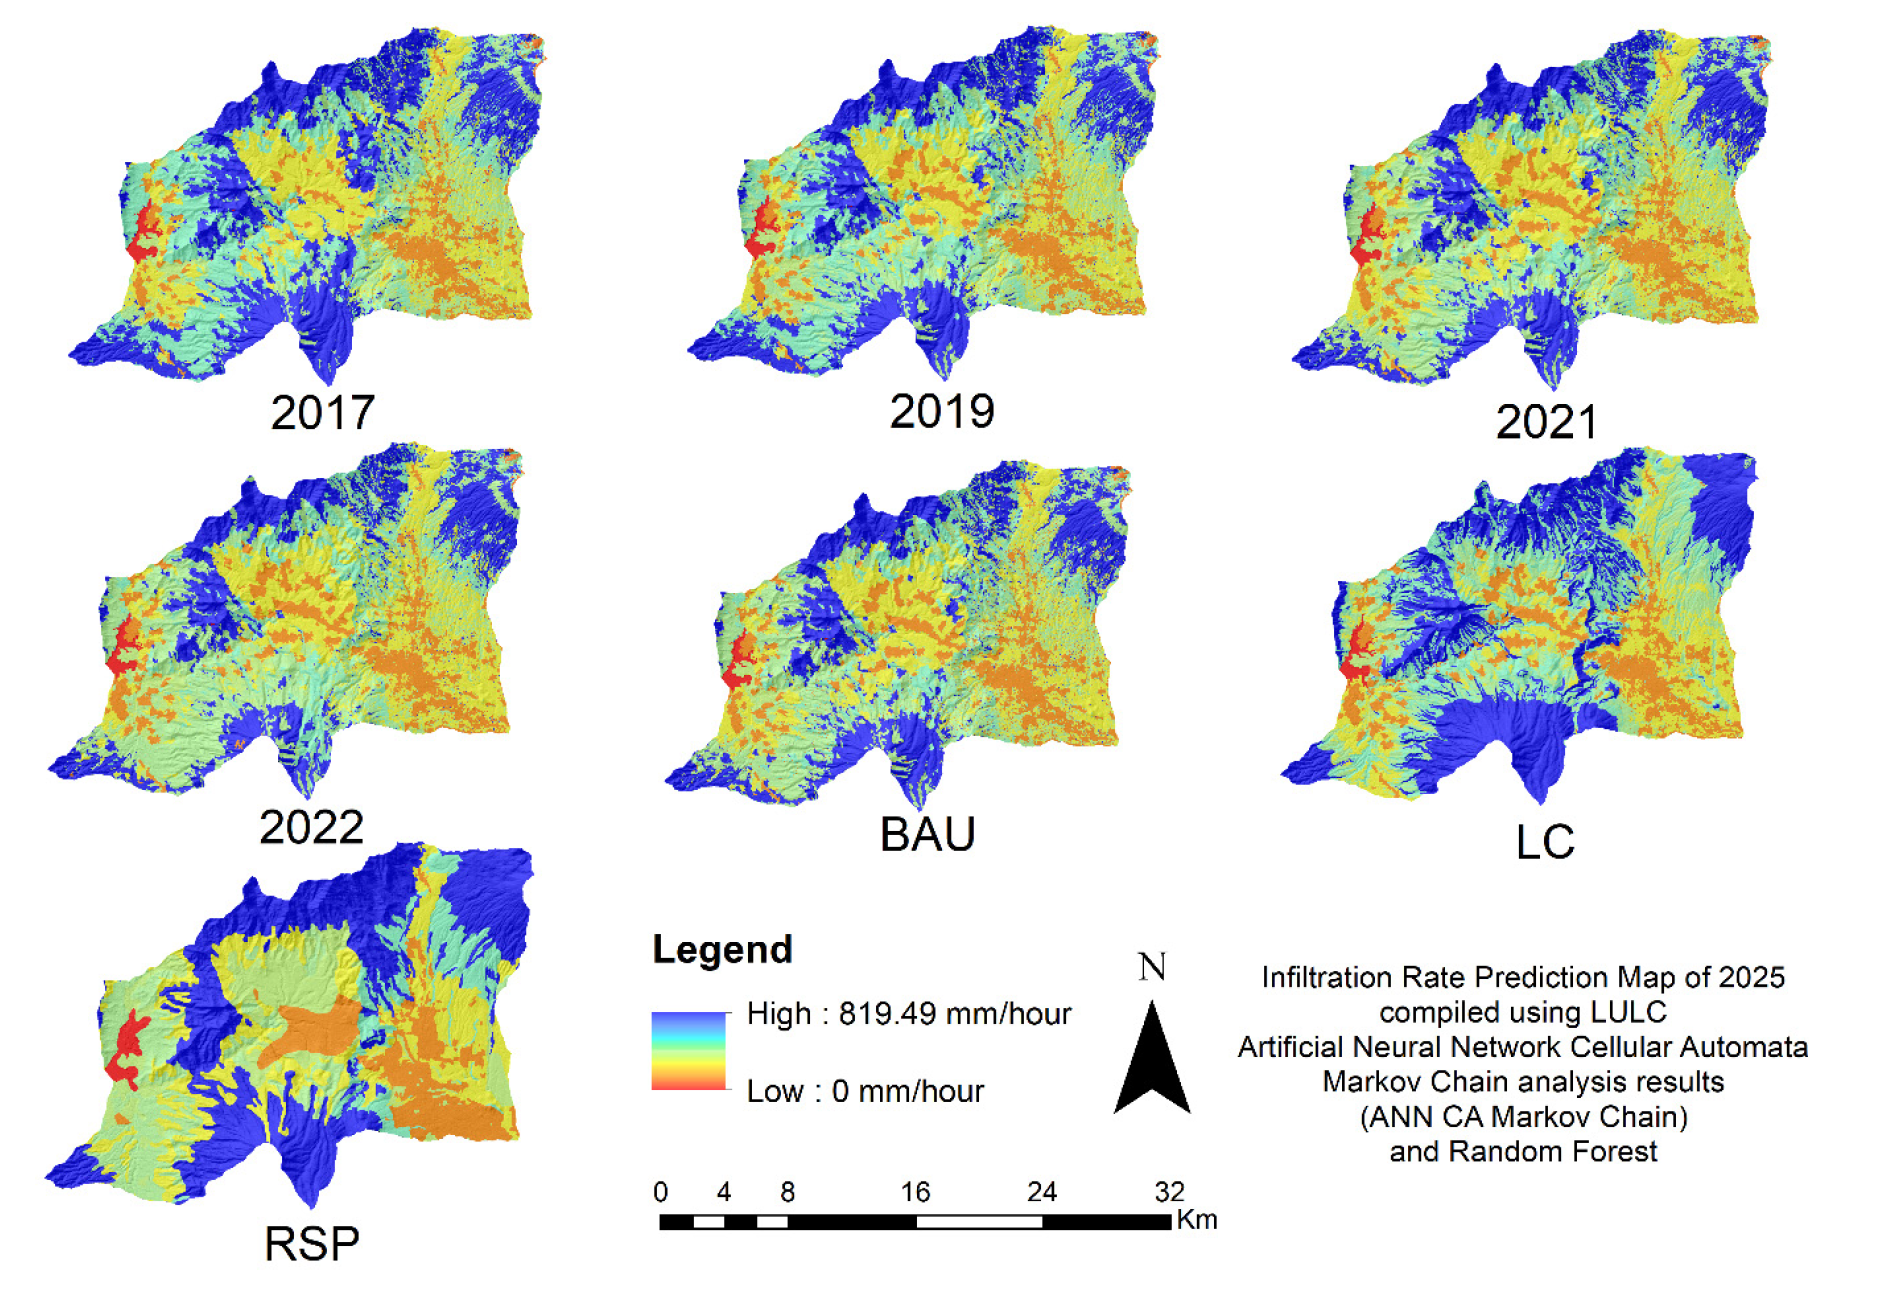
Map of infiltration rate classes in the Sumber Brantas and Kali Konto sub-watersheds
The validation test of the infiltration prediction model was carried out by comparing the results of infiltration predictions with the results of infiltration calculations in the field. The level of accuracy was calculated using the RMSE, NSE, and paired t-test methods. RMSE test results show a value of 51.73. While the results of the NSE test showed a value of 0.92, the model was considered good at predicting the distribution of infiltration [61]. Meanwhile, the paired t-test results show the value of t-count and t-table (0.02 and 1.81). It shows that the infiltration prediction results are not significantly different from the results of calculations in the field.
Baseline changes in land use in 2017–2022 will impact the distribution of soil infiltration. The area decreased in natural forest land and production forest, while the built-up area increased. This condition aligns with the decrease in the speedy infiltration rate class area while the relatively fast class continues to increase. The built-up area is synonymous with dense land and little vegetation, causing low soil porosity. The lower the porosity of the soil, the lower the opportunity for water to enter the soil [62]. In addition, the lack of vegetation and input of organic matter in built-up areas causes a lack of soil aggregation and protection of soil structure. As a result, the soil structure becomes unstable and easily damaged, inhibiting infiltration and permeability rates [63].
Land-use scenarios also influence the distribution of soil infiltration. The type of stand in each scenario determines the depth and distribution of plant roots, which affect the soil infiltration rate [64]. In the BAU scenario, plantation land and built-up areas experience an increase in area from previously forest land. This condition aligns with the class increase in the relatively fast infiltration rate, and the class decrease is speedy. Coffee plantations have macropores and higher infiltration rates than cane fields in volcanic soils in Costa Rica [65]. The land is increasingly covered with vegetation impact capacity and higher infiltration rates due to increased porosity and soil organic matter content [66]. Land in built-up areas experiences soil compaction due to the construction of buildings and human activities, so soil porosity is low.
The increase in forest area occurred in the RSP and LC scenarios, so the class area increased very quickly. In the LC scenario, the land use types only consist of natural forests, production forests, orchards, and dry fields with a speedy infiltration class. As a result, the infiltration rate class in the LC scenario is dominated by the speedy class. Land use with woody plant stands has a broader distribution of roots and more macropores, positively impacting soil infiltration [67]. Forests have a more complex canopy arrangement than other, more open land uses. The existence of the canopy can intercept falling water droplets and produce much litter on the ground surface. This impact protects the soil from splashing water and holding water from reaching the surface to maintain the infiltration rate and capacity [68]. The litter produced by the canopy is a food source for soil fauna. The activities of soil fauna make the soil structure more brittle, so water can more easily enter the soil [69].
The results of the implemented scenarios show differences in the distribution of infiltration rate predictions in each scenario. Scenarios with the highest infiltration rate distribution were obtained sequentially in the LC, BAU, and RSP scenarios. The three scenarios have areas with a very high infiltration rate class that are quite broad, but the highest area is in the LC scenario. Applying the LC scenario increased the area with a speedy infiltration class by 20 ha (0.06%) compared to the BAU scenario and 94 ha (0.26%) compared to the RSP scenario. The LC scenario focuses on the physical ability of the land to be utilised continuously by minimising land degradation [70]. Based on each scenario’s area, the LC scenario’s application can be used as a reference for developing regional spatial planning to maintain the infiltration rate in the Sumber Brantas and Kali Konto sub-watersheds.
The limitation of this article is that the research carried out was not compared to extreme dry seasons, so it is not known what the trends in the rate and extent of each level of infiltration are under these conditions. Apart from that, the infiltration value has only taken some years because it uses a baseline in 2022 to see the effect of land use. We suggest further research that will refer to this work to conduct it under several conditions (dry and wet seasons).
Several LULC scenarios in this study aim to determine the effect on the level of soil infiltration. The main driving factors for changes in LULC in the Sumber Brantas and Kali Konto sub-watersheds are a decrease in the area of natural forest and production forest and an increase in built-up area, which contributes to a decrease in the level of soil infiltration and has an impact on increasing surface runoff. The results of the BAU, RSP, and LC scenarios in this study provide information on the level of soil infiltration in the future. The BAU scenario reduced soil infiltration by 0.3%, while the RSP and LC scenarios increased soil infiltration by 0.05% and 14.22%, respectively. The LC scenario is the best land use scenario that can increase the area of soil infiltration in the Sumber Brantas and Kali Konto sub-watersheds. Infiltration distribution modelling has a high level of accuracy to provide accurate information about infiltration values in the field. Therefore, it can be used to determine the impact of various LULC scenarios on soil infiltration rates and as a basis for determining the best land use.
The authors acknowledge the work and support of the internal funding (PNBP) of the Faculty of Agriculture, University of Brawijaya, with contract number 4108.22/UN10.F04/PN/2022.
ft |
infiltration rate |
[cm h-1] |
∆h |
lowering of the water level |
[cm] |
∆t |
measurement time |
[h] |
ANN-CA |
Artificial Neural Network-Cellular Automata |
BAU |
Business as Usual |
GPS |
Global Positioning System |
LC |
Land Capability Class |
LULC |
Land Use Land Cover |
NSE |
Nash-Sutcliffe Model Efficiency Coefficient |
RMSE |
Root Mean Square Error |
RSP |
Regional Spatial Planning |
S2A |
Sentinel 2A |
- ,
Safety factor analysis of landslides hazard as a result of rain condition infiltration on Buyan-Beratan Ancient Mountain ,J. Phys. Conf. Ser. , Vol. 1402 (2),pp 022002 , 2019, https://doi.org/https://doi.org/10.1088/1742-6596/1402/2/022002 - ,
The era of infiltration ,Hydrol. Earth Syst. Sci. , Vol. 25 (2),pp 851–866 , 2021, https://doi.org/https://doi.org/10.5194/hess-25-851-2021 - ,
Effects of surface runoff and infiltration partition methods on hydrological modeling: A comparison of four schemes in two watersheds in the Northeastern US ,J. Hydrol , Vol. 581 ,pp 124415 , 2020, https://doi.org/https://doi.org/10.1016/j.jhydrol.2019.124415 - ,
Watershed Hydrological Responses to Changes in Land Use and Land Cover at Hangar Watershed, Ethiopia ,Iran. Iran. J. Energy Environ. , Vol. 11 (1),pp 1–7 , 2020, https://doi.org/https://doi.org/10.5829/ijee.2020.11.01.01 - ,
Effects of the morphological characteristics of plants on rainfall interception and kinetic energy ,J. Hydrol. , Vol. 592 ,pp 125807 , 2021, https://doi.org/https://doi.org/10.1016/j.jhydrol.2020.125807 - ,
Variation in soil surface roughness under different land uses in a small watershed on the Loess Plateau, China ,CATENA , Vol. 188 ,pp 104465 , 2020, https://doi.org/https://doi.org/10.1016/j.catena.2020.104465 - ,
Effects of land uses on soil physic-chemical properties and erodibility in collapsing-gully alluvial fan of Anxi County, China ,J. Integr. Agric. , Vol. 15 (8),pp 1863–1873 , 2016, https://doi.org/https://doi.org/10.1016/S2095-3119(15)61223-0 - ,
Global land use changes are four times greater than previously estimated ,Nat. Commun. , Vol. 12 (1),pp 2501 , 2021, https://doi.org/https://doi.org/10.1038/s41467-021-22702-2 - ,
Assessing hydrological and water quality responses to dynamic landuse change at watershed scale in Mississippi ,J. Hydrol. , Vol. 625 ,pp 129983 , 2023 - ,
Understanding changes in a Tropical Delta: A multi-method narrative of landuse/landcover change in the Niger Delta ,Ecol. Model. , Vol. 364 ,pp 53–65 , 2017, https://doi.org/https://doi.org/10.1016/j.ecolmodel.2017.09.012 - ,
The relationship between land use and climate change: A case study of Nepal ,Nat. Causes Eff. Mitig. Clim. Change Environ. , 2021, https://doi.org/https://doi.org/10.5772/intechopen.98282 - ,
Global land change from 1982 to 2016 ,Nature , Vol. 560 (77207720), 2018, https://doi.org/https://doi.org/10.1038/s41586-018-0411-9, Art. - ,
Dampak Alih Fungsi Lahan Terhadap Tata Ruang Kota Singkawang’, vol. 8, p. 8, 2016 (in Indonesian, ‘The Impact of Land Conversion on the Spatial Planning of Singkawang City’) ,Socioscientia J. Ilmu-ilmu Sos , Vol. 8(2) ,pp 193-200 , - ,
Spatial probability assessment of landslide considering increases in pore-water pressure during rainfall and earthquakes: Case studies at Atsuma and Mt. Umyeon ,CATENA , Vol. 187 ,pp 104317 , 2020, https://doi.org/https://doi.org/10.1016/j.catena.2019.104317 - ,
The Shared Socioeconomic Pathways and their energy, land use, and greenhouse gas emissions implications: An overview ,Glob. Environ. Change , Vol. 42 ,pp 153–168 , 2017, https://doi.org/https://doi.org/10.1016/j.gloenvcha.2016.05.009 - ,
Vintage urban planning in Italy: Land management with the tools of the mid-twentieth century ,Sustainability , Vol. 10 (11),pp 4125 , 2018, https://doi.org/https://doi.org/10.3390/su10114125 - ,
Land Property Rights, Agricultural Intensification, and Deforestation in Indonesia ,Ecol. Econ. , Vol. 147 ,pp 312–321 , 2018, https://doi.org/https://doi.org/10.1016/j.ecolecon.2018.01.021 - ,
Land use and climate change impacts on global soil erosion by water (2015-2070) ,Proc. Natl. Acad. Sci. , Vol. 117 (36),pp 21994–22001 , 2020, https://doi.org/https://doi.org/10.1073/pnas.2001403117 - ,
Assessment of Land Use Land Cover Changes and Future Predictions Using CA-ANN Simulation for Selangor, Malaysia ,Water , Vol. 14 (3),pp 402 , 2022, https://doi.org/https://doi.org/10.3390/w14030402 - ,
Estimating Land Use and Land Cover Change in North Central Georgia: Can Remote Sensing Observations Augment Traditional Forest Inventory Data? ,Forests , Vol. 11 ,pp 856 , 2020, https://doi.org/https://doi.org/10.3390/f11080856 - ,
Aplikasi Citra Sentinel-2 Untuk Pemetaan Tutupan Dan Peruntukan Lahan Pada Tingkat Desa’, (in Indonesian, ‘Sentinel-2 Image Application for Mapping Land Cover and Use at the Village Level’) ,J. Geogr. , Vol. 12 (02),pp 189 , 2020, https://doi.org/https://doi.org/10.24114/jg.v12i02.16970 - ,
Assessing variability of infiltration characteristics and reliability of infiltration models in a tropical sub-humid region of India ,Sci. Rep. , Vol. 10 (1),pp 1515 , 2020, https://doi.org/https://doi.org/10.1038/s41598-020-58333-8 - ,
Mapping seabed sediments: Comparison of manual, geostatistical, object-based image analysis and machine learning approaches ,Cont. Shelf Res. , Vol. 84 ,pp 107–119 , 2014, https://doi.org/https://doi.org/10.1016/j.csr.2014.05.004 - ,
Interactive impacts of climatic, hydrologic and anthropogenic activities on watershed health ,Sci. Total Environ. , Vol. 648 ,pp 880–893 , 2019, https://doi.org/https://doi.org/10.1016/j.scitotenv.2018.08.004 - ,
Predicting land-use change: Intercomparison of different hybrid machine learning models ,Environ. Model. Softw. , Vol. 145 ,pp 105207 , 2021, https://doi.org/https://doi.org/10.1016/j.envsoft.2021.105207 - ,
Landslide Risk Analysis on Agriculture Area in Pacitan Regency in East Java Indonesia Using Geospatial Techniques ,Environ. Nat. Resour. J. , Vol. 19 (22), 2021, https://doi.org/https://doi.org/10.32526/ennrj/19/2020167, Art. - ,
Hydrological response to future land-use change and climate change in a tropical catchment ,Hydrol. Sci. J. , Vol. 63 (9),pp 1368–1385 , 2018, https://doi.org/https://doi.org/10.1080/02626667.2018.1511054 - ,
Soil infiltration rates are underestimated by models in an urban watershed in central North Carolina, USA ,J. Environ. Manage. , Vol. 313 ,pp 115004 , 2022, https://doi.org/https://doi.org/10.1016/j.jenvman.2022.115004 - ,
Klasifikasi Tutupan Lahan Berdasarkan Random Forest Algorithm Menggunakan Cloud Computing Platform ,J. Apl. Stat. Komputasi Stat. , Vol. 14 (11), 2022, https://doi.org/https://doi.org/10.34123/jurnalasks.v14i1.383, Art. - ,
A Brief Review of Random Forests for Water Scientists and Practitioners and Their Recent History in Water Resources ,Water , Vol. 11 (55), 2019, https://doi.org/https://doi.org/10.3390/w11050910, Art. - ,
Impact of Land Use Land Cover (LULC) Change on Surface Runoff in an Increasingly Urbanised Tropical Watershed ,Water Resour. Manag. , Vol. 33 (12),pp 4087–4103 , 2019, https://doi.org/https://doi.org/10.1007/s11269-019-02320-w - Pusat Vulkanologi dan Mitigasi Bencana Geologi - Badan Geologi, 2022, https://vsi.esdm.go.id/index.php/gerakan-tanah/kejadian-gerakan-tanah/3840-laporan-pemeriksaan-banjir-bandang-di-kota-batu-provinsi-jawa-timur, Accessed: Jun. 02
- , Assessment of hydrological alteration from 1996 to 2017 in Brantas watershed, East Java, Indonesia, J. Water Land Dev., 2020
- ,
Modeling soil landscapes and soil textures using hyperscale terrain attributes ,Geoderma , Vol. 402 ,pp 115177 , 2021, https://doi.org/https://doi.org/10.1016/j.geoderma.2021.115177 - ,
Assessment Of The Impacts Of Land Use On Water Quality Of Brantas Upstream, Batu City, Indonesia ,J. Environ. Eng. Sustain. Technol. , Vol. 4 (11), 2017, https://doi.org/https://doi.org/10.21776/ub.jeest.2017.004.01.4, Art. - ,
Pemetaan Partisipatif LULC dan Kebakaran Hutan Bersama Masyarakat DAS Mikro Gumandar-Kedawung ,Dikmas J. Pendidik. Masy. Dan Pengabdi. , Vol. 2 (44), 2022, https://doi.org/https://doi.org/10.37905/dikmas.2.4.1053-1068.2022, Art. - ,
Multi-temporal image analysis for LULC classification and change detection ,Eur. J. Remote Sens. , Vol. 54 (sup2),pp 189–199 , 2021 - ,
Predictive Land Use Change under Business-As-Usual and Afforestation Scenarios in the Vea Catchment, West Africa ,Int. J. Adv. Remote Sens. GIS , Vol. 8 ,pp 3011–3029 , 2019, https://doi.org/https://doi.org/10.23953/cloud.ijarsg.416 - ,
Analysis of drought hazards in agricultural land in Pacitan Regency, Indonesia ,SAINS TANAH - J. Soil Sci. Agroclimatol. , Vol. 17 (11), 2020, https://doi.org/https://doi.org/10.20961/stjssa.v17i1.35688, Art. - ,
Analisis Dan Prediksi Perubahan Tutupan Lahan Menggunakan Model Celular Automata-Markov Chain Di Das Wae Ruhu Kota Ambon’ (in Indonesian, ‘Analysis and Prediction of Land Cover Change Using the Cellular Automata-Markov Chain Model in the Wae Ruhu River, Ambon City’) ,J. Tanah Dan Sumberd. Lahan , Vol. 9 (22), 2022, https://doi.org/https://doi.org/10.21776/ub.jtsl.2022.009.2.9, Art. - ,
Metode inventarisasi sumber daya lahan’, (in Indonesian, ‘Method of inventory of land resources’) ,Andi Yogyak. , Vol. 298 , 2007 - ,
Rencana Tata Ruang Wilayah (RTRW) Berdasarkan Daya Dukung Lingkungan Berbasis Kemampuan Lahan ,(in Indonesian, ‘Regional Spatial Planning (RTRW) Based on Environmental Carrying Capacity Based on Land Capability’), agriTECH , Vol. 34 (44), 2015, https://doi.org/https://doi.org/10.22146/agritech.9442, Art. - ,
Soil Conservation Service US Department of Agriculture , (210), 1961, Land-capability classification - ,
Effect of Land Cover Differences on Soil Infiltration at UB Forest, Karangploso Malang ,J. Tanah Dan Sumberd. Lahan , Vol. 9 (1),pp 131–139 , 2022, https://doi.org/https://doi.org/10.21776/ub.jtsl.2022.009.1.14 - ,
Sifat fisik tanah dan metode analisisnya , 2006 - ,
The Impact of the Variability of Precipitation and Temperatures on the Efficiency of a Conceptual Rainfall-Runoff Model ,Slovak J. Civ. Eng. , Vol. 24 (4),pp 1–7 , 2016, https://doi.org/https://doi.org/10.1515/sjce-2016-0016 - ,
Comparative Assessment of the Unsupervised Land Use Classification by Using Proprietary GIS and Open Source Software ,IOP Conf. Ser. Earth Environ. Sci. , Vol. 540 (1),pp 012020 , 2020, https://doi.org/https://doi.org/10.1088/1755-1315/540/1/012020 - ,
Accuracy Assessment of Land Use/Land Cover Classification Using Remote Sensing and GIS ,Int. J. Geosci. , Vol. 08 (04), 2017, https://doi.org/https://doi.org/10.4236/ijg.2017.84033, Art. 04 - ,
The role of social infrastructure services in developing the city centre planning: A framework for delivering sustainable cities in Jordan ,Ain Shams Eng. J. , Vol. 13 (6),pp 101800 , 2022, https://doi.org/https://doi.org/10.1016/j.asej.2022.101800 - Aplikasi Penginderaan Jauh dan Sistem Informasi Geografis Untuk Pemodelan dan Pemetaan Data Biofisik Lahan. UGM PRESS, 2021, 2022, https://books.google.co.id/books?id=piwTEAAAQBAJ, Accessed: Jun. 02
- Analisis Kelas Kemampuan Lahan Sebagai Penentu Kesesuaian Penggunaan Lahan di Kabupaten Sidoarjo, 20152022, https://jsal.ub.ac.id/index.php/jsal/article/view/214, Art.Accessed: Dec. 17
- , Analisa pengaruh sifat fisik tanah terhadap laju infiltrasi air’, (in Indonesian, ‘Analysis of the influence of soil physical properties on water infiltration rate’), presented at the Prosiding Seminar Nasional Teknik UISU (SEMNASTEK), 2019
- ,
Study of soil infiltration rate in some land uses at Desa Tanjung Putus Kecamatan Padang Tualang Kabupaten Langkat ,J. Rekayasa Pangan Dan Pertan. , Vol. 1 (1),pp 115–119 , 2012 - ,
Pengaruh perubahan penggunaan lahan terhadap rezim hidrologi DAS (Studi kasus: DAS Komering)’, (in Indonesian, ‘The influence of land use changes on watershed hydrological regimes (Case study: Komering Watershed)’) ,J. Tek. Sipil , Vol. 24 (1),pp 91–98 , 2017 - ,
Perbedaan Laju Infiltrasi Pada Lahan Hutan Tanaman Industri Pinus, Jati Dan Mahoni’, (in Indonesian, ‘Differences in Infiltration Rates in Pine, Teak and Mahogany Industrial Plantation Forests’) ,J. Sumberd. Alam Dan Lingkung. , Vol. 1 (22), 2014, Art. - ,
Pengaruh Sifat Fisik Tanah pada Konduktivitas Hidrolik Jenuh di 5 Penggunaan Lahan (Studi Kasus di Kelurahan Sumbersari Malang)’, (in Indonesian, ‘The Influence of Soil Physical Properties on Saturated Hydraulic Conductivity in 5 Land Uses (Case Study in Sumbersari Village, Malang)’) ,agriTECH , Vol. 33 (33), 2013, https://doi.org/https://doi.org/10.22146/agritech.9557, Art. - ,
Effect of soil physical properties on soil infiltration rates’, presented at the Journal of Physics: Conference Series ,IOP Publishing ,pp 012020 , 2022, https://doi.org/https://doi.org/10.1088/1742-6596/2314/1/012020 - ,
Modeling depth of the redox interface at high resolution at national scale using random forest and residual gaussian simulation ,Water Resour. Res. , Vol. 55 (2),pp 1451–1469 , 2019, https://doi.org/https://doi.org/10.1029/2018WR023939 - ,
Machine Learning’s Dropout Training is Distributionally Robust Optimal ,arXiv , 2021, https://doi.org/https://doi.org/10.48550/arXiv.2009.06111, Apr. 14 - ,
Identifying subsurface drainage using satellite Big Data and machine learning via Google Earth Engine ,Water Resour. Res. , Vol. 55 (10),pp 8028–8045 , 2019, https://doi.org/https://doi.org/10.1029/2019WR024892 - ,
Performance of two prevalent infiltration models for disturbed urban soils ,Hydrol. Res. , Vol. 48 (6),pp 1520–1536 , 2017, https://doi.org/https://doi.org/10.2166/nh.2017.217 - ,
Fine roots determine soil infiltration potential than soil water content in semi-arid grassland soils ,J. Hydrol. , Vol. 578 ,pp 124023 , 2019, https://doi.org/https://doi.org/10.1016/j.jhydrol.2019.124023 - ,
Effects of poultry manure on soil infiltration, organic matter contents and maise performance on two contrasting degraded alfisols in southwestern Nigeria ,Int. J. Recycl. Org. Waste Agric. , Vol. 8 ,pp 73–80 , 2019, https://doi.org/https://doi.org/10.1007/s40093-019-0273-7 - ,
Hydrological response to agricultural land use heterogeneity using variable infiltration capacity model ,Water Resour. Manag. , Vol. 34 (12),pp 3779–3794 , 2020, https://doi.org/https://doi.org/10.1007/s11269-020-02630-4 - ,
Effects of land use on soil properties and hydrological processes at the point, plot, and catchment scale in volcanic soils near Turrialba, Costa Rica ,Geoderma , Vol. 315 ,pp 138-148 , 2018, https://doi.org/https://doi.org/10.1016/j.geoderma.2017.11.044 - ,
The effects of land use change on soil infiltration capacity in China: A meta-analysis ,Sci. Total Environ. , Vol. 626 ,pp 1394-1401 , 2018, https://doi.org/https://doi.org/10.1016/j.scitotenv.2018.01.104 - ,
Infiltration-friendly agroforestry land uses on volcanic slopes in the Rejoso Watershed, East Java, Indonesia ,Land , Vol. 9 (8),pp 240 , 2020, https://doi.org/https://doi.org/10.3390/land9080240 - ,
Shrub encroachment enhances the infiltration capacity of alpine meadows by changing the community composition and soil conditions ,Catena , Vol. 213 ,pp 106222 , 2022, https://doi.org/https://doi.org/10.1016/j.catena.2022.106222 - ,
Analysis of soil physical properties and infiltration rates for various landuses at Gunung Dahu Research Forest, Bogor District, West Java Province ,IOP Conf. Ser. Earth Environ. Sci. , Vol. 713 (1),pp 012034 , 2021, https://doi.org/https://doi.org/10.1088/1755-1315/713/1/012034 - ,
Classification Of Land Capability In Manokwari Area Using Geographic Information System (GIS) ,J. Infrastruktur , Vol. 6 (22), 2020, https://doi.org/https://doi.org/10.35814/infrastruktur.v6i2.1721, Art.