


The atmospheric concentration of carbon dioxide (CO2) rose by 50% compared to values of 1750 due to human activities [1]. The consumption of fossil fuels is the main reason for the rising atmospheric CO2 concentration and a cause of climate change.
Renewable fuels can mitigate climate change by substituting fossil-based energy carriers [2]. Two of the most important fuels in the energy system are methane, the major component of natural gas, and methanol [3]. Methane is currently used in various applications, such in the chemical industry and for heating of buildings [4]. Methanol is primarily used as an important platform chemical for the chemical industry and can potentially be used as fuel for the shipping industry [5].
Both fuels can be produced with renewable electricity, CO2 and Hydrogen (H2). Renewable electricity is essential to reach emission reduction compared to fossil fuels. The usage of a grid-connected electricity has the advantage of a high number of full-load hours because grid electricity is always available. However, it must be considered that 39% of the EU’s electricity is still based on fossil fuels [6]. A hybrid energy model using mainly PV and wind can also reach a high number of full load hours. Access to the grid has only the reason for the hybrid energy model to ensure the supply of electricity in times of low wind or sunlight availability, for example in winter in Central Europe [7].
An often-named motivation in literature for the production of synthetic methane (e-methane) is the storage of excess electricity because large gas storage facilities exist in Europe [8]. However, from an economic point of view it will be very challenging to compete with other storage solutions for electricity [9]. The production and use of e-methane can also serve for the defossilization in district-based energy systems as energy storage in a novel district heating approach [10]. Another motivation for e-methane and also e-methanol is the solution for hard-to-abate sectors such as aviation and shipping [11]. It is commonly agreed upon that direct electrification of all sectors cannot be achieved with current technologies [12].
The European Union aims to ensure that the production of e-methane and e-methanol is achieved in a sustainable manner. The sources of CO2 will therefore be restricted by the delegated acts supplementing the recast of the Renewable Energy Directive II [13]. Carbon capture and utilization (CCU) using CO2 from fossil-based electricity production and industrial sources will not count as emission avoidance from 2036 and 2041. Only four sources of CO2 will remain in the long term. Biomass-based CO2 is one of these sustainable CO2 sources.
Bioenergy plays a crucial role in the energy system by offering flexibility services and contributing to energy security [14]. The potential for biogenic CO2 in the European Union was investigated because a target for biomethane production of 35 billion cubic meters was announced for the year 2030 [15]. In addition to biomethane production, the pulp and paper industry and biomass-based district heating were investigated as they belong to the most relevant sectors of biomass utilization [16]. The capacity of most biomethane and district heating plants using biomass is less than 10 MW [17]. An exception are large-scale pulp mills. Most pulp mills (72.2%) produce ≥ 100 kt product per year, corresponding to 270 kg CO2/t pulp [18]. However, these large-scale applications are not the focus of this work.
In the past, in many publications such as from Lopes et al. [19], the focus was on large industrial point sources from steel or cement manufacturing. The utilization of biomass-based CO2 gains more attention in the research based on the delimitation of sources for CO2. However, a Scopus search for the term bioenergy carbon capture and utilization showed remarkably lower results than the umbrella term CCU. Further research on this topic is required.
Nevertheless, there exist also papers on the usage of biomass-based CO2 for CCU. Koytsoumpa et al. [20] analyzed the potential of solid, liquid and gaseous biofuels without pulp and paper mills. Kuparinen et al. [14] investigated the usage of CO2 from pulp and paper mills. Cellulose from wood is used for paper production, but other carbon fractions, mainly lignin, are burned to generate heat and power, resulting in CO2 release [21]. Eggemann et al. [22] conducted a life cycle assessment for e-methanol production using CO2 from biogas plants. Schmid and Hahn [23] show a holistic picture of Germany’s CO2 supply and demand, including biomass-based CO2 sources. Jafri et al. [24] demonstrated that processes including CCU can enhance the amount of biogenic carbon that is converted to an energy carrier and contribute to large-scale greenhouse gas (GHG) emission reduction. Nonetheless, a disparity exists between the options that are socially optimal and those that are most economically viable.
The core objective of this paper is to investigate the utilization of CO2 from biomass-based processes for the production of e-methane and e-methanol. The goal is to derive scenarios for cost reductions from learning rates of electrolysis, methanation and methanol synthesis to analyze the future prospects for production costs. Finally, by comparing e-methane and e-methanol with the utilization of hydrogen in economic terms and technical aspects, this work becomes a new contribution to the scientific literature.
This work is based on the idea of using carbon dioxide from biomass-based processes as a sustainable source for fuel production. The following steps were conducted in the analysis:
Literature research was conducted to analyze the potential of CO2 from biomass processes in the EU with an outlook to 2030. The costs of CO2 capture were derived from the literature.
Hydrogen is required to produce the intended products. The costs for hydrogen were calculated with the levelized-cost method.
The hydrogen costs were then used as input for the overall e-methane and e-methanol production costs.
Finally, a SWOT analysis was conducted to compare e-methane, e-methanol, and hydrogen process chains, considering the economic assessment results and technical aspects.
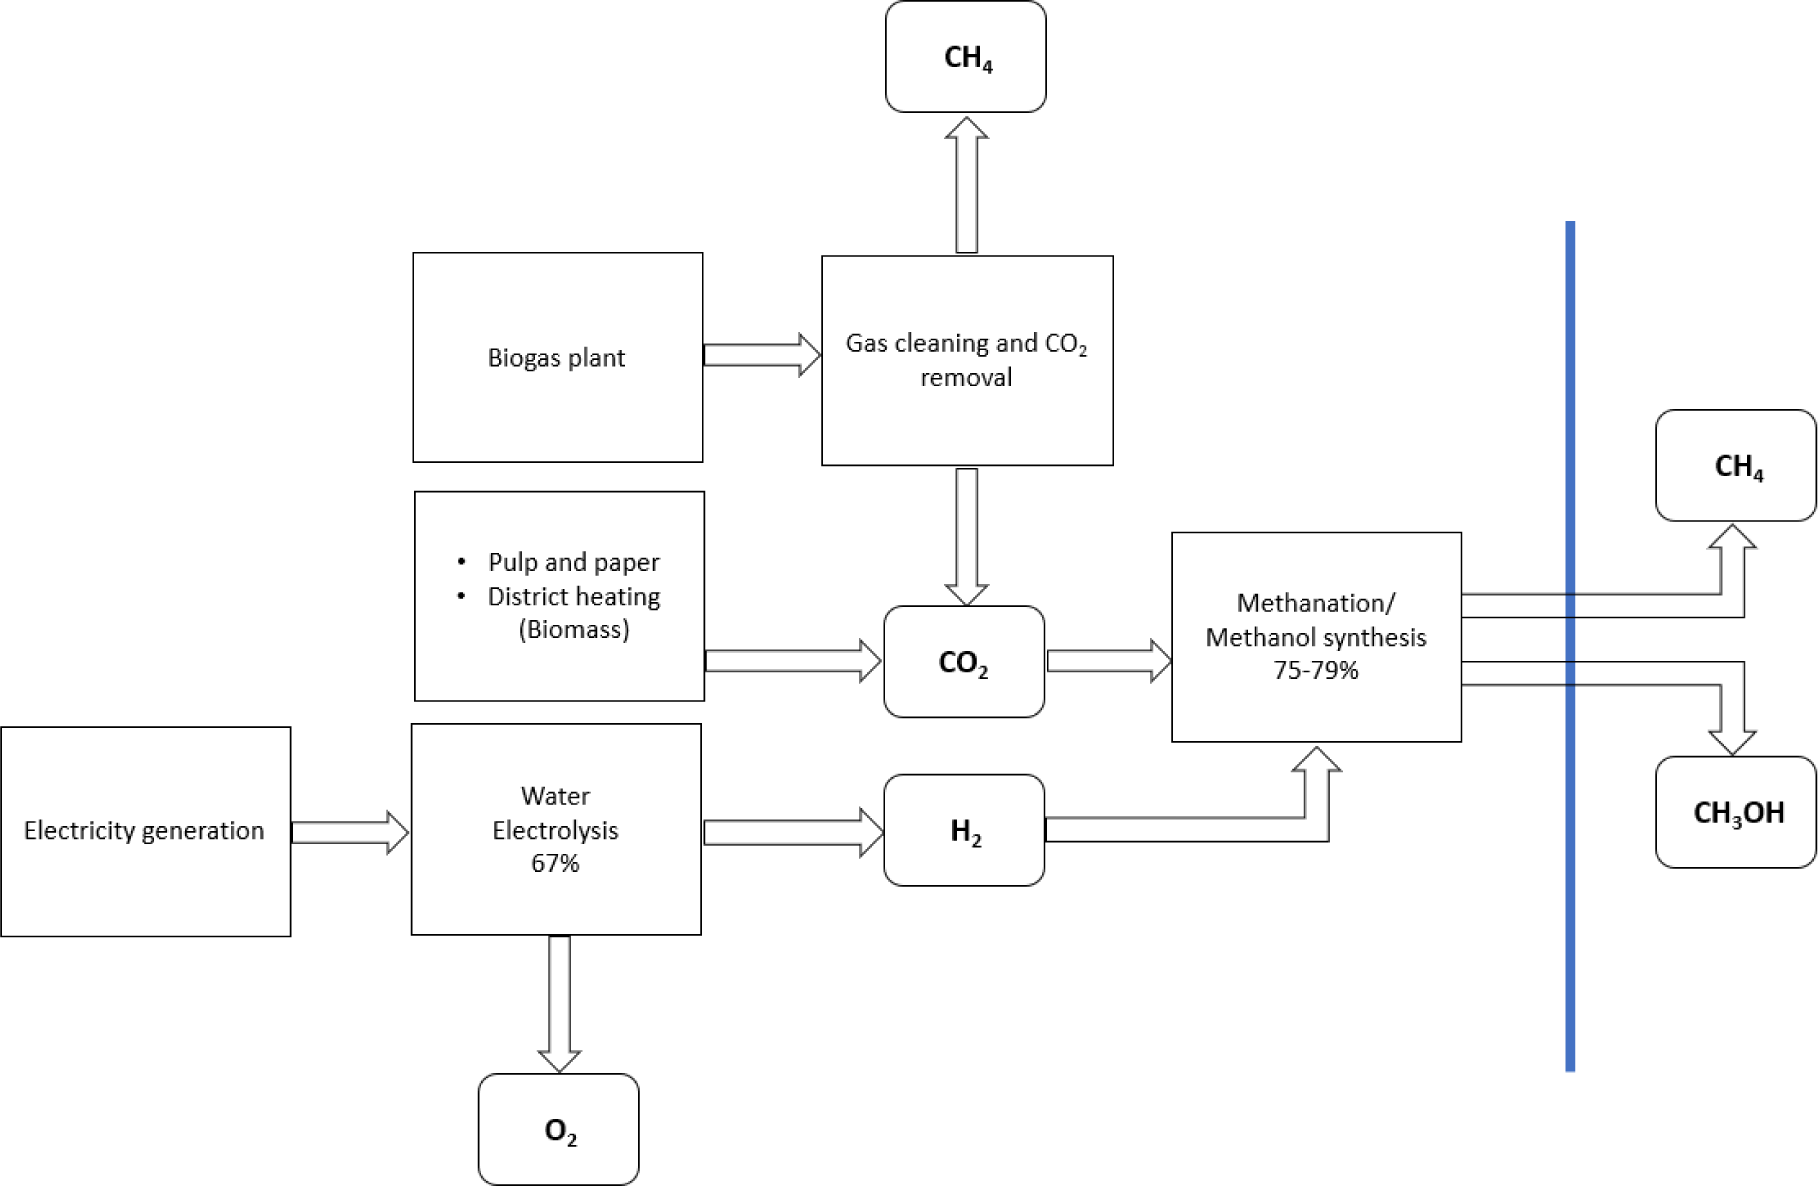
Figure 1 shows the schematic process chains for e-methane and e-methanol production via CO2 utilization [19]. Methanation and methanol synthesis are conducted as separate processes after CO2 capture and hydrogen production [20]. The energy efficiency of water electrolysis was assumed to be 67% [27] and the overall process efficiencies of e-methane and e-methanol production are 49 and 53%.
Process routes of utilizing CO2 for e-methane and e-methanol production
Alkaline and proton exchange membrane (PEM) electrolyzers are currently the most used technologies for hydrogen production via water splitting [27]. There are issues involved with the exclusive use of renewable energy, for example, the low number of full load hours and challenges in flexible fuel production.
PEM electrolyzers were initially favored over alkaline electrolyzers for renewable electricity sources because they were thought to respond better to the intermittent behavior of the renewables [28]. However, in papers such as Bos et al. [25] and Ince et al. [29], alkaline electrolyzers were also coupled with wind turbines or a PV plant without the application of hydrogen storage. In this work, both electrolyzers were compared and it was assumed that hydrogen storage can be avoided.
Table 1 shows the technical parameters for the analysis. It was assumed that both electrolyzers have the same energy efficiency of 67%, as the literature gives a broad range. The efficiency is expected to increase to 74% in 2050 [27]. Electricity consumption for compression of e-methane was also considered in the case of grid injection. For the efficiency of methane synthesis, a value of 75% [30] and 90% CO2 conversion was assumed. The maximum value theoretically achieved by the methanation with CO2 and H2 is 82.8% at the maximum possible thermodynamic efficiency of the Sabatier reaction.
Technical parameters for the H2, e-methane and e-methanol production
| Technical parameters | VALUE | UNIT | SOURCE |
|---|---|---|---|
| Electrolyzer eff. | 67 | % | [27] |
| Methanation eff. | 75 | % | [30] |
| Methanol synthesis eff. | 79 | % | [31] |
| CO2 conversion rate | 90 | % | [32] |
| FLH (Grid) | 8000 | hours | [7] |
| FLH (Renewables) | 1000-2600 | hours | [33], [34] |
| CH4 compression | 0.22 | kWh/kg | [35] |
| Water consumption | 9-10 | kg/kg H2 | [36] |
The goal is to model the production costs of the investigated energy carriers by 2050. The investment cost reductions depend on the scenarios of electrolyzer capacities. A sensitivity analysis was used to examine the influence of different parameters, such as the plant size on the overall production costs. The results are shown in EUR2022/ MWh.
The production costs of hydrogen, e-methane and e-methanol were calculated with eqs. (1) and (2) based on Thunman et al. [37].
The operating period and interest rate are considered within the capital recovery factor, eq. (3). Electrolyzer and methanation or methanol synthesis reactor investment costs are considered in the overall production costs of the respective product:
(1)
(2)
(3)
c(H2) = production costs of hydrogen [EUR/MWh], ce−meth = production costs of e-methane or e-methanol [EUR/MWh], CRF = capital recovery factor, IC(H2) = electrolyzer investment costs [EUR/MW], FLH = full-load hours, c(H2O) = costs for water [EUR/MWh],ICe−meth = investment costs for a methanation or methanol synthesis reactor [EUR/kW],Com = fixed operating and maintenance costs [EUR/kW], cele = electricity costs, η = energy efficiency of the process, cvar = variable costs [EUR/MWh], cCO2 = costs for CO2 [EUR/MWh], n = plant lifetime, r = depreciation rate.
Table 2 shows the parameters for the economic analysis. The investment costs of the electrolyzers include all system components and installation. These costs decrease in regards to the scale [27]. The investments used in this study for 2 MWel alkaline and PEM electrolyzers are 1400 and 1800 EUR/kWel and for 20 MWel 900 and 1400 EUR/kWel respectively [38]. Fees for the connection to the grid were added to these costs. The stacks need to be replaced after ten years, accounting for 50% and 60% of the system costs of an alkaline and PEM electrolyzer. Carbon capture costs as EUR/t CO2 were included in the analysis as variable costs [39]. The assumption was that the e-methane and e-methanol producers would cover the costs of implementing carbon capture, for example, at a pulp and paper mill.
Parameters for the economic analysis of e-methane and e-methanol production
| Economic parameters | VALUE | UNIT | SOURCE |
|---|---|---|---|
| Investment costs | |||
| Alkaline electrolyzer | 900-1400 | EUR/kWel | [38] |
| PEM electrolyzer | 1400-1800 | EUR/kWel | [38] |
| Methanation | 2200-4300 | EUR/kWout | [40], [41] |
| Methanol | 2560-4250 | EUR/kWout | [42] |
| Fixed Operating & Maintenance | |||
| Electrolysis | 28-56 | EUR/kWout | [43] |
| Methanation | 3.5 | % of IC | [43] |
| Methanol synthesis | 5 | % of IC | [43] |
| Grid connection fees | 70 | EUR/kWel | [44] |
| Variable costs | |||
| Water costs | 3.1 | EUR/L | [45] |
| CO2 capture Biomethane | 20-40 | EUR/t CO2 | [39] |
| CO2 capture Pulp&paper/ District heating | 60-90 | EUR/t CO2 | [46] |
| Electricity costs (Grid) | 90 | EUR/MWh | [47] |
| Electricity costs (Wind) | 45 | EUR/MWh | [43], [48] |
| Electricity costs (PV) | 74 | EUR/MWh | [43], [48] |
| Other parameters | |||
| Discount rate | 6 | % | [49] |
| Depreciation time | 20 | years | [50] |
The investment costs of the methanation and methanol reactor represent the total costs, including plant installation [25]. The system costs were adapted to 2022 price levels using the chemical engineering plant index. It is important to notice that the investment costs for electrolyzers are stated for the electricity input in kWel, whereas for the methanation and methanol synthesis in product output kWout.
Technological learning can lead to lower costs per kW installed. The learning rate gives the percentual cost reduction per doubling of unit output. The range of learning rates in literature varies tremendously. Schoots et al. [51] analyzed the historical learning rates of electrolyzer equipment and defined a value of 18 ± 13%. Detz et al. [38] used a low rate of 12 % and a high learning rate of 20% for their analysis. Reksten et al. [52] estimated high learning rates of 25-30% for alkaline and PEM electrolyzers. The main argument for these high rates is that the scaling up has not been considered in previous publications. However, the highest learning rate for a technology in history has been seen for PV panels with 22% [53].
The applied learning rates are derived from Böhm et al., who assessed different learning rates of the main electrolyzer components. The difference in this work is that a learning rate of 18% was only used for the electrolyzer stacks. Other parts such as power electronics were assumed to be the conventional share and account for 50% and 40% of alkaline and PEM electrolyzer investment costs. Technological learning was not applied for the conventional components [53]. Stacks also need to be produced more often than the other components because the current stack lifetime is approximately ten years [27].
For the methanation section, a learning rate of 10% was found in the literature [50]. The same value was used for the methanol synthesis. The equipment typically accounts for approximately 20% of the system cost and technological learning is rather derived from the plant engineering and project-specific costs [37].
The total investment costs, eq.(4), consist of the conventional and new components. The cost reductions are calculated with the eqs. (5) and (6). The learning rates are only applied to the share of new components:
(4)
(5)
(6)
ICnew = investment costs of new components, ICconv = investment costs of conventional components, IC(t)= investment costs of a unit at time t, Y(t)= installed capacity at time t, LR = learning rate, b= parameter for the extent of learning measured.
Table 3 shows the installed capacities for electrolyzers, methanation and methanol production. At the end of 2022, approximately 690 MW electrolyzer capacities were installed globally. This number shall increase to 2200 MW at the end of 2023 [54]. For the 1.5 °C climate target an increase to 550 GW in 2030 is proposed by the IEA. However, there can be some restrictions for this tremendous growth. For example, the current iridium mining makes only 3-5 GW of PEM electrolyzers installations per year possible [27].
Therefore, two different scenarios were investigated for capacity installations of hydrogen. One is the business as usual (BAU) scenario with historic growth rates of 2015-2022 [55], extrapolated for 2030 and 2050. The growth scenario is based on the Global Hydrogen Review 2023, where 175 GW in 2030 are feasible to reach and 3670 GW is the target for 2050. Currently, 2/3 of the total installed electrolyzers are alkaline, PEM accounting for approximately 1/3 and high-temperature solid oxide electrolyzers (SOE) for less than 1%. This ratio is supposed to change in the investigated scenarios to 40:40:20 for alkaline, PEM and SOE in 2050 [27].
Installed hydrogen, methanation and methanol synthesis capacities in 2022, 20230 and 2050. The growth is based on literature data from the IEA and the BAU scenario was extrapolated based on historic capacity additions from 2015 to 2022
| Year | 2022 | 2030 | 2050 | Source |
|---|---|---|---|---|
| H2_Growth | 0.69 GW | 175 GW | 3670 GW | [54] |
| H2_BAU | 0.69 GW | 22 GW | 445 GW | [55] |
| Methanation | 30 GW | 65 GW | 450 GW | [56] |
| Methanol synthesis | 76 GW | 118 GW | 345 GW | [31] |
Methanation and methanol capacities are already established more widely than water electrolysis but based on fossil fuels as resources. For methanation and methanol production 25 GW and 71 GW were installed globally in 2020 and this number is expected to grow to 450 GW [56] and 345 GW (500 Mt) in 2050 [31].
The growth and BAU scenarios results are shown for the investment cost developments derived from technological learning. In the following sections, only the growth scenario will serve as the basis for the e-methane and e-methanol production costs. The BAU case will not provide enough hydrogen capacities to fulfill the green e-methane and e-methanol production targets in 2050.
From the literature analysis, the individual variables are expected to show different effects on the overall production costs of e-methane, e-methanol and hydrogen. Therefore, the following sensitivity analyses were conducted and the variables were modified in a range of ± 50%:
Reductions in electrolyzer, methanation and methanol synthesis reactor investment costs depended on the learning rates. The base cases for learning rates are 18% for electrolyzers and 10% for methanation/ methanol synthesis.
Hydrogen production costs in relation to the full-load hours or electricity price
Investigation of different variables on e-methane production costs: The initial value of operating hours was changed to 5000 hours, the capture costs to 60 EUR/t CO2 and a scale of 5 MW was chosen for the sensitivity analysis to depict a broad range of the variables. Other input data was not modified and used as stated in Tables 1 and 2.
The effect of carbon taxes on current market prices of fossil natural gas and methanol was also investigated as part of the sensitivity analysis. Emission factors of 297 g CO2/kg natural gas [57] and 197 g CO2/kg fossil methanol [58] cover the direct and indirect emissions resulting from sourcing, handling and the consumption. The externalities of fossil fuel use were not reflected adequately in previous times. Therefore, the European Union adopted an emission trading system to set a price on carbon emissions of businesses. Carbon prices are very effective measures to restrict the use of fossil fuels and support alternatives [59].
The SWOT analysis can describe the status quo and strategies for the future can be derived. This analysis aims to compare the technical aspects found in literature and results from the economic assessment for the three different fuels since hydrogen can also be directly used as fuel [60].
This section starts with the biomass-derived CO2 potentials in Europe. Afterwards, H2, e-methane and e-methanol production costs are presented, followed by the sensitivity and SWOT analysis.
According to the Biomethane Industrial Partnership [15], the goal is to reach 35 billion cubic meters (bcm) of sustainable biomethane production capacity in 2030 in the EU. Biomethane is produced through anaerobic digestion which is an effective strategy to recover bioenergy from different types of biowastes [61]. To obtain biomethane, impurities and CO2 must be removed [62]. At the mentioned target capacity, approximately 41-69 Mt CO2/a will be generated.
The direct emissions of the European pulp and paper industry were 28 Mt CO2 in 2021 [18]. A yearly decline of approximately 1.1% could be observed since 1991, resulting in approximately 25 Mt direct CO2 emissions in 2030. However, based on wood consumption, which showed a slightly increasing tendency since 2000, 152 million cubic meters of consumption were reached in 2021. The lignin content of softwood lies in the range of 27-32% [63] and 18-25% in hardwood [64]. When the carbon from the lignin is emitted, the rate of on-site emission reduction cannot continue this way. It was assumed that the process flows in the pulp and paper mills remain as they are for the scope of this publication.
The biggest amount of biogenic CO2 is coming from district heating. Figure 2 shows the relation of CO2 potential derived from the three sectors. It is assumed that the quantities of 99 Mtoe [65] of solid biofuels used for heating and/ or electricity generation will not decrease in the near future. Assuming 5 kWh/kg dry wood and an average carbon content of 42-47% [66] this corresponds to a total amount of 230 Mt/ a biomass, meaning approximately 354-396 Mt CO2/a. These numbers correspond to technical potentials of 208-243 billion cubic meter e-methane or 248-290 Mt e-methanol assuming minimum 90% carbon capture rate [67] and 90% CO2 conversion rate in the fuel production process.
Estimated CO2 potentials from biomethane production, pulp and paper and solid biofuel use for heating and electricity generation in 2030. Sources: [12], [15], [42]
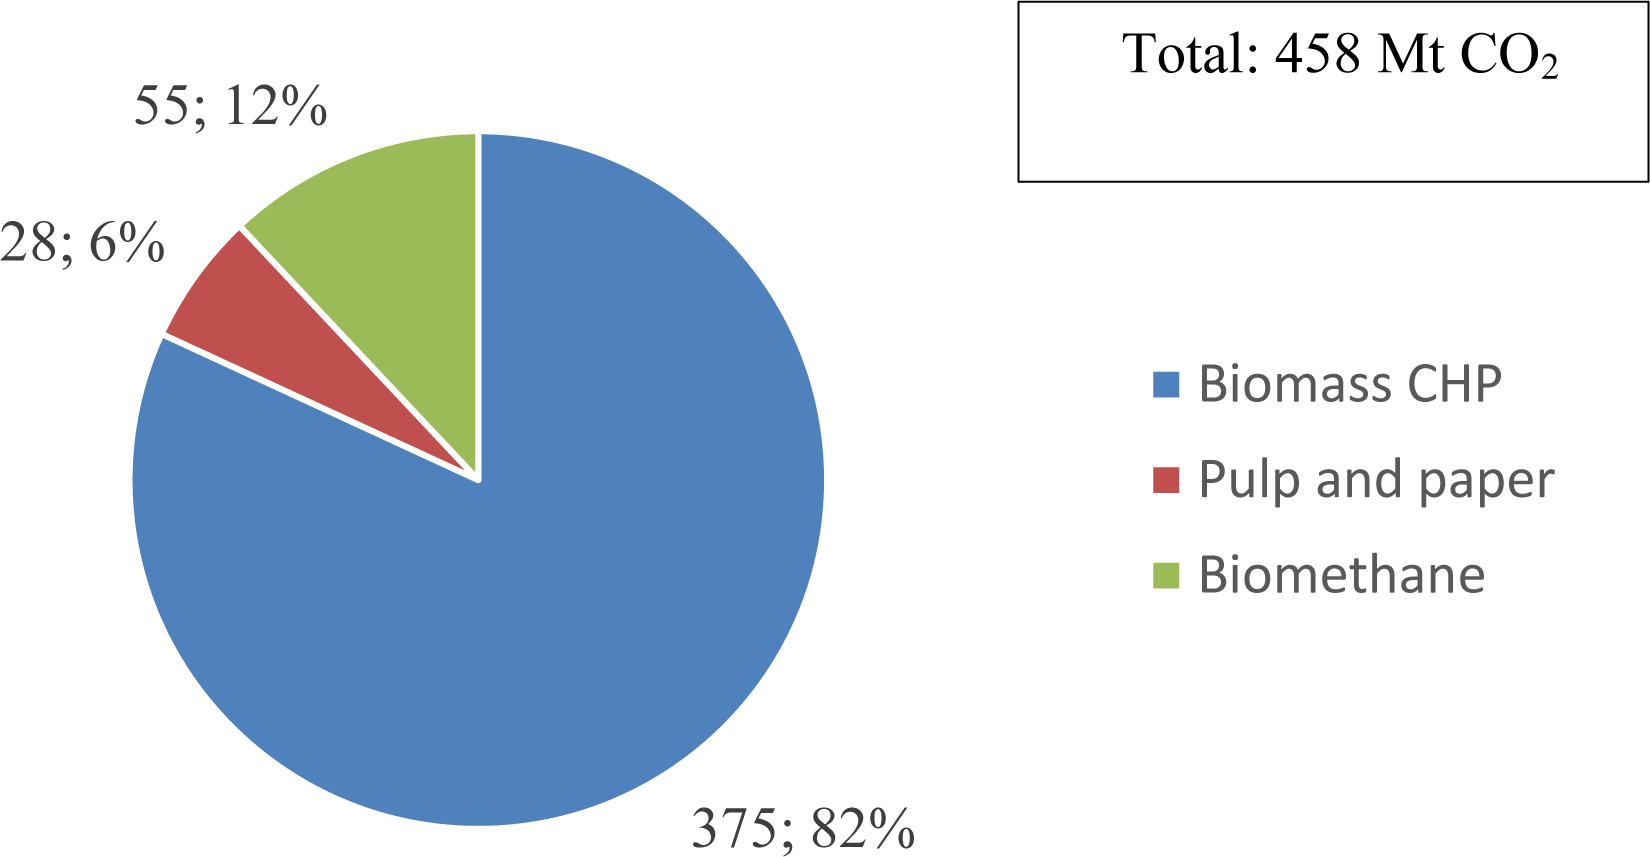
Table 4 and Figure 3 displays the results of the investment and overall system costs for the expansion scenarios. The investment costs in 2050 for the electrolyzers depend on the scenario and decrease for alkaline electrolyzers by 31-36% and for PEM electrolyzers by 41-46%. However, the difference between the growth and the BAU scenario is smaller than expected. Although the installed capacity is almost eight times higher, the investment costs differ only by 7-9%. This is mainly due to the conventional part becoming the dominant share of costs. However, the capacities of electrolyzers in the BAU scenario are insufficient for the expected capacities of e-methane and e-methanol in 2050. A substantial increase in capacity additions is needed to reach the defossilization targets. The cost reductions for the total system in the growth scenario are 32-38% for e-methane and 24-30% for e-methanol. The values of the growth scenario are the input used for the calculation of the overall e-methane and e-methanol production costs in the following sections. The initial system costs for e-methane and e-methanol production are almost similar on the 1 MW scale, but as the capacity additions of methanation reactors increase stronger compared to methanol synthesis, so will the costs be approximately 20% lower in 2050.
Total system cost and investment cost reductions for e-methane, e-methanol and electrolyzers up to 2050
Electrolyzer investment and total system costs in 2050 compared to 2022. The learning rates for electrolyzers are 18% and for methanation/ methanol synthesis 10%
| Year | 2022 | 2050 | Unit |
|---|---|---|---|
| H2 Growth | |||
| Alkaline (2-20 MW) | 900-1400 | 495-770 | EUR/kW |
| PEM (2-20 MW) | 1400-1800 | 620-810 | EUR/kW |
| H2 BAU | |||
| Alkaline (2-20 MW) | 900-1400 | 535-830 | EUR/kW |
| PEM (2-20 MW) | 1400-1800 | 680-880 | EUR/kW |
| E-methane (1 MW) | 5700-6100 | 3910-3950 | EUR/kW |
| E-methane (10 MW) | 3100-3600 | 2105-2230 | EUR/kW |
| E-methanol (1 MW) | 5650-6050 | 4325-4365 | EUR/kW |
| E-methanol (10 MW) | 3460-3960 | 2635-2760 | EUR/kW |
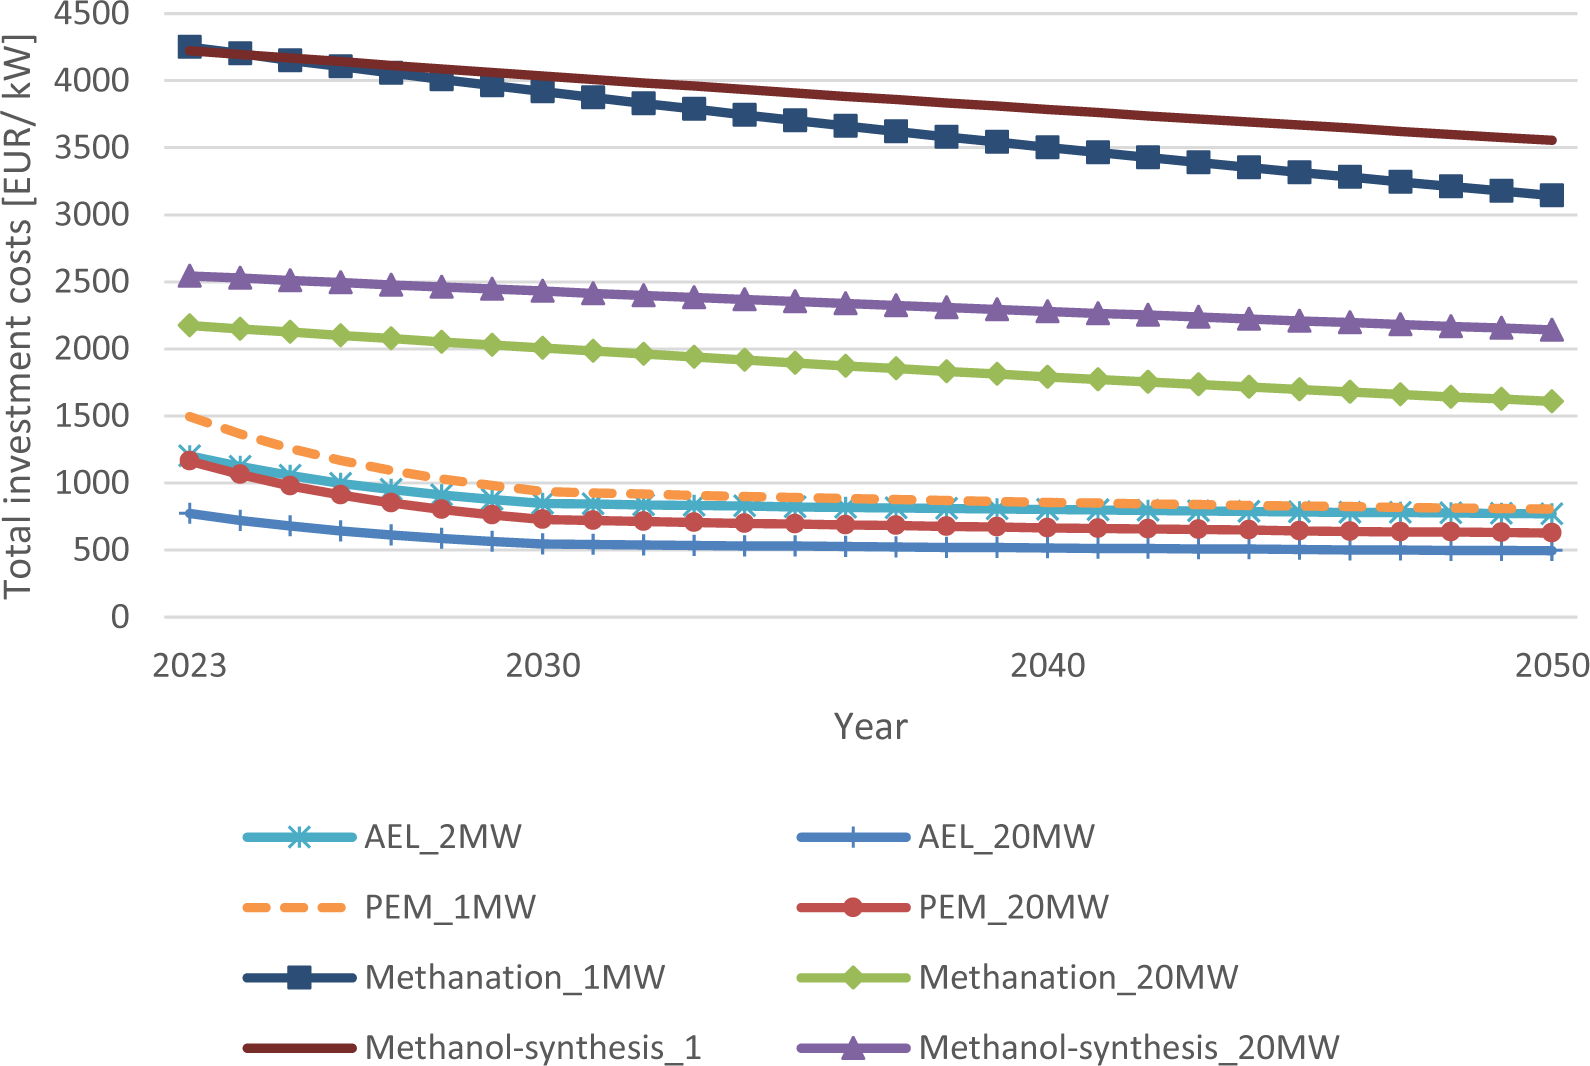
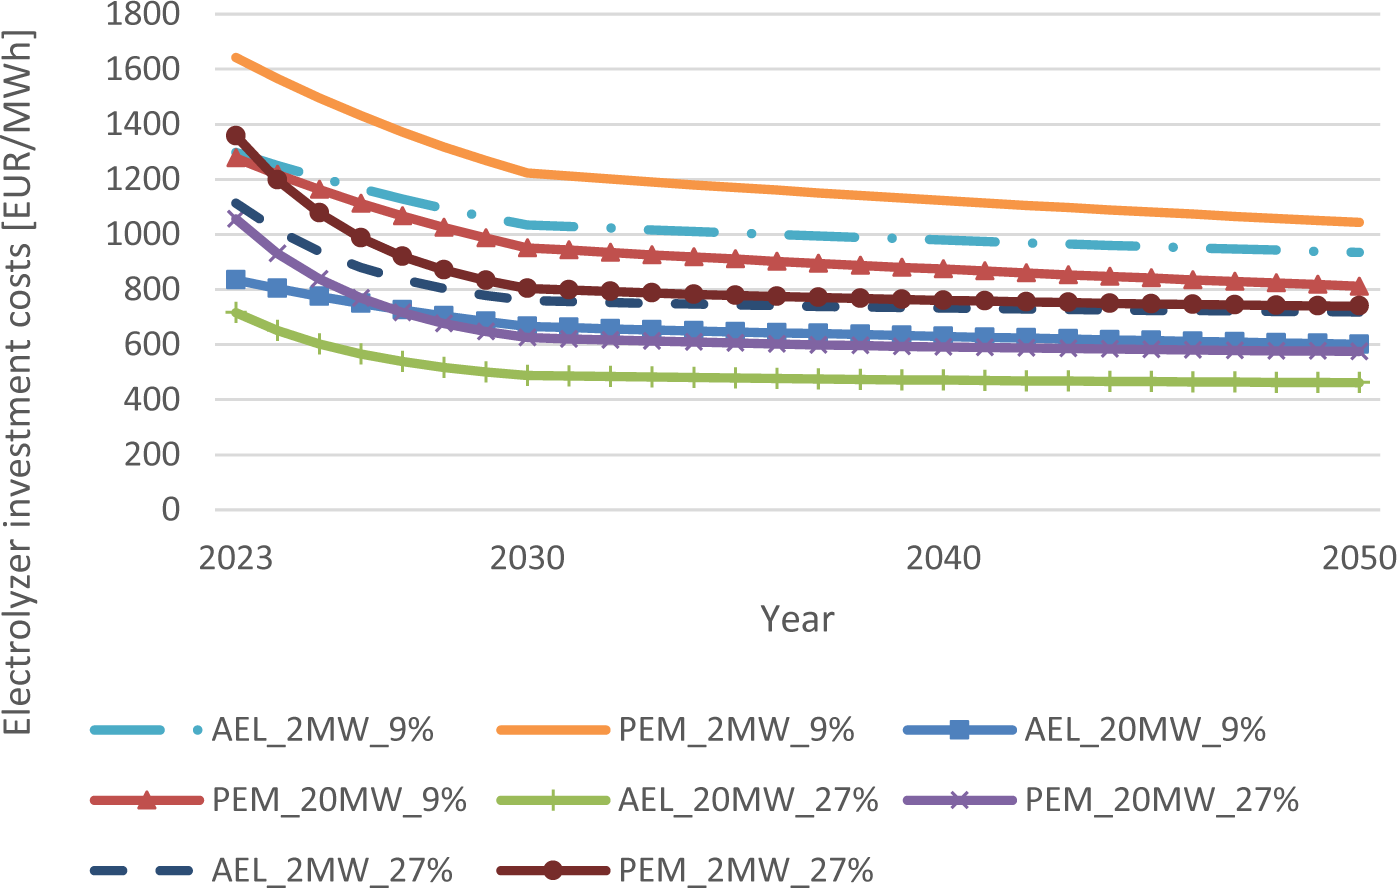
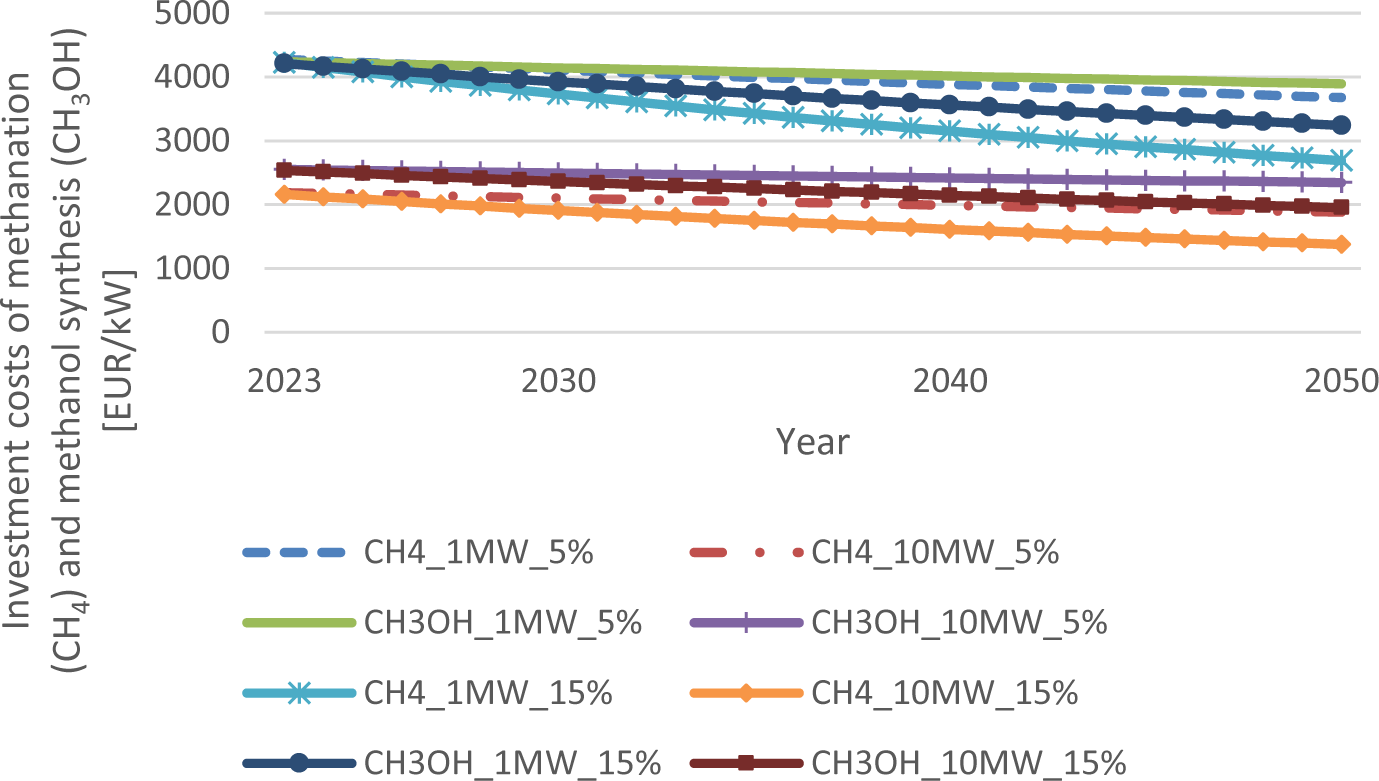
The sensitivity analysis of the learning rates is shown in this chapter to have an overview on the results regarding the investment costs. Figure 4 and Figure 5 show the respective investment costs in relation to high or low learning rates of electrolyzers, methanation and methanol synthesis.
Investment cost reductions of alkaline (AEL) and proton exchange (PEM) electrolyzers up to 2050 for 9% (low) or 27% (high) learning rates
Investment cost reductions of methanation (CH4) and methanol synthesis (CH3OH) up to 2050 for 5% (low) or 15% (high) learning rates
The production costs for hydrogen significantly depend on the full-load hours among other variables. Figure 6 shows current hydrogen production costs in the growth scenario for 20 MWel electrolyzers in relation to the full-load hours, which are technology specific.
Hydrogen production costs in relation to the full load hours at 90 EUR/MWh electricity price
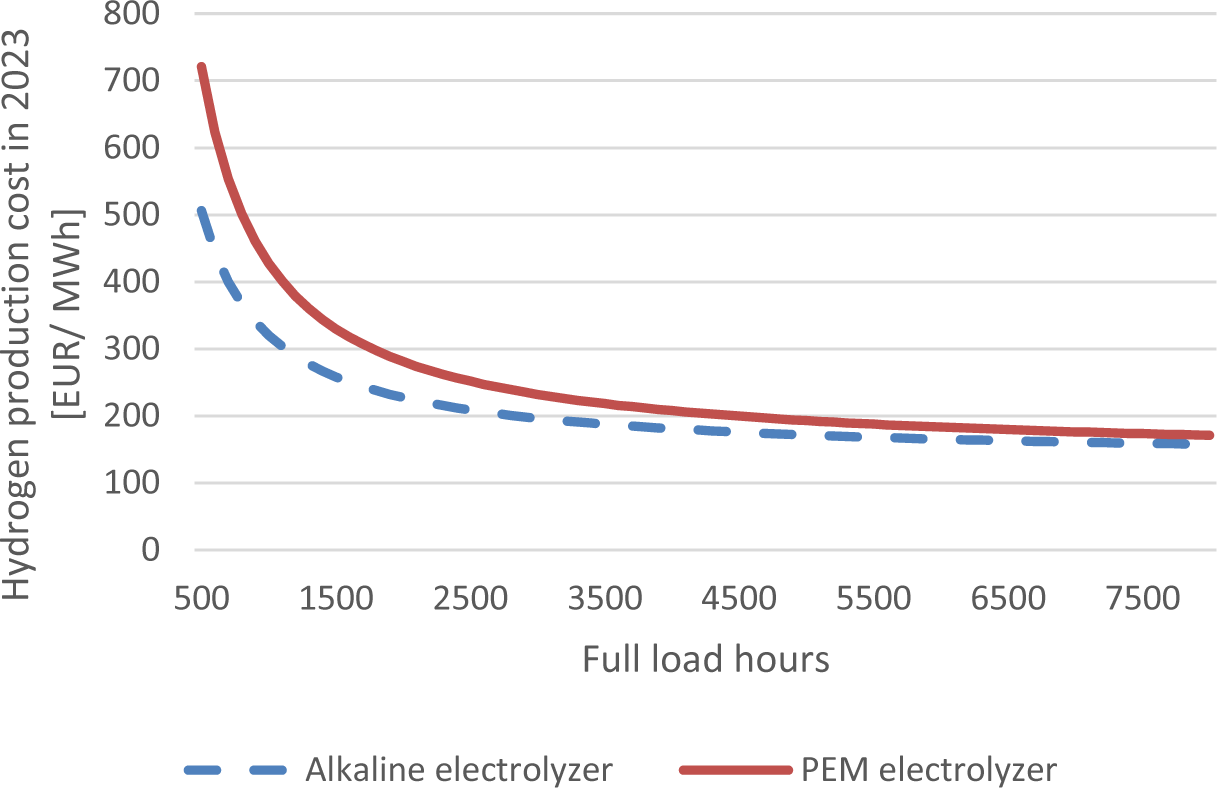
In the case of 1000 FLH, which is typical for PV in Central Europe, the costs are 102%-150% higher compared to 8000 FLH. At typical values of 2600-2900 FLH for onshore wind, the production cost increases by 26-44%. However, this evaluation did not consider the trade-off of faster degradation of the electrolyzer stacks with more FLH.
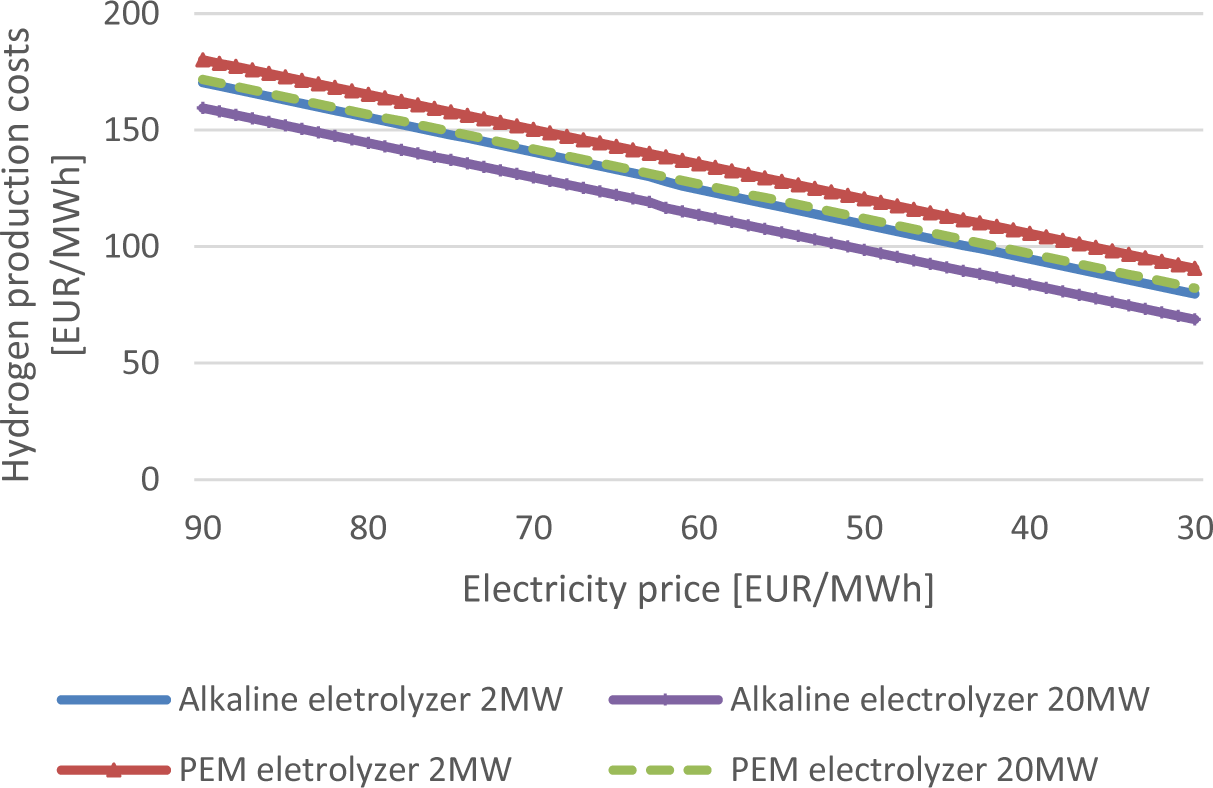
The electricity price was modified in Figure 7 to visualize the impact of this essential parameter on the hydrogen production costs.
Hydrogen production costs in relation to the electricity price at 8000 FLH
The effect of the scale on the production costs can be seen in Figure 8 and is lower than expected in this work although the total system costs for e-methane and e-methanol are 3135 EUR/kW and 3890 EUR/kW for a 10 MW plant compared to 5590 EUR/kW and 5565 EUR/kW for a 1 MW plant. The used system costs were conservative assumptions based on recent publications which showed higher values than what was estimated in previous papers.
The total production costs will be reduced by 5-10% in 2023 from a 1 MW plant to the 10 MW scale. In 2050 the difference between the sizes accounts for 5-7%. The reason is that other variables affect the production costs more than the scale, which will be shown in the sensitivity analysis results.
The current production costs decrease by 17-22% in 2050. The production costs in 2050 are still too high to be cost competitive under these assumptions. Production costs can be reduced with accounting for revenues for off-heat and oxygen. Oxygen sales can be a valuable revenue stream. However, it is questionable if all the oxygen from electrolyzers can be sold on the market.
Current production costs of e-methane and e-methanol compared to 2050
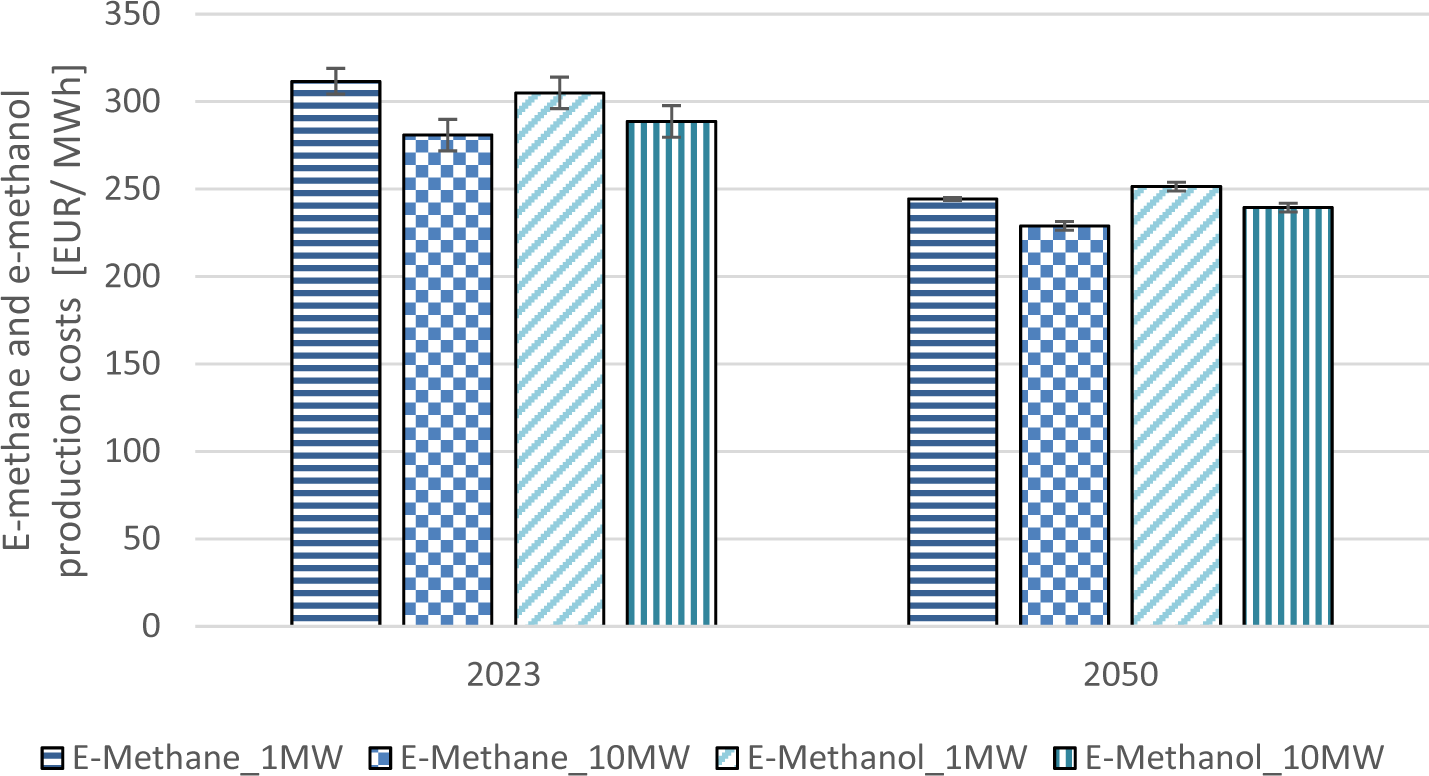
Figure 9 displays the overall production costs of e-methane, e-methanol and hydrogen. The lowest values are seen for hydrogen among the three fuels. Currently the grid-connected electrolyzer leads to the lowest production costs. However, wind-based hydrogen production will already show better economic performance in 2030, assuming that the grid electricity price is 90 EUR/MWh, as mentioned in the methodology. The wind-based hydrogen production costs are currently 6 EUR/kg H2 and will fall to 4 EUR/kg H2 in the growth scenario.
Development of e-methane, e-methanol and hydrogen production costs using either electricity generated by wind turbines or from the grid
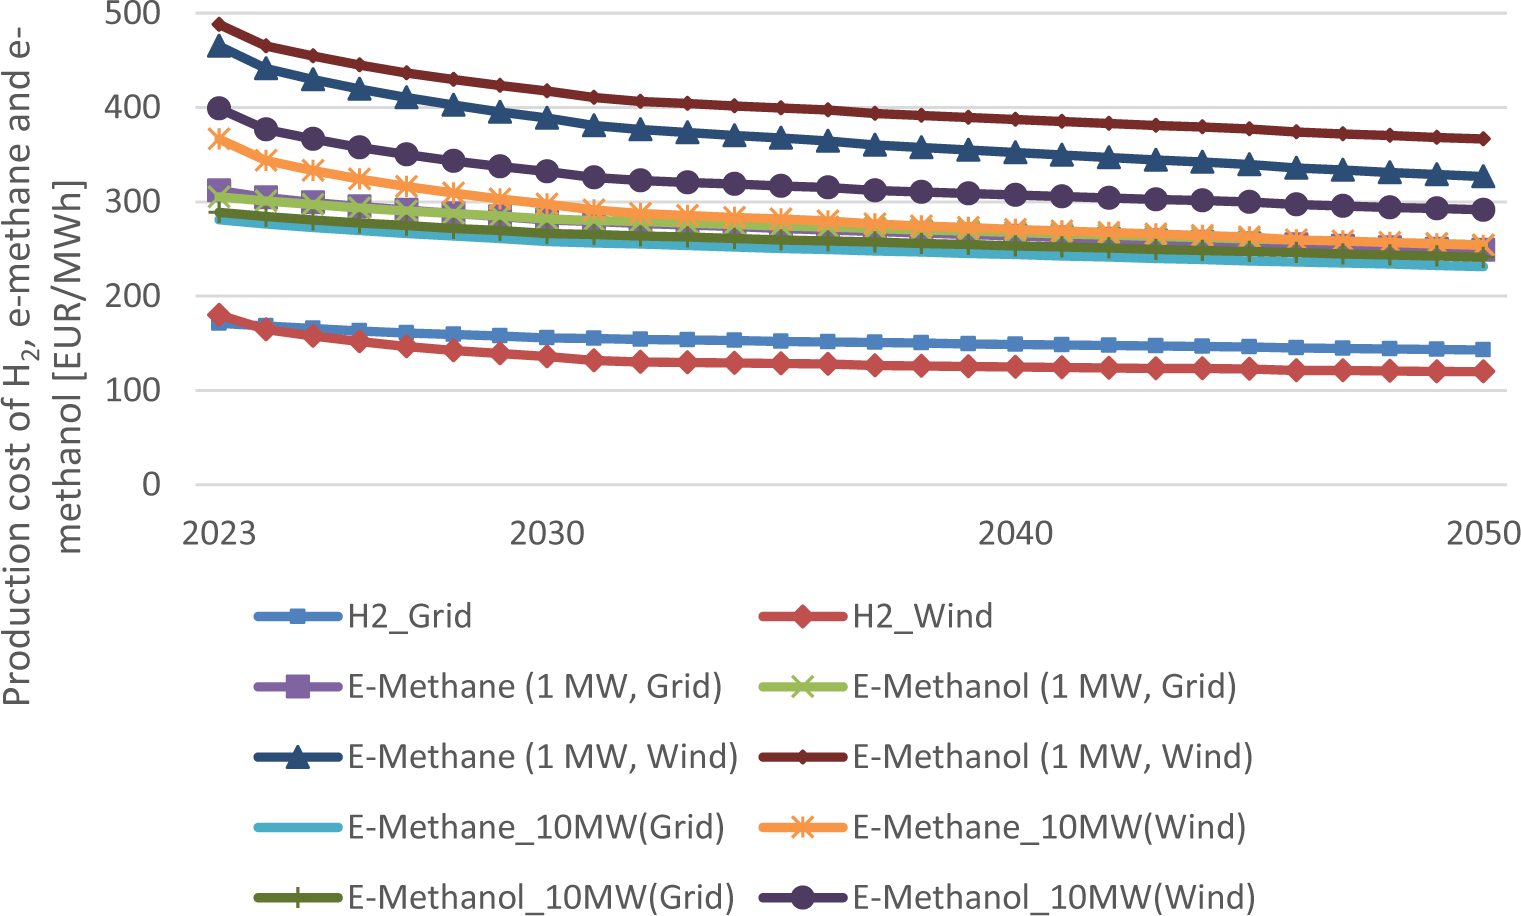
The costs for wind-based e-methane and e-methanol are on the contrary 15-47% (2030) and 6-45% (2050) higher than for the grid-connected electrolyzer.
Production costs for PV-based production costs were also calculated, however, not shown here, because they are the highest still at the scale of 10 MW with 470-510 EUR/MWh for e-methane and 570-610 EUR/MWh for e-methanol in 2050. PV plants as the only electricity source in the process chain are unfavorable in Central Europe mainly due to the low FLH, thereby increasing the capital costs significantly.
An alkaline electrolyzer can also be coupled with a PV plant as in the work of Ince et al. [29]. However, the efficiency of the electrolyzer was less than 60%, which is not favorable from an economic point of view.
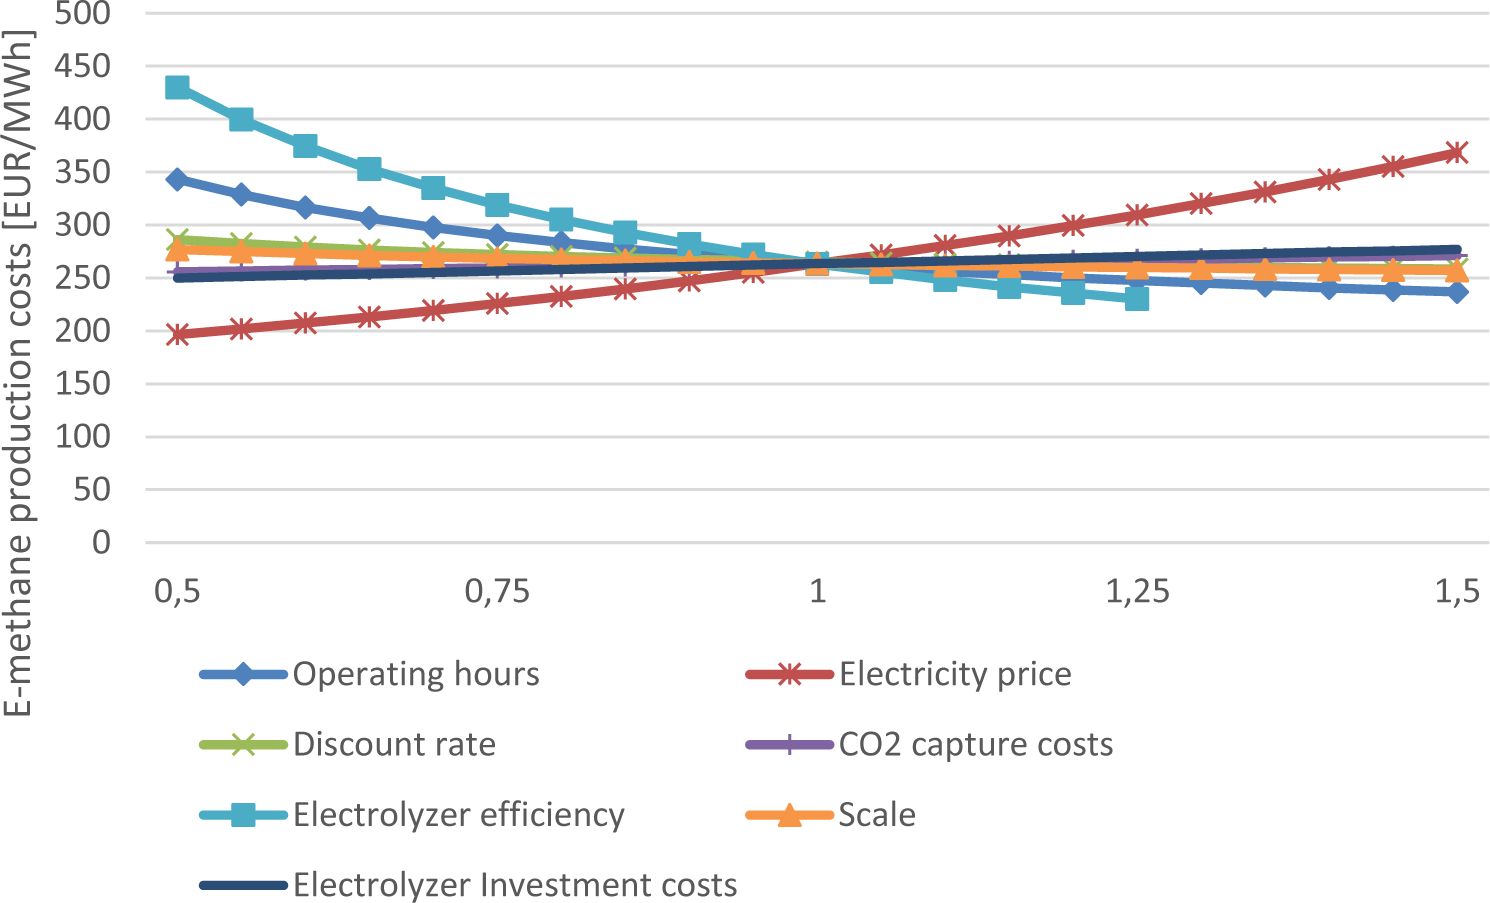
The sensitivity analysis regarding production costs of e-methane in the growth scenario in 2050 is visualized in Figure 10. The results showed that the electrolyzer efficiency, electricity prices and the full-load hours have the most impact. The effect of full-load hours becomes even more decisive for values less than 3000 FLH, as previously shown for hydrogen. The CO2 capture costs and the production scale displayed the lowest impact on the costs.
For e-methanol production the same effect of variables on the production costs could be observed. A combination of many full-load hours and low electricity prices is key to ensuring low production costs.
Sensitivity analysis of e-methane production costs in 2050 using an alkaline electrolyzer in the growth scenario
The investigation of the carbon taxes supports the previous findings. A natural gas price of 83 EUR/ MWh was used for this analysis [68]. Figure 11 shows that even a high carbon price of 500 EUR/t CO2 is not sufficient to ensure economic competitiveness under the taken assumptions. The production costs of e-methane are above the elevated natural gas market prices regarding a carbon tax.
A 50% lower grid electricity price of 45 EUR/MWh leads to a 34% decrease in e-methane production costs, intersecting the natural gas market prices including a tax of 320 EUR/t CO2. However, other costs for the market distribution, such as gas network charges still need to be added to the production costs of e-methane. Other authors, such as van der Zwaan et al. [56], calculated 270 EUR/t CO2 for different scales than in this work, making e-methane competitive with natural gas. Hydrogen will become competitive with natural gas rather than e-methane. Approximately 180 EUR/t CO2 will be required to promote hydrogen production from wind in 2050.
Production costs of e-methane compared to natural gas prices including carbon taxes
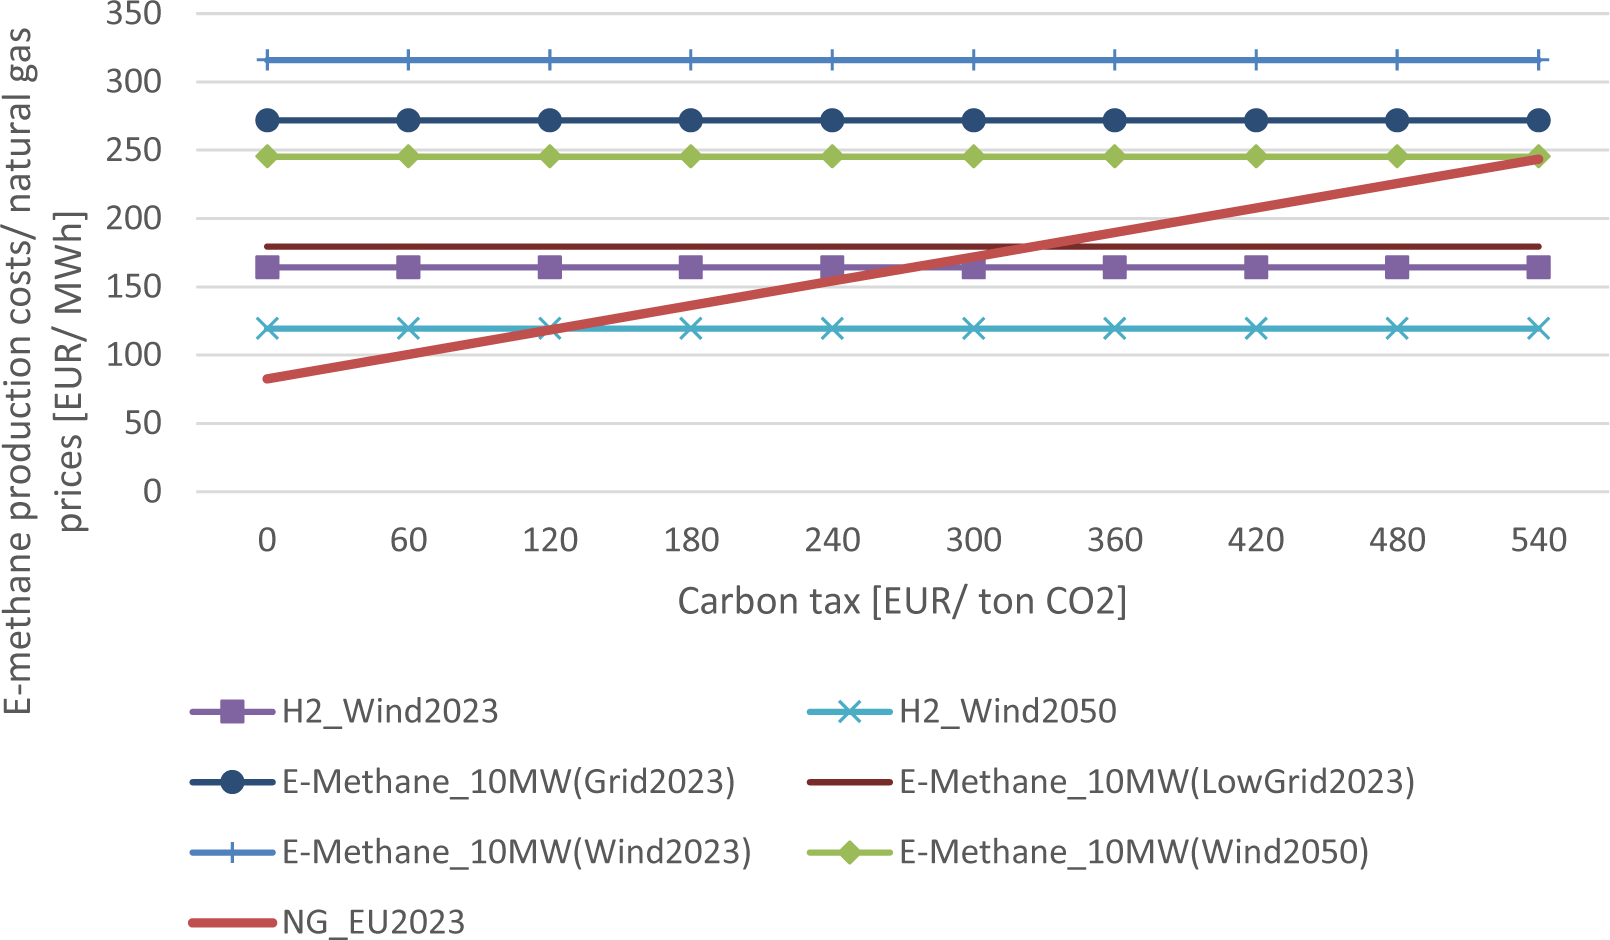
Table 5 displays the results of the SWOT analysis. The production of hydrogen can be increased extraordinarily because of the possibility of using renewable electricity. The overall process efficiency of H2 use is higher than e-methane and e-methanol because of the fuel synthesis as an additional step. Therefore, the production costs are also less for H2. However, the energy density is much lower and compression or liquefaction is necessary. High investments are also required for the H2 infrastructure. E-methane and e-methanol on the other hand, can profit from existing terminals and storage capacities. E-methanol is the easiest to handle of the three fuels regarding storage and shows very few losses because it is already in a liquid state at room temperature.
The usage of biomass-based CO2 as an input stream is an option to produce renewable platform chemicals, for example, e-methanol in this case. This creates the possibility to contribute to the defossilization of the chemical industry within the following decades.
| H2 | e-Methane | e-Methanol | |
|---|---|---|---|
| STRENGTHS | Higher efficiencies than e-methane and e-methanol Emission reduction compared to conventional fuels Lowest production costs of the three investigated fuels |
Easier to store than H2 with lower storage costs Applicability in different industries |
High volumetric energy density at room temperature compared to H2 and e-methane Very low storage losses. Easy to handle |
| WEAKNESSES | Development of drive and fueling system (maritime transport and aviation) necessary Low energy density Highly diffusive gas High material requirements for storage |
Offset of emission reduction in case of methane leakages Low overall process efficiency Currently high production costs |
Lower energy density than diesel and gasoline Low overall process efficiency Combustion engines need to be adapted Currently high production costs |
| OPPORTUNITIES | Scalable with renewable electricity Repurposing of natural gas pipelines Flexible use in different applications Adaptation of industrial burners and stoves |
Gas storage capacities for long-term storage CO2 utilization Usage of current infrastructure Industry is heavily based on methane as feedstock |
Methanol terminals are already existing CO2 utilization Platform chemical in the chemical industry Creation of a new industry in Europe |
| THREATS | Investments in new infrastructure Lack of regulation Energy input for compression |
Lock-in effects of natural gas infrastructure Energy input for compression |
Optimization of transport and fueling systems necessary Higher storage capacities on board needed |
In the EU, 420-490 Mt biomass-derived CO2 will be generated from biomethane production, biomass-based district heating and the pulp and paper industry in 2030. This corresponds to technical potentials of 208-243 billion cubic meters of e-methane or 248-290 Mt e-methanol. Grid electricity as source for the operation of an electrolyzer is currently not a preferable choice. The investment risk is increasing with variable and growing electricity prices. Furthermore, in 2021, there was still an average share of around 39% fossil fuels in the electricity mix in the EU, which would cause large amounts of GHG emissions in the production of e-methane and e-methanol. However, the production of e-methane and e-methanol using CO2 from biomass-based processes and renewable electricity will remain challenging from an economic point of view:
Economies of scale of e-methane and e-methanol production plants in a range of 1-10 MW using grid electricity and operating for 8000 FLH per year could reduce production costs by 7-10%. For a 10 MW plant using electricity generated by wind and operating for 2600 FLH per year, the costs could be decreased by approximately 20% compared to the production costs of a 1 MW plant.
Despite these cost reductions, even with a high carbon tax of 500 EUR/t CO2, e-methane production costs will remain high in the main scenario.
Therefore, low electricity prices and a high number of full-load hours are key to enhancing the economic viability. Using excess electricity could lead to lower costs of electricity but also significantly increases capital costs due to a low number of full-load hours. However, it should be noted that in this paper the pure production costs are calculated and the revenues of heat and oxygen are not considered.
Besides the differences in energy efficiencies and production costs of hydrogen, e-methane and e-methanol, technical aspects also play an important role for their future use.
The energy density of hydrogen is much lower and a compression or liquefaction is necessary for its storing and transporting.
E-methanol has the best storage properties of the three investigated fuels and the highest energy density at room temperature.
For e-methane, the existing infrastructure can also be used, but the threat of lock-in effects of natural gas usage must be considered.
Opportunities for further research include incorporating low or even negative prices of excess electricity, the use of a high-temperature solid oxide electrolyzer to enhance the efficiency of hydrogen production, and locations where electricity from offshore wind and hydropower is available.
This study was carried out within the doctoral college CO2Refinery at TU Wien.
| η | energy efficiency | [%] |
| BAU | Business as usual |
| bcm | Billion cubic meters |
| CCU | Carbon capture utilization |
| CH3OH | Methanol |
| CHP | Combined heat and power |
| CH4 | Methane |
| CO2 | Carbon dioxide |
| EU | European Union |
| EUR | Euros |
| FLH | Full-load hours |
| GHG | Greenhouse gas emissions |
| PEM | Proton exchange membrane |
| PV | Photovoltaic |
- Carbon Dioxide Concentration | NASA Global Climate Change, Climate Change: Vital Signs of the Planet, 2023, https://climate.nasa.gov/vital-signs/carbon-dioxide, Accessed
- ,
A review on alternative fuels in future energy system, Renewable and Sustainable Energy Reviews , Vol. 128 , , https://doi.org/https://doi.org/10.1016/j.rser.2020.109927 - ,
Sulfur Rich Coal Gasification and Low Impact Methanol Production, Journal of Sustainable Development of Energy, Water and Environment Systems , Vol. 6 (1),pp 210-226 , , https://doi.org/https://doi.org/10.13044/j.sdewes.d5.0188 - ,
Renewable methane - A technology evaluation by multi-criteria decision making from a European perspective ,Energy , Vol. 139 ,pp 468-484 , , https://doi.org/https://doi.org/10.1016/j.energy.2017.07.164 - ,
Renewable methanol as a fuel for the shipping industry ,Renewable and Sustainable Energy Reviews , Vol. 94 ,pp 1217-1228 , , https://doi.org/https://doi.org/10.1016/j.rser.2018.06.058 - European Electricity Review, 2023, https://ember-climate.org/insights/research/european-electricity-review-2023, Accessed
- ,
Techno-economic assessment of a power-to-green methanol plant ,Journal of CO2 Utilization , Vol. 75 ,pp 102563 , , https://doi.org/https://doi.org/10.1016/j.jcou.2023.102563 - ,
On the economics of storage for electricity: Current state and future market design prospects ,WIREs Energy and Environment , Vol. 11 (3),pp e431 , , https://doi.org/https://doi.org/10.1002/wene.431 - ,
On the long-term prospects of power-to-gas technologies ,WIREs Energy and Environment , Vol. 8 (1),pp e318 , , https://doi.org/https://doi.org/10.1002/wene.318 - ,
Decarbonised District Heat, Electricity and Synthetic Renewable Gas in Wind- and Solar-Based District Energy Systems, Journal of Sustainable Development of Energy ,Water and Environment Systems , Vol. 9 (2),pp 1-22 , , https://doi.org/https://doi.org/10.13044/j.sdewes.d8.0340 - ,
Carbon abatement costs for renewable fuels in hard-to-abate transport sectors ,Advances in Applied Energy , Vol. 12 ,pp 100156 , , https://doi.org/https://doi.org/10.1016/j.adapen.2023.100156 - , , 2020
- , Hydrogen Europe Analysis, Brussels, 2023
- ,
Status of and expectations for flexible bioenergy to support resource efficiency and to accelerate the energy transition ,Renewable and Sustainable Energy Reviews , Vol. 158 ,pp 112094 , , https://doi.org/https://doi.org/10.1016/j.rser.2022.112094 - The Biomethane Industrial Partnership Teaming up to achieve 35 bcm of sustainable biomethane by 2030Home, 2022, https://bip-europe.eu, Accessed
- ,
Current status and future perspectives for energy production from solid biomass in the European industry ,Renewable and Sustainable Energy Reviews , Vol. 112 ,pp 960-977 , 2019, https://doi.org/https://doi.org/10.1016/j.rser.2019.06.022 - Biomass Utilisation in District Heating Plants, 2023, https://www.dbfz.de/fileadmin/Bioenergy4Business/data/pdf/Brochure_3.pdf, Accessed
- , Key statistics European pulp & paper industry, Brussels, 2022
- ,
Multi-criteria decision approach to select carbon dioxide and hydrogen sources as potential raw materials for the production of chemicals ,Renewable and Sustainable Energy Reviews , Vol. 151 ,pp 111542 , , https://doi.org/https://doi.org/10.1016/j.rser.2021.111542 - ,
Bioenergy with carbon capture and utilization: A review on the potential deployment towards a European circular bioeconomy ,Renewable and Sustainable Energy Reviews , Vol. 152 ,pp 111641 , , https://doi.org/https://doi.org/10.1016/j.rser.2021.111641 - ,
Transforming lignin into renewable fuels, chemicals, and materials: A review ,Bioresource Technology Reports , Vol. 22 ,pp 101463 , , https://doi.org/https://doi.org/10.1016/j.biteb.2023.101463 - ,
Life cycle assessment of a small-scale methanol production system: A Power-to-Fuel strategy for biogas plants ,Journal of Cleaner Production , Vol. 271 ,pp 122476 , , https://doi.org/https://doi.org/10.1016/j.jclepro.2020.122476 - ,
Potential CO2 utilisation in Germany: An analysis of theoretical CO2 demand by 2030 ,Journal of CO2 Utilization , Vol. 50 ,pp 101580 , , https://doi.org/https://doi.org/10.1016/j.jcou.2021.101580 - ,
Double Yields and Negative Emissions? Resource, Climate and Cost Efficiencies in Biofuels With Carbon Capture, Storage and Utilization ,Frontiers in Energy Research , Vol. 10 , 2022, https://doi.org/https://doi.org/10.3389/fenrg.2022.797529 - ,
Wind power to methanol: Renewable methanol production using electricity, electrolysis of water and CO2 air capture ,Applied Energy , Vol. 264 ,pp 114672 , , https://doi.org/https://doi.org/10.1016/j.apenergy.2020.114672 - ,
Direct Methanation of Biogas-Technical Challenges and Recent Progress ,Frontiers in Energy Research , Vol. 8 , , https://doi.org/https://doi.org/10.3389/fenrg.2020.570887 - , , Scaling up electrolysers to meet the 1.5C° climate goal., 2020
- ,
Hydrogen production by PEM water electrolysis - A review ,Materials Science for Energy Technologies , Vol. 2 (3),pp 442-454 , , https://doi.org/https://doi.org/10.1016/j.mset.2019.03.002 - ,
Scaling and performance assessment of power-to-methane system based on an operation scenario ,Fuel , Vol. 332 ,pp 126182 , , https://doi.org/https://doi.org/10.1016/j.fuel.2022.126182 - , Technology report 4.2a Power-to-gas2 (chemical-catalytic methanation) within the research project TF_Energy transition “in German - Technologiebericht 4.2a Power-to-gas2 (Methanisierung chemisch-katalytisch) innerhalb des Forschungsprojekts TF_Energiewende”, Baden-Württemberg, 2018
- , Innovation Outlook: Renewable Methanol, Abu Dhabi, 2021
- ,
Power-to-Green Methanol via CO2 Hydrogenation-A Concept Study including Oxyfuel Fluidized Bed Combustion of Biomass ,Energies , Vol. 14 (1515), , https://doi.org/https://doi.org/10.3390/en14154638, Art - JRC Photovoltaic Geographical Information System (PVGIS) - European Commission, 2023, https://re.jrc.ec.europa.eu/pvg_tools/en, Accessed
- Global Wind Atlas, 2023, https://globalwindatlas.info, Accessed
- ,
Life cycle assessment of SNG from wood for heating, electricity, and transportation ,Biomass and Bioenergy , Vol. 35 (7),pp 2950-2960 , , https://doi.org/https://doi.org/10.1016/j.biombioe.2011.03.036 - ,
Does the Green Hydrogen Economy Have a Water Problem? ,ACS Energy Lett. , Vol. 6 (9),pp 3167-3169 , , https://doi.org/https://doi.org/10.1021/acsenergylett.1c01375 - ,
Economic assessment of advanced biofuel production via gasification using cost data from the GoBiGas plant ,Energy Science & Engineering , Vol. 7 , , https://doi.org/https://doi.org/10.1002/ese3.271 - , Projections of electrolyzer investment cost reductions through learning curve analysis, Amsterdam, TNO 2022 P10111, 2022
- ,
Negative emissions-Part 2: Costs, potentials and side effects ,Environ. Res. Lett. , Vol. 13 (6),pp 063002 , , https://doi.org/https://doi.org/10.1088/1748-9326/aabf9f - ,
Renewable Power-to-Gas: A Technical and Economic Evaluation of Three Demo Sites Within the STORE&GO Project ,Chemie Ingenieur Technik , Vol. 93 (4),pp 568-579 , , https://doi.org/https://doi.org/10.1002/cite.202000187 - ,
Production costs for synthetic methane in 2030 and 2050 of an optimized Power-to-Gas plant with intermediate hydrogen storage ,Applied Energy , Vol. 253 , , https://doi.org/https://doi.org/10.1016/j.apenergy.2019.113594 - ,
Feasibility study of methanol production plant from hydrogen and captured carbon dioxide ,Journal of CO2 Utilization , Vol. 21 ,pp 132-138 , , https://doi.org/https://doi.org/10.1016/j.jcou.2017.07.001 - , Directorate-General for Energy, Technology pathways in decarbonisation scenarios, Publications Office, 2020
- , 20102022, https://www.ris.bka.gv.at/Dokumente/Bundesnormen/NOR40236265/NOR40236265.html, RIS DokumentAccessed
- Water prices compared in 36 EU-cities, 2023, https://www.waternewseurope.com/water-prices-compared-in-36-eu-cities, Accessed
- ,
Performance and cost of CCS in the pulp and paper industry part 2: Economic feasibility of amine-based post-combustion CO2 capture ,International Journal of Greenhouse Gas Control , Vol. 66 ,pp 60-75 , , https://doi.org/https://doi.org/10.1016/j.ijggc.2017.09.010 - Electricity price statistics, 2023, https://ec.europa.eu/eurostat/statistics-explained/index.php?title=Electricity_price_statistics, Accessed
- , Electricity production costs of renewable energies “in German - Stromgestehungskosten erneuerbare Energien”, Freiburg, 2021
- ,
Implementation of the Power to Methanol concept by using CO2 from lignite power plants: Techno-economic investigation ,International Journal of Hydrogen Energy , Vol. 41 (38),pp 16674-16687 , , https://doi.org/https://doi.org/10.1016/j.ijhydene.2016.07.100 - , Energy and economic performance of the FARWIND energy system for sustainable fuel production from the far-offshore wind energy resource, 2019
- ,
Learning curves for hydrogen production technology: An assessment of observed cost reductions ,International Journal of Hydrogen Energy , Vol. 33 (11),pp 2630-2645 , , https://doi.org/https://doi.org/10.1016/j.ijhydene.2008.03.011 - ,
Projecting the future cost of PEM and alkaline water electrolysers; a CAPEX model including electrolyser plant size and technology development ,International Journal of Hydrogen Energy , Vol. 47 (90),pp 38106-38113 , , https://doi.org/https://doi.org/10.1016/j.ijhydene.2022.08.306 - ,
Technological learning: Lessons learned on energy technologies ,WIREs Energy and Environment , Vol. 12 (2),pp e463 , , https://doi.org/https://doi.org/10.1002/wene.463 - Global Hydrogen Review 2023 - Analysis - IEA, 2023, https://www.iea.org/reports/global-hydrogen-review-2023, Accessed
- Global installed electrolysis capacity by region, 2015-2020 - Charts - Data & Statistics, 2023, https://www.iea.org/data-and-statistics/charts/global-installed-electrolysis-capacity-by-region-2015-2020, Accessed
- ,
Renewable natural gas as climate-neutral energy carrier? ,Fuel , Vol. 311 ,pp 122547 , , https://doi.org/https://doi.org/10.1016/j.fuel.2021.122547 - , Greenhouse Gas Emissions from the Russian Natural Gas Export Pipeline System, Wuppertal Institute for Climate, Environment and Energy in co-operation with Max-Planck-Institute for Chemistry, Mainz, Wuppertal and Mainz, 2005
- , Methanol carbon footprint and certification, International Methanol Producers and Consumers Association IMPCA, Amsterdam, 2022
- ,
Profitability and greenhouse gas emissions of gasification-based biofuel production - Analysis of sector specific policy instruments and comparison to conventional biomass conversion technologies ,Energy , Vol. 165 ,pp 997-1007 , , https://doi.org/https://doi.org/10.1016/j.energy.2018.09.105 - ,
Sustainability Assessment of Innovative Energy Technologies - Hydrogen from Wind Power as a Fuel for Mobility Applications ,Journal of Sustainable Development of Energy, Water and Environment Systems , Vol. 9 (3),pp 1-21 , , https://doi.org/https://doi.org/10.13044/j.sdewes.d8.0371 - ,
Enhancing Bioenergy Recovery from Agro-food Biowastes as a Strategy to Promote Circular Bioeconomy ,Journal of Sustainable Development of Energy, Water and Environment Systems , Vol. 9 (1),pp 1-13 , , https://doi.org/https://doi.org/10.13044/j.sdewes.d8.0320 - ,
Biowaste-to-Biomethane: An LCA study on biogas and syngas roads ,Waste Management , Vol. 87 ,pp 441-453 , , https://doi.org/https://doi.org/10.1016/j.wasman.2019.02.030 - ,
Lignin-carbohydrate complexes: properties, applications, analyses, and methods of extraction: a review ,Biotechnology for Biofuels , Vol. 11 (1),pp 269 , , https://doi.org/https://doi.org/10.1186/s13068-018-1262-1 - ,
Sustainable Process for the Depolymerization/Oxidation of Softwood and Hardwood Kraft Lignins Using Hydrogen Peroxide under Ambient Conditions ,Molecules , Vol. 25 ,pp 2329 , , https://doi.org/https://doi.org/10.3390/molecules25102329 - Solid biomass barometer, 20202023, https://www.eurobserv-er.org/solid-biomass-barometer-2020, Accessed
- ,
- ,
Flexible Carbon Capture and Utilization technologies in future energy systems and the utilization pathways of captured CO2 ,Renewable and Sustainable Energy Reviews , Vol. 114 ,pp 109338 , , https://doi.org/https://doi.org/10.1016/j.rser.2019.109338 - Natural gas price statistics, 2023, https://ec.europa.eu/eurostat/statistics-explained/index.php?title=Natural_gas_price_statistics, Accessed
- ,
Prospects and impediments for hydrogen and fuel cell vehicles in the transport sector ,International Journal of Hydrogen Energy , Vol. 46 (16),pp 10049-10058 , , https://doi.org/https://doi.org/10.1016/j.ijhydene.2020.03.122 - Fuel analysis in shipping by ship segments “in German - Kraftstoff-Analyse in der Schifffahrt nach Schiffssegmenten”, DMZ | Deutsches Maritimes Zentrum, 2023, https://dmz-maritim.de/energietraeger-der-zukunft-kraftstoff-analyse-in-der-schifffahrt-nach-schiffssegmenten, Accessed