



Water is the most vital natural source of life. Every living organism depends on water for survival. Notably, about 71% of the Earth's surface is covered by water, making it one of the planet's most abundant natural features [1]. However, a minor portion of this percentage is available for direct human use [2] and is found in rivers [3], lakes [4], and groundwater [5]. Climate change is intensifying water scarcity through prolonged droughts and reduced rainfall [6]. Simultaneously, the high rate of urbanisation is affecting water quality by significantly releasing untreated sewage, industrial effluent, and runoff contaminated with pollutants into freshwater [7]. Inadequately controlled urban infrastructure is often unable to handle increased waste loads, resulting in contamination of surface and groundwater [8]. As a result, several nations are facing water scarcity, affecting up to 40% of the population [9], and projections for 2050 indicate that 87 countries will be water-scarce [10]. Therefore, large economic investments rely on cleaning water for various purposes, such as drinking, agriculture, reuse & disposal, and household usage. Table 1 presents selected countries and their respective investment amounts in water pollution control and treatment.
| Country | Project name/scope | Year of study | Investment amount | Reference |
|---|---|---|---|---|
| China | Nationwide water pollution control | 2018 | US$106 billion | [11] |
| Ethiopia | One WASH National Programme | 2021 | US$6.5 billion | [12] |
| Spain | Madrid wastewater treatment & reuse for irrigation | 2022 | US$231.41 million | [13] |
| Singapore | NEWater project | 2020 | US$130 million | [14] |
| Saudi Arabia | Desalination capacity (Vision 2030) | 2023 | US$80 billion | [15] |
| United States | Water infrastructure | 2022 | US$55 billion | [16] |
Despite substantial global investment in and advancement of purification technologies to ensure safe drinking water, it is essential to understand post-treatment steps, particularly when water is stored and consumed from large plastic jugs or dispensed through water dispensers. The two stages are often neglected in water quality assessments, although they play a direct role in determining water safety for human consumption. Remarkably, storing drinking water in large plastic containers can alter the plastic's chemical composition and physical properties, leading to the leaching of various substances into the water [17]. Moreover, recent studies have raised concerns about the presence of microplastics, a specific type of microparticle that primarily originates from the degradation of plastic containers, as reported in [18]–[21]. These microplastics may not only alter the physicochemical properties of drinking water but also pose potential risks to human health through long-term exposure [22]. Equally important is the assessment of water dispensers, which usually incorporate rapid-sand filtration systems integrated into the effluent flow. While such systems are designed to enhance water quality, they may also influence the physical and chemical stability of the stored water. Factors such as filter material composition, maintenance frequency, and operational conditions can all affect the potential introduction or accumulation of microparticle contaminants, including microplastics or particles washed out from sand filtration. Therefore, it is crucial to investigate the combined effects of storage containers and dispensing mechanisms on the final quality of treated drinking water.
The literature has reported a wide range of experimental methods for detecting microparticles in water. A study carried out by Mason et al. [23] investigated microplastic contamination in 259 bottles from 11 bottled water brands using a combination of Nile Red staining and optical microscopy. Fluorescent particles were counted using image analysis software for particles <100 μm and confirmed by Fourier Transform Infrared (FTIR) spectroscopy for particles >100 μm. The results indicated microplastic contamination in 93% of samples, with an average of 325 particles per litre. Another experimental study conducted by Tong et al. [24] examined microplastic contamination in tap water from 38 locations across China, using Nile Red staining, fluorescence microscopy, and micro-Raman spectroscopy. The findings indicated that microplastics were present in nearly all samples, with a mean concentration of 440 particles/L, posing a significant health risk to the Chinese population. Baldwin et al. [25] studied plastic pollution in 29 Great Lakes tributaries across six U.S. states to understand how land use, water flow, and wastewater affect microplastic levels. Using a 333 μm neuston net, researchers collected 107 surface water samples and analysed them by sieving, oxidation, and microscopy. Plastics were found in every sample, ranging from 0.05 to 32 particles per cubic meter, with a median of 1.9 particles per cubic meter. The study showed clear differences between rivers and lakes. Moreover, apart from microparticle analysis, assessing the chemical and physical properties of water alongside microparticle analysis provides a more comprehensive evaluation of the tested samples. Specifically, measuring parameters such as turbidity, pH, and bacterial levels can provide a better understanding of overall water pollution. Fortunately, major advancements in turbidity and pH meters have been developed in recent years, simplifying their implementation. The literature describes a variety of chemical reagents used to detect bacterial presence. For instance, Ramoutar [26] studied the effects of three chemical reagents: Colilert-18, Colilert, and Enterolert. The study was carried out to detect bacteria in the tropical marine waters of Trinidad and Tobago. These tests use special substrates that change colour or glow when bacteria are present. Over 110 water samples were analysed and compared with the traditional membrane filtration method. The two methods produced similar results with no significant statistical difference (p > 0.05). The study concluded that Colilert and Enterolert reagents are reliable and practical for routine testing of bacteria in beach water.
Although researchers have conducted numerous studies examining microparticle pollution in bottled, tap, and natural water sources, few have examined the interactive effects of plastic storage containers and dispenser mechanisms on drinking water. Most current literature focuses on the determination and monitoring of microplastics, particularly at the source or bottling level, while much less attention has been given to microparticles in the subsequent storage and dispensing environments to which consumers are directly exposed. Additionally, past research appears to analyse individual parameters, such as microparticle concentration or bacterial content. Still, it does not combine other vital indicators, such as turbidity and pH, to better understand water quality degradation. This gap underscores the need for a systematic assessment that links plastic degradation, microbial activity, and physicochemical changes during storage and dispensing. Thus, the current research is expected to fill this gap by measuring the quality of dispenser water using a combination of parameters: microparticles, turbidity, pH, and bacterial presence in hot and cold water, while comparing both dispenser outlets with the original bottled source. This integrated point-of-use assessment helps distinguish the influence of storage from that of dispensing on the final water quality. It provides practical insight for safer water use, improved dispenser maintenance, and better storage and distribution practices. The main objective of this study is to evaluate whether dispenser-delivered water remains safe for drinking, with a particular focus on microparticles, an emerging contaminant.
In this section, the overall study design is first summarised in Figure 1. The flowchart outlines the scope of the current work, showing the cold- and hot-water outlets of the dispensers and the four groups of parameters analysed: physical (turbidity), chemical (pH), biological (bacterial presence), and emerging contaminants (microparticle concentration). This overview helps clarify how the different measurements are linked within the experimental program.
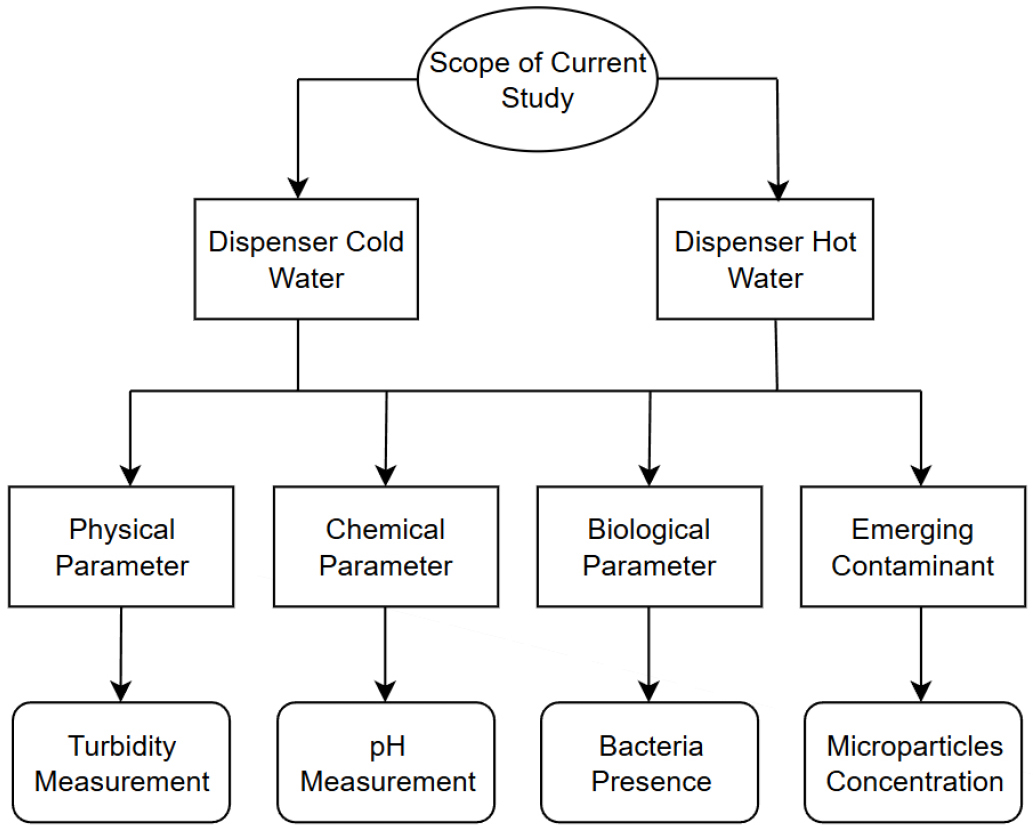
Water samples were collected from five different identical water dispensers located indoors at various stations across the American University of Sharjah campus (UAE). Each dispenser provided one hot-water sample and one cold-water sample, for a total of 10 samples. In addition, the main water source used in these dispensers, which comes from a plastic-bottled jug, was collected and analysed as a control sample for each dispenser. One litre of water was collected from each outlet (hot and cold) and from the main bottled water source, using sterilised glass containers. The collected samples were logically distributed among the different experimental setups, which will be discussed in the following sections. The initial temperature of each sample was measured immediately after collection to record the starting conditions before further analysis.
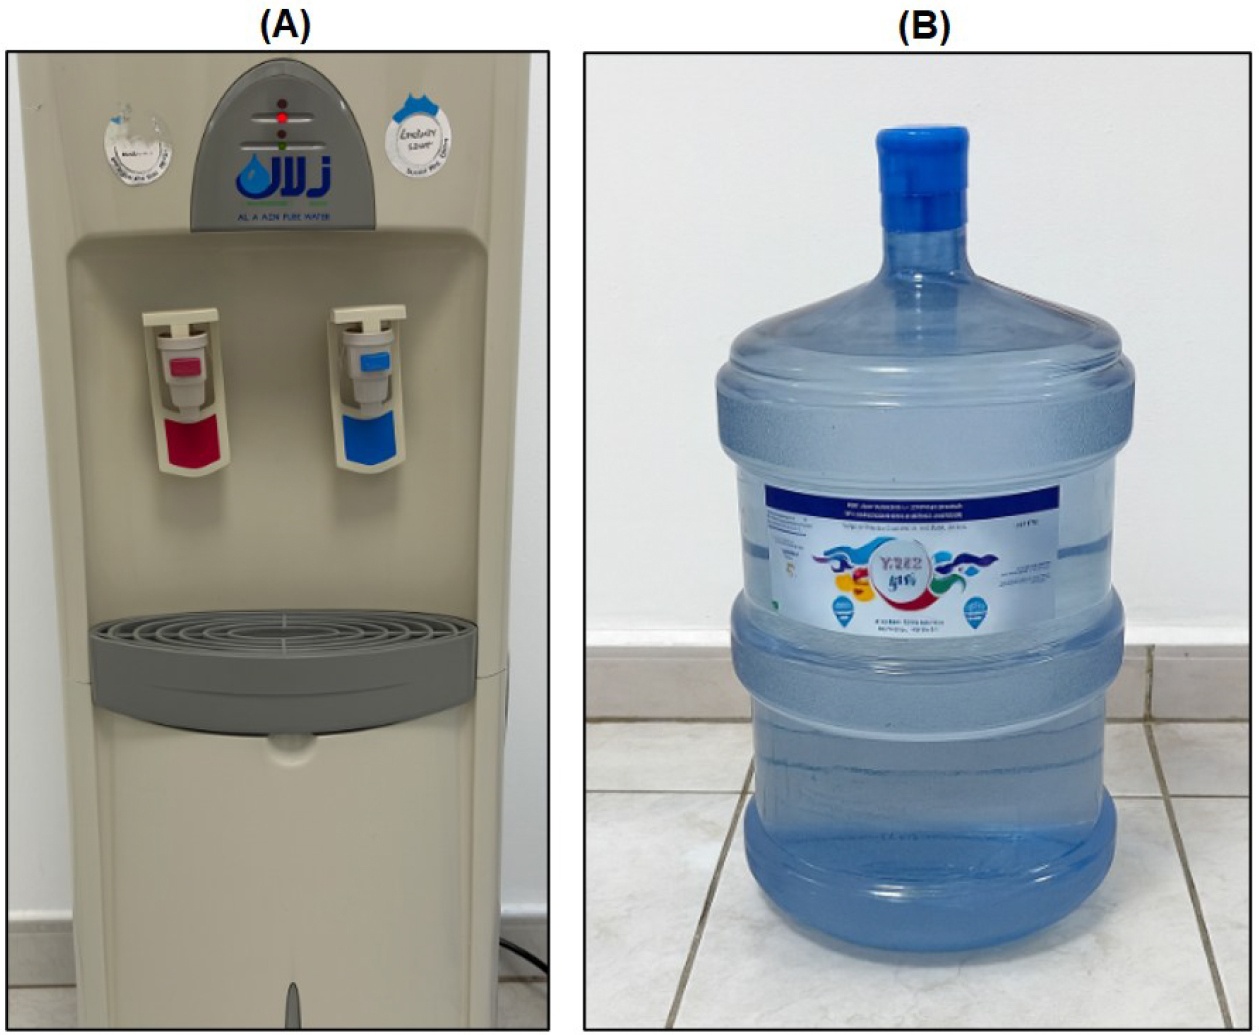
Figure 2 shows the experimental setup used for collecting the water samples. Each dispenser was connected to a plastic water jug that served as the main source. The dispensers incorporate an internal rapid-sand filtration stage and separate taps for heated and cooled water, reflecting the typical configuration installed in indoor campus locations.
To accurately assess contamination levels in both cold and hot water outlets, and in the original bottled samples used in private indoor environments, several key parameters were tested. These included turbidity, pH, bacterial presence, and microparticle concentration. These factors were chosen to provide a general understanding of water quality and potential health risks. All tests were performed using reliable, precise laboratory equipment.
As shown in Figure 3, the collected samples were first filtered using an oil-free Rocker 300 vacuum pump (maximum flow rate ≈ 23 L/min) operated at a controlled vacuum to avoid filter damage and particle loss, and the retained microparticles on the membrane filters were then counted using a Kern optical microscope under bright-field illumination at a total magnification of 100×. The pump was used to filter 500 mL of each water sample through a 47 mm diameter cellulose nitrate membrane filter with a pore size of 0.45 μm, following procedures commonly described in the literature [27]–[29]. After filtration, the filter sheet was divided into four equal parts to speed up and simplify the counting process. Microparticles were counted under the microscope in a single section, and the count was multiplied by 4 to estimate the total count for the entire filter. A microscope was required for this process, as microparticles are very small, with diameters less than 0.5 mm [30].
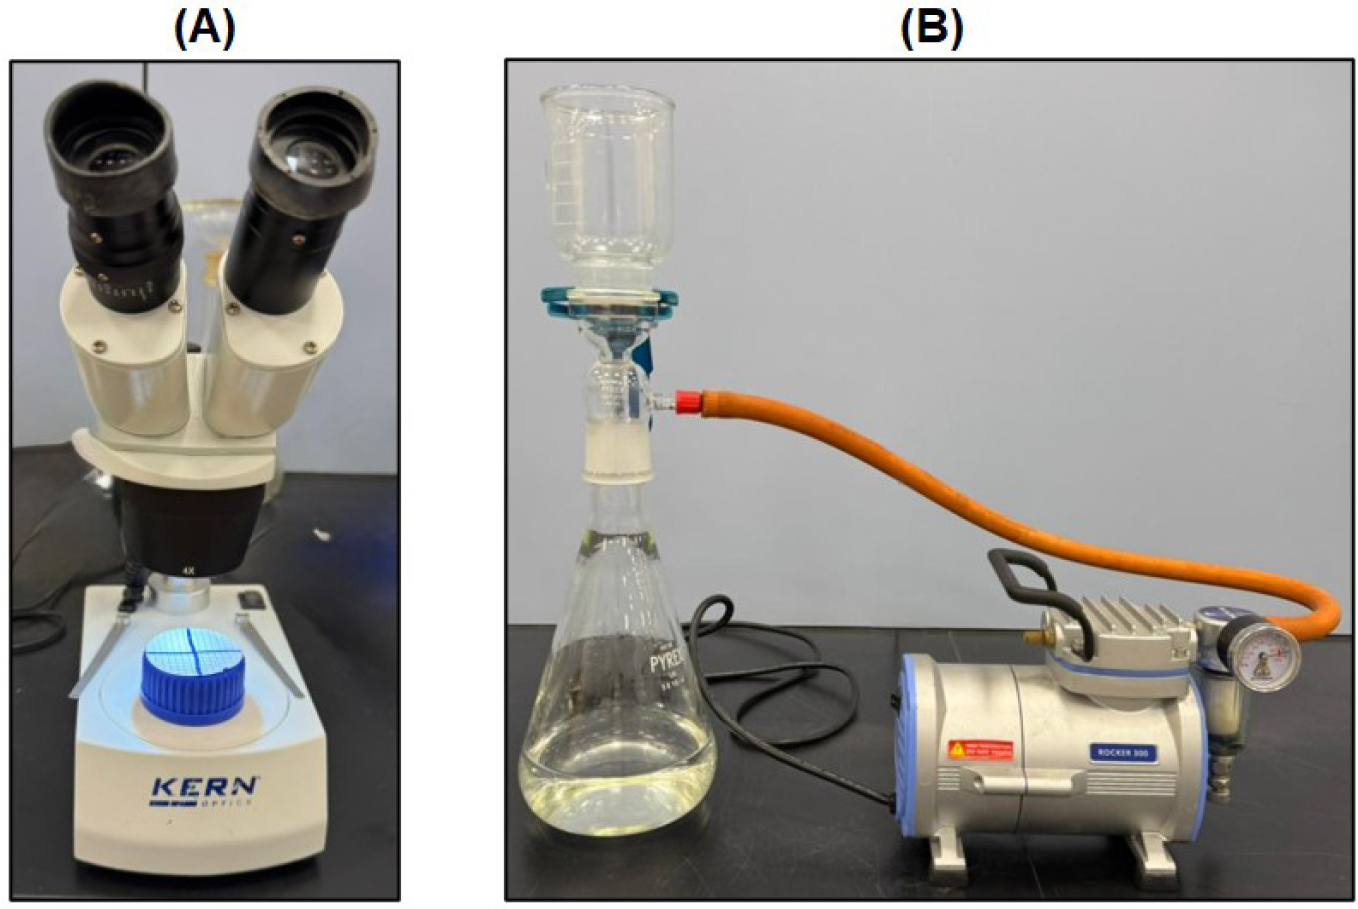
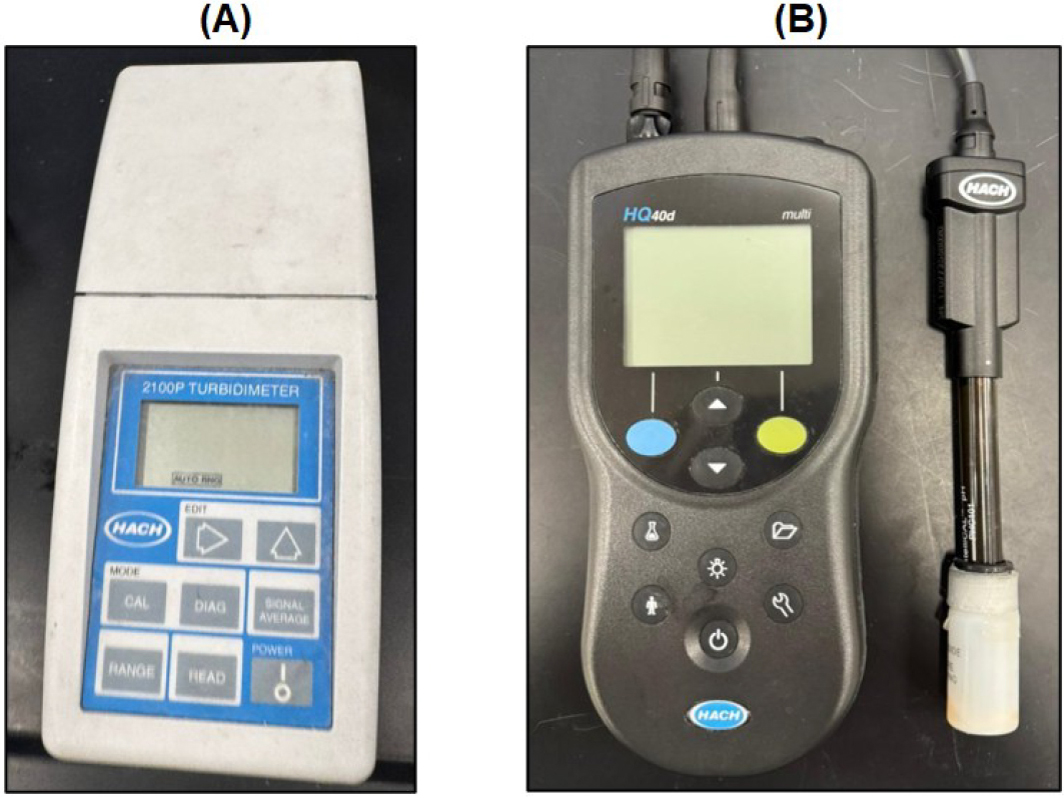
Figure 4 shows the instruments used for pH and turbidity measurements: a pH meter (HQ40d) and a turbidity meter (2100P TurbidityMeter), respectively. For turbidity measurement, a 10 mL portion of each water sample was transferred into a clean cuvette and analysed. For pH measurement, a 100 mL portion from each sample was used, and the electrode was rinsed with distilled water between measurements to avoid cross-contamination. The pH value was recorded once the meter stabilised, ensuring consistent, accurate readings for all samples.
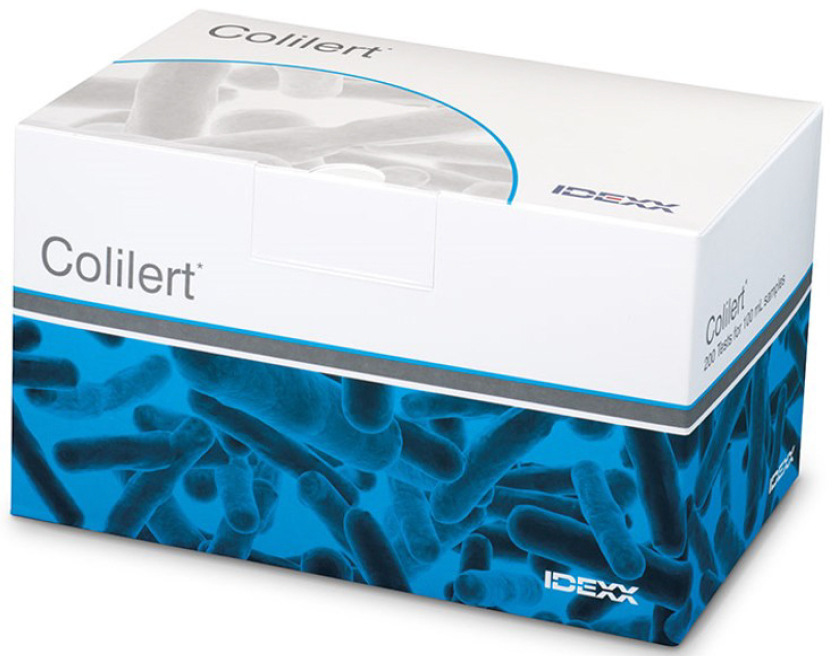
Bacterial contamination was tested using the Colilert reagent, which is shown in Figure 5. This test is a reliable and widely used procedure for detecting total coliform and Escherichia coli in water samples; however, because E. coli poses more direct health risks, this study focuses only on detecting these bacteria [31]. For each test, 100 mL of the collected water sample was mixed with Colilert reagent and incubated at 35 °C for 24 hours. After incubation, the samples were visually examined for colour changes. Blue fluorescence indicates the presence of E. coli, while the absence of a blue colour change confirms its absence [32].
After collecting all 15 samples from the dispensers and the original water sources, the temperature of each sample was immediately measured. Table 2 presents the recorded temperatures that differ between outlets, confirming the dispensers' acceptable functionality. The cold-water samples ranged from 4.5 °C to 17.1 °C, while the hot-water samples ranged from 75.5 °C to 79.8 °C. The temperature of the original water samples, before being dispensed, ranged from 22.9 °C and 23.2 °C.
| Sample No. | Temperature [°C] | ||
|---|---|---|---|
| Cold | Hot | Original | |
| 1 | 12.2 | 79.8 | 23.2 |
| 2 | 17.1 | 77.6 | 22.9 |
| 3 | 5.4 | 79.6 | 23.1 |
| 4 | 4.5 | 76.0 | 23.2 |
| 5 | 13.1 | 75.5 | 23.0 |
The temperature pattern suggests that hot water may be more prone to physical or chemical changes, whereas cold water could better preserve its original characteristics from the source. Although these observations are preliminary, they provide an initial indication of how storage and dispensing conditions might influence water quality. The following sections discuss each parameter in more detail, examining how turbidity, pH, and bacterial activity relate to dispenser operation, and whether microparticle concentrations differ between the hot and cold outlets.
Microscopic analyses indicated the presence of microparticles in all tested samples, including both dispenser outlets and original water sources. Figure 6 shows the measured microparticles for all tested samples. The hot outlet showed the highest mean microparticle concentration, at 32.0 ± 8.0 particles/L, whereas both the cold outlet and the original source had a mean of 19.2 ± 4.38 particles/L. In addition, the hot outlet exceeded the corresponding cold and original sample in all five dispensers, with an average paired increase of 12.8 particles/L. The concentration observed in the original water sources could be attributed to the plastic jugs used for water storage, indicating that these containers may contribute significantly to the release of emerging contaminants. This observation is consistent with previous findings from bottled water studies in [34]–[37], which demonstrated that plastic containers could release microparticles into stored water. Unfortunately, the rapid-sand filtration system integrated into the dispensers did not provide any water treatment; in fact, a significant increase in microparticles was observed at the hot outlet compared to the sources.
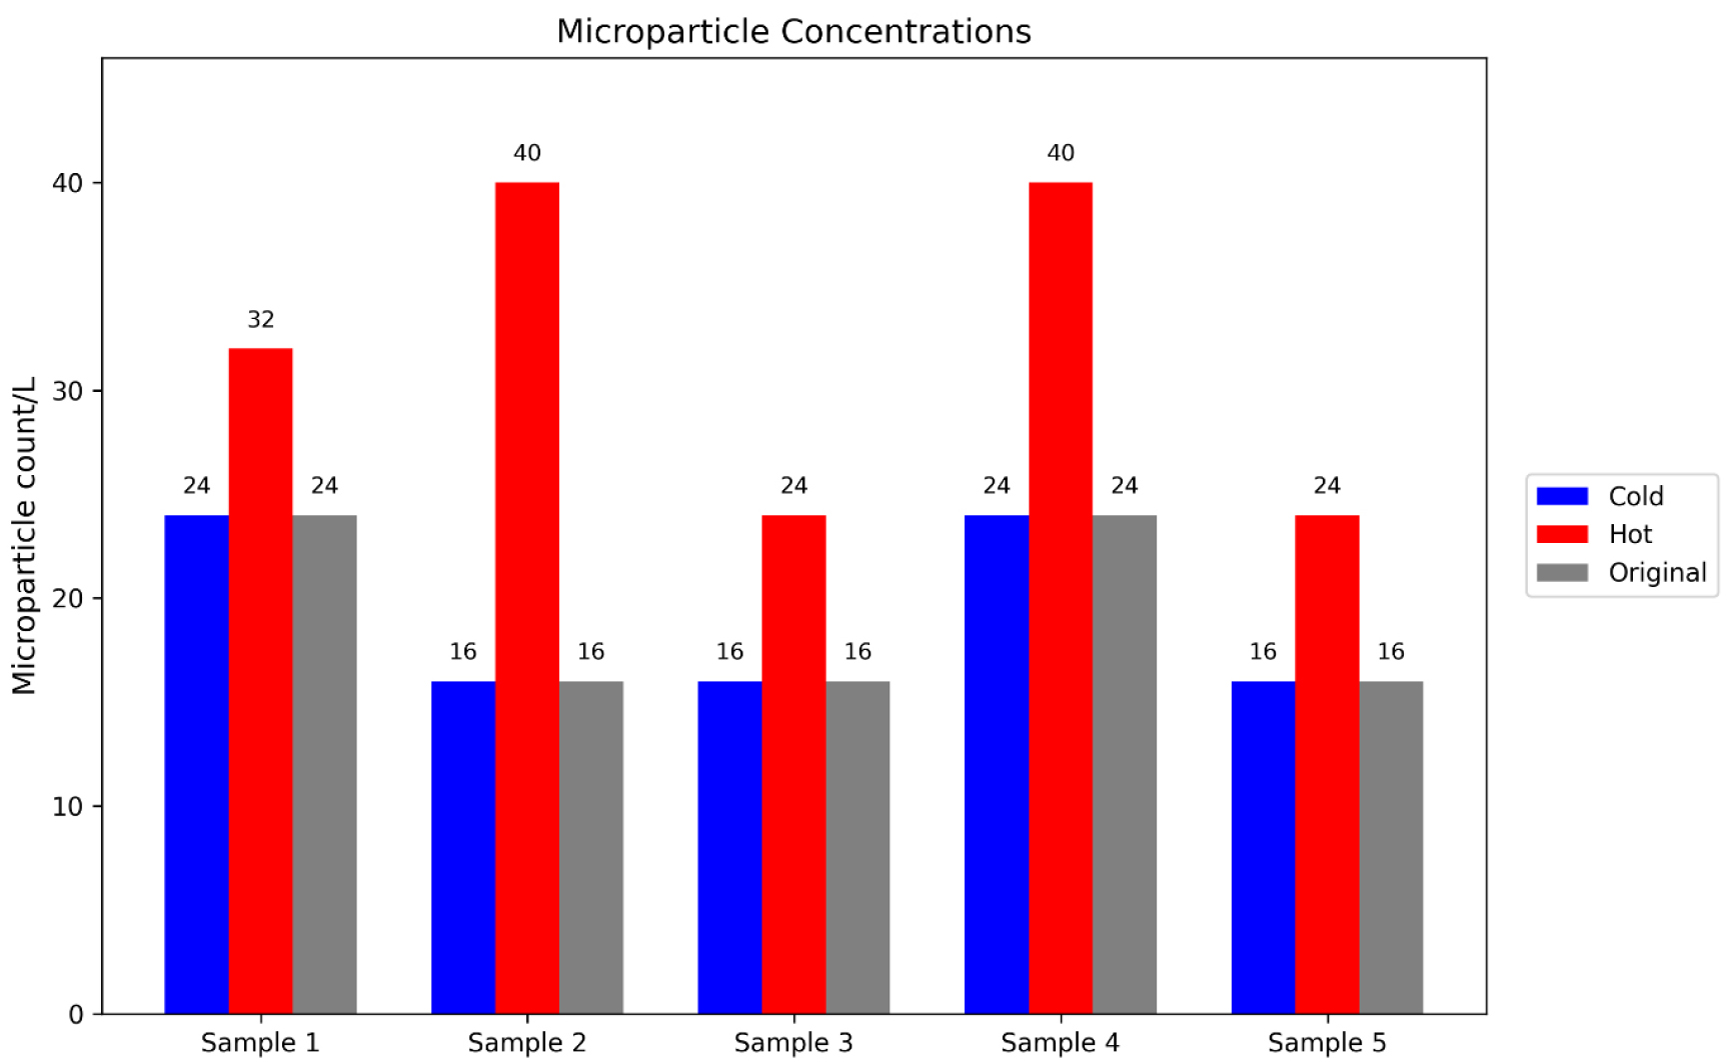
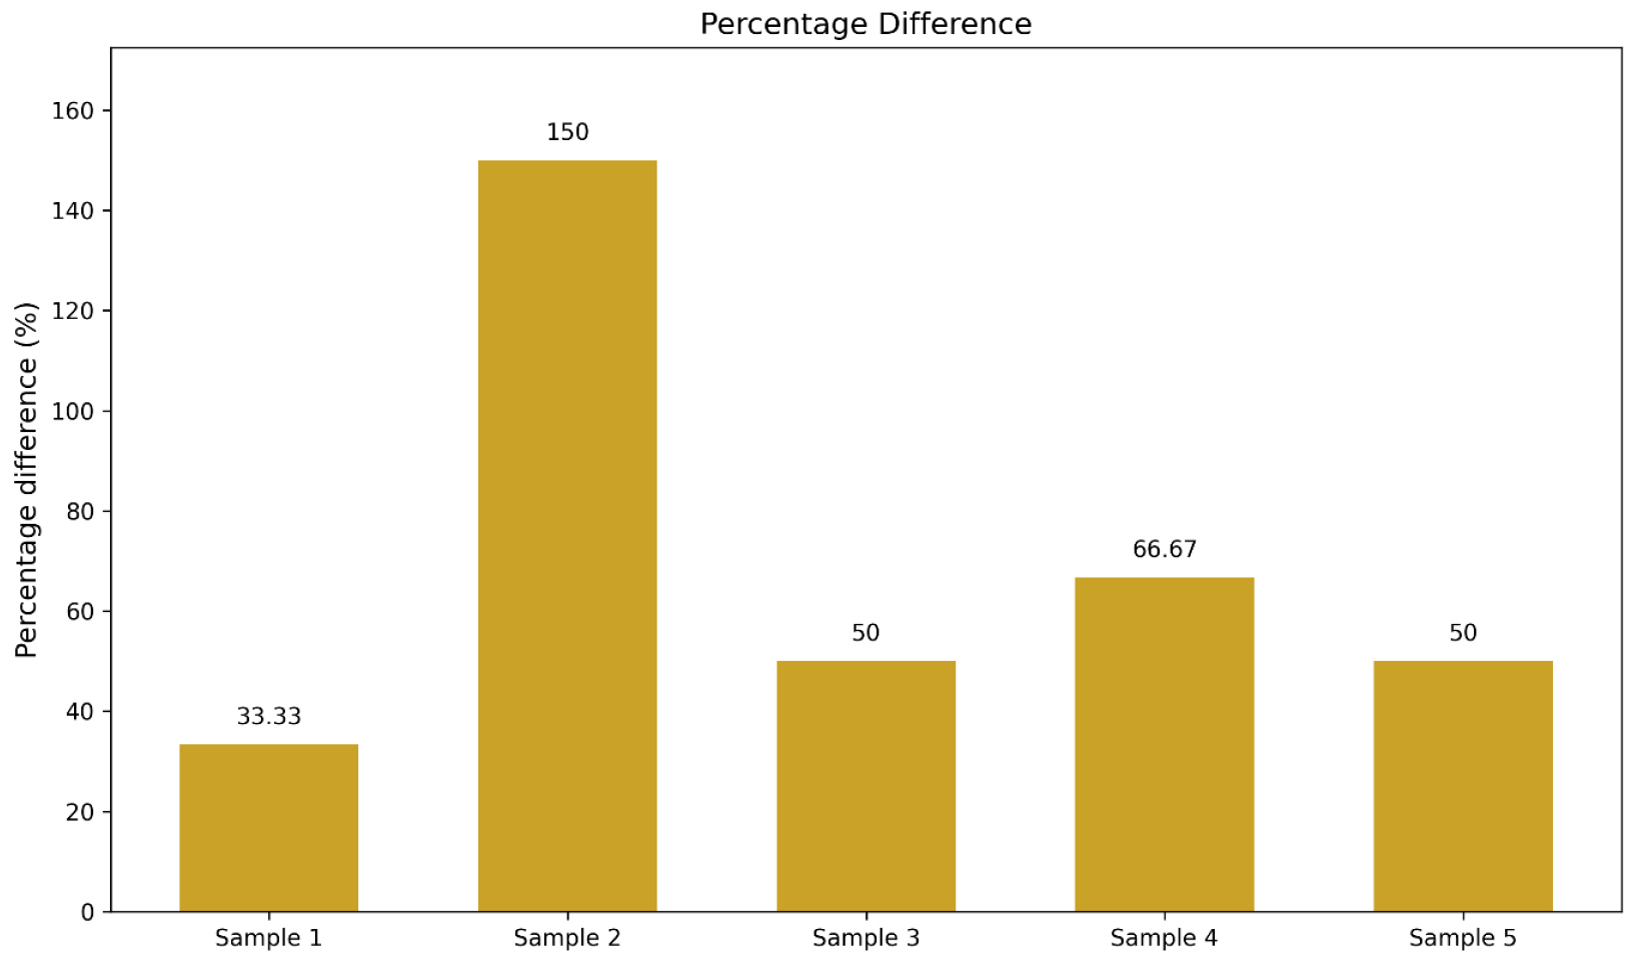
Figure 7 illustrates the percentage difference in microparticle concentration between the hot and cold outlets of the dispenser. The cold outlet remained unchanged across all samples compared to the original outlets. In contrast, the hot outlet consistently showed higher levels, with percentage differences ranging from about 33% to 150%, with an average of 70%, depending on the sample. This relationship demonstrates that the hot outlet produced markedly higher microparticle concentrations than the cold outlet. Several explanations can account for this finding. Elevated temperatures can weaken or soften polymer components within the hot water pathway, leading to the release of additional microparticles into the water. Hot water also has lower viscosity, which can reduce residence time and promote the resuspension of particles that would otherwise remain settled. Furthermore, any filtration that occurs before the heating stage cannot remove particles generated within the heated reservoir or at the outlet, and particles washed out from the sand used for filtration may further increase their concentration. Another possible explanation is that hot water outlets are often left unused for extended periods, allowing microparticle layers to accumulate inside the dispenser, which are then released when the hot tap is activated, resulting in higher measured concentrations.
Previous research has shown that hot water and hot beverages generally contain high concentrations of microparticles, including microplastics. This trend is reflected in the studies presented in Table 3 and aligns directly with the results of the present work. Our measurements revealed elevated microparticle levels in the hot outlet compared with both the cold outlet and the source, confirming that temperature-associated increases in microparticles are consistent with established findings in the literature.
| Study context | Condition studied | Key findings | Reference |
|---|---|---|---|
| Tea beverages | Hot vs. cold | Hot tea contained almost double the microplastics of iced tea | [38] |
| Drip coffee bags | Hot water | Hot water released thousands of microplastics from the drip filters | [39] |
| Plastic cups | Hot water | Hot water caused significant microplastic release into drinks | [40] |
| Disposable paper cups | Hot water | Hot water in lined paper cups leached microplastics into the water | [41] |
| Feeding bottles and breastmilk storage bottles | Hot use | Heated bottles released high amounts of microplastics | [42] |
| Dispenser cold vs. hot outlet water | Hot vs. cold | Hot water released 70% more microparticles than cold water | Present study |
While the general microparticle concentration pattern is consistent with the literature, the absolute concentrations measured in the present study (16–40 particles/L) were lower than those reported in some previous studies on commercially bottled and tap water, such as the 325 particles/L reported by Mason et al. [23] and the 440 particles/L reported by Tong et al. [24]. This difference reflects shorter storage duration of jugs in a high-turnover campus setting, as well as methodological differences, since optical microscopy captures a narrower, coarser particle-size range than fluorescence-based techniques such as Nile Red staining. Nevertheless, the repeated increase in microparticle concentration at the hot outlet, averaging 70% relative to the paired cold and original samples, suggests that the heating pathway contributes to additional particle release.
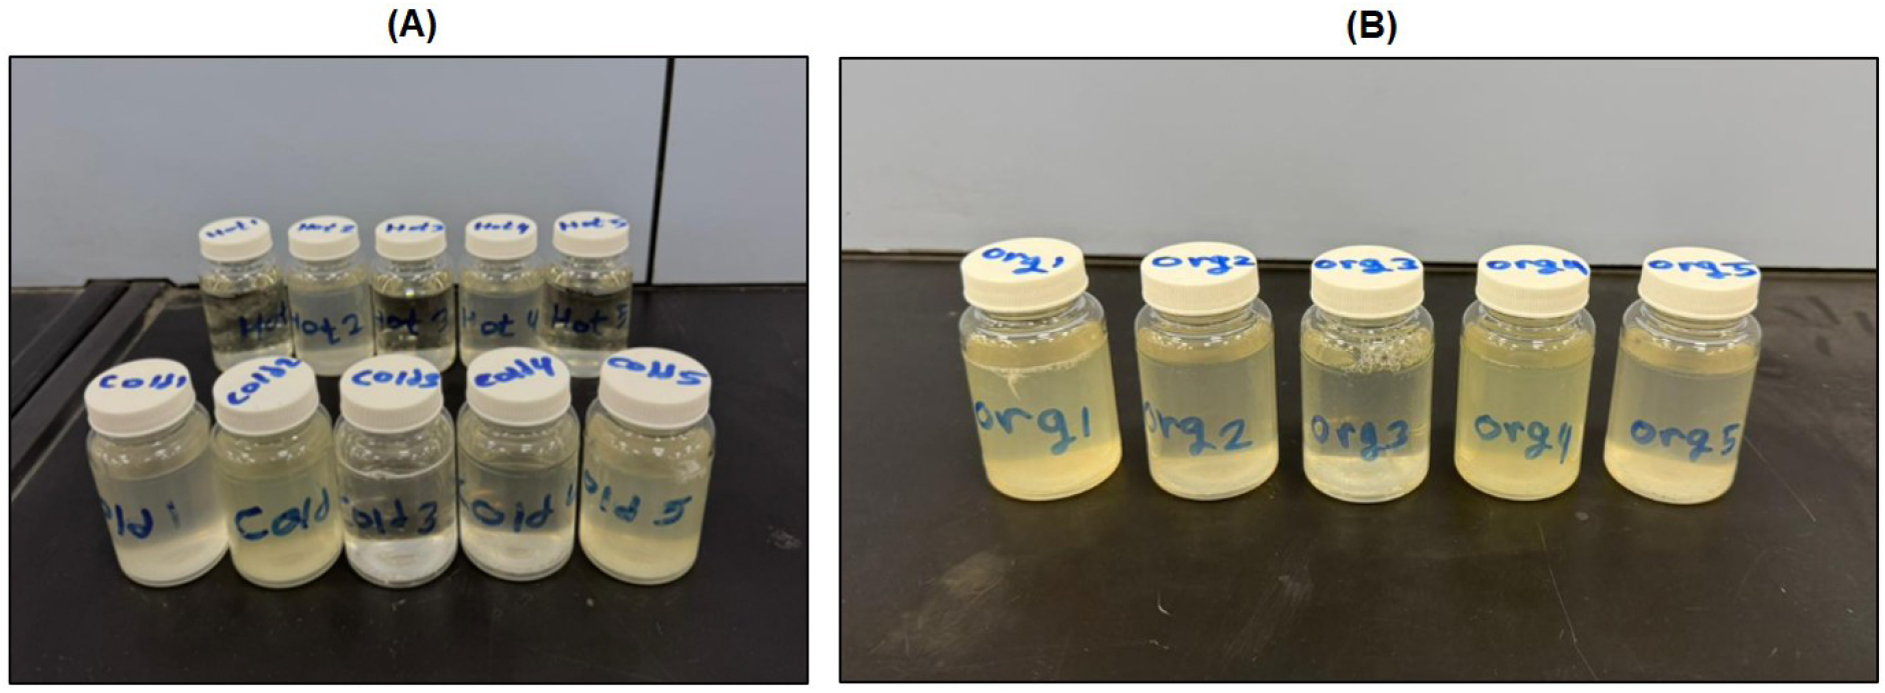
As shown in Figure 8, the results of the bacterial presence test indicated the absence of E. coli contamination in all tested samples. This conclusion was based on the fact that none of the samples turned dark blue after incubation; instead, they remained light yellow, confirming that no E. coli bacterial growth occurred. These results suggest that storing drinking water in large plastic jugs does not promote E. coli growth under the tested conditions. Furthermore, there was no noticeable difference between the hot and cold outlets, indicating that temperature variation within the dispenser system did not influence bacterial presence. Overall, the findings confirm that both storage and dispensing processes maintained satisfactory microbiological quality, ensuring that the water remained safe for consumption.
The results of the bacteria tests align with previous research findings that reported the absence of E. coli bacterial contamination in properly treated drinking water. Similar studies have shown that both bottled and dispenser water often meet microbiological safety standards, with no detectable bacteria, as shown in Table 4. The present results further confirm that large plastic storage jugs and dispenser systems do not promote bacterial growth.
| Water source studied | Study region | E. coli bacteria presence | Reference |
|---|---|---|---|
| Bottled water | Iran | No | [43] |
| Bottled water | Uganda | No | [44] |
| Bottled water | Canada | No | [45] |
| Bottled water | Saudi Arabia | No | [46] |
| Bottled jug water | UAE | No | Present study |
| Dispenser cold water | UAE | No | Present study |
| Dispenser hot water | UAE | No | Present study |
While the absence of E. coli indicates acceptable microbiological quality, this result should be interpreted within the context of the indicator used. E. coli is widely applied to assess faecal contamination in drinking water, and its absence suggests that the tested samples were microbiologically satisfactory in that respect. However, it does not exclude the possible presence of other microorganisms that are not of faecal origin. In dispenser systems, this is relevant for opportunistic organisms such as Legionella pneumophila, which may persist in warm sections of water systems or in parts subject to intermittent use and temporary stagnation [47]. Although the hot-water temperatures measured in the present study were high, localised cooler zones within the outlet pathway may still differ from the main reservoir conditions. Therefore, the present findings confirm the absence of faecal contamination, but a broader microbiological assessment may be considered in future investigations to provide a more comprehensive evaluation of dispenser safety.
Figure 9 presents pH levels measured from the original water sources and from the dispenser's hot- and cold-water outlets. A consistent trend is evident in the hot outlet results, showing that the hot water samples exhibited higher pH values than both the cold and original water, with a mean of 6.906 ± 0.228. In comparison, the cold-water samples had a mean of 6.638 ± 0.101, while the original water samples had a mean of 6.586 ± 0.134. Across the five dispensers, pH in the hot outlet was higher by a mean of 0.320 relative to the original source and 0.268 relative to the cold outlet, whereas the difference between the cold outlet and the original source was only 0.052. Both the cold and original samples exhibit a slightly more acidic profile than the hot water.
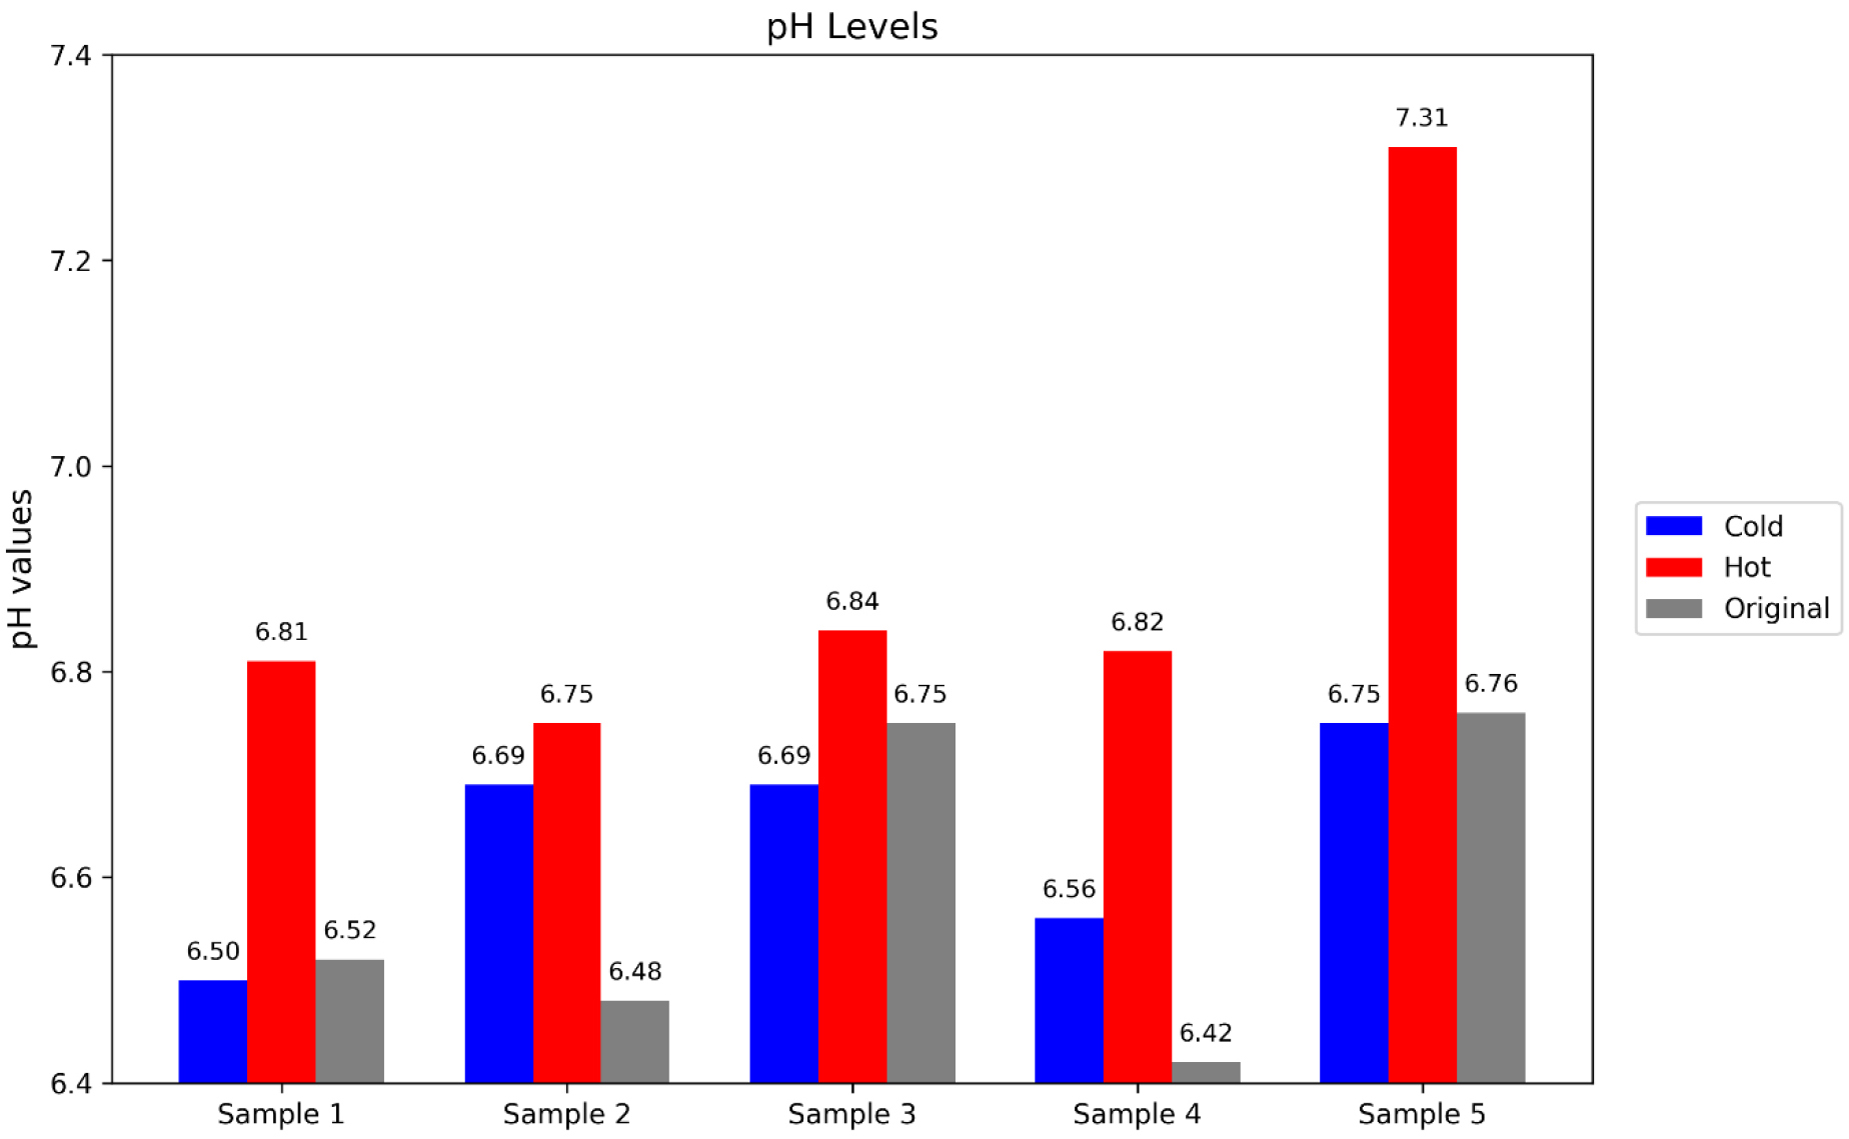
One clear observation is that the pH increases after water passes through the hot outlet. This rise in pH is mostly due to the effect of heat on water chemistry. When water is heated, gases such as carbon dioxide (CO2) become less soluble and escape more readily [48]. Since CO2 in water forms carbonic acid, which lowers pH, the loss of CO2 means there is less acid in the water, so the pH increases [49]. In addition, the hot water might interact with internal parts of the dispenser, and those materials could release substances that slightly raise the pH. Interestingly, the cold-water outlets show fluctuating results compared to the original samples with no consistent pattern. This fluctuation might be due to aeration, interactions with dispenser components, or limited CO2 release during dispensing. Nonetheless, all pH values across cold and hot outlets fall within the safe and acceptable range for drinking water of 6.5–8.5, as per the World Health Organization's (WHO) [50]. The findings indicate that neither the heating nor the cooling mechanisms of the dispensers introduce harmful acidity or alkalinity.
Table 5 shows the pH values reported on the labels of several bottled waters, along with the pH measured at the source jug and dispenser outlets in the present study. The label data are clustered around neutral values. In contrast, the measured values for jug and dispenser water (6.6–6.9) are slightly lower but still within the usual drinking water guideline range. This small difference indicates only minor changes in water chemistry during storage and dispensing, without clear evidence of significant deterioration in water quality.
| Brand name | Water source | pH level | Reference |
|---|---|---|---|
| Mai Dubai | Bottled water | 7.2 | [51] |
| Masafi Pure | Bottled water | 7.1 | [51] |
| Al Ain | Bottled water | 7.3 | [51] |
| Arwa | Bottled water | 7.0 | [51] |
| Nestle | Bottled water | 7.2 | [51] |
| Zulal | Bottled water | 7.5 | [52] |
| Zulal | Bottled jug water | 6.6 | Present study |
| Zulal | Dispenser cold water | 6.6 | Present study |
| Zulal | Dispenser hot water | 6.9 | Present study |
The difference observed between the label pH values reported for commercial UAE bottled waters (7.0–7.5) and the measured values in the present study (6.6–6.9) may be related to changes that occur after opening and during storage and handling, including gas exchange with the surrounding environment. This observation suggests that water chemistry may undergo small shifts between bottling and consumption, even when all measured values remain within acceptable limits. Future studies could monitor pH throughout the storage and dispensing period to better understand how these minor changes develop over time.
Figure 10 displays the turbidity levels of the original water sample and the cold and hot-water outlets from the dispenser. Turbidity is a key water-quality parameter that indicates the presence of suspended particles such as silt, microorganisms, or organic matter. The presented results show that the original water source had the lowest turbidity, with a mean of 0.554 ± 0.069 NTU, suggesting a relatively clean sample before entering the dispenser. However, an increase in turbidity is observed in all dispensed samples, particularly at the cold-water outlets. Cold water samples showed moderate turbidity, with a mean of 0.866 ± 0.141 NTU, showing a general pattern of higher turbidity than both the hot and original water. Hot water samples had slightly lower turbidity than their cold counterparts, with a mean of 0.802 ± 0.105 NTU, suggesting that some particles may have settled or been altered by the heating process. Moreover, the mean turbidity differences were 0.312 NTU between the cold and original outlets, 0.064 NTU between the cold and hot outlets, and 0.248 NTU between the hot outlet and the source. As cold water is used more frequently, water movement through internal plastic or metallic components may dislodge fine particles, thereby increasing turbidity. Conversely, hot water may cause certain suspended particles to dissolve or settle, slightly lowering turbidity. It is important to note that all recorded turbidity levels remained well below the WHO-recommended limit of 5 NTU for safe drinking water [50], suggesting that, while variations exist between outlets, the water clarity remains within acceptable standards.
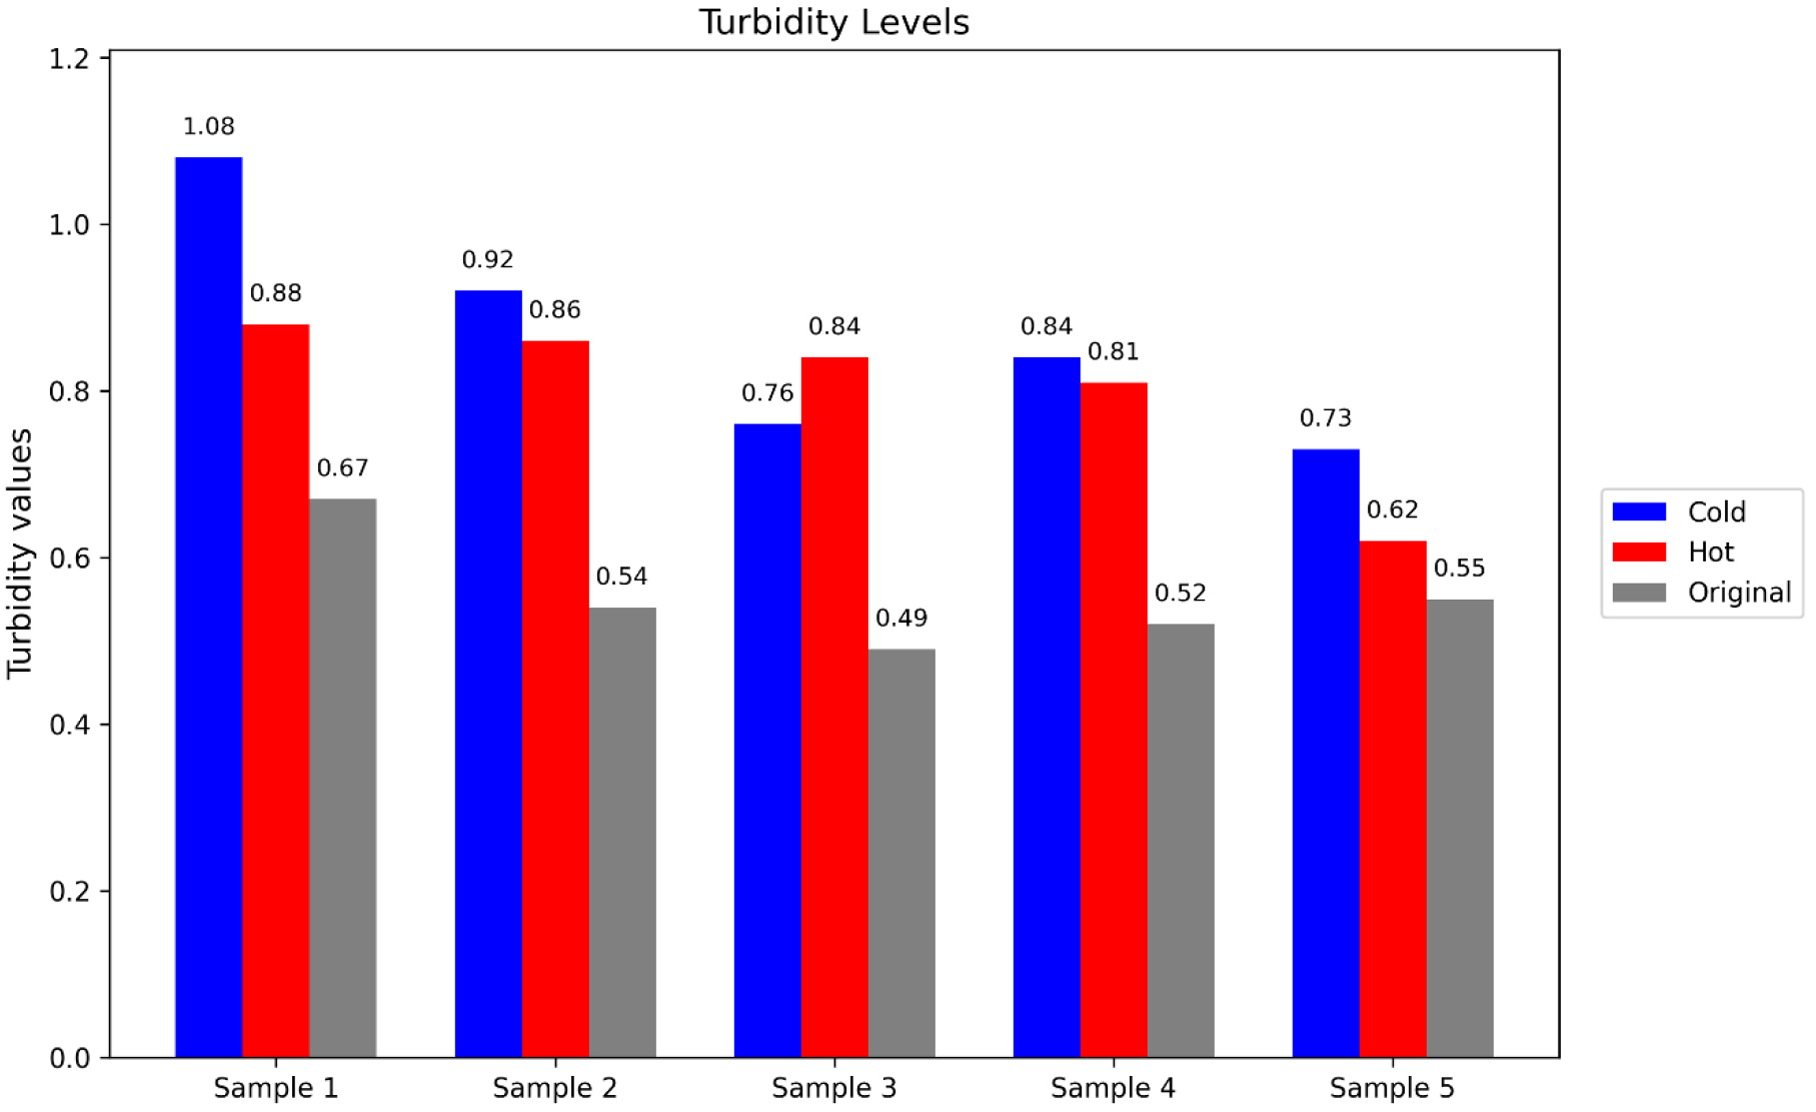
Although the cold outlet showed a slightly higher average turbidity than the hot outlet, the microparticle counts did not follow the same pattern. This suggests that turbidity may be influenced by very fine suspended particles that are not fully captured in the microscopic particle count. Therefore, turbidity alone may not be sufficient to reflect microparticle contamination, and interpreting dispenser performance based on a single parameter could be misleading. For this reason, the multi-parameter approach adopted in the present study provides a more complete assessment of water quality.
The results obtained from all the processes examined in this study may vary depending on the source of water and the dispenser brand and mechanism. In this work, samples were collected from dispensers at several indoor locations across the campus, but comparisons of the data did not reveal a clear or systematic trend in water quality attributable solely to location. Any minor differences between sites are more likely to be linked to local factors, such as dispenser age, maintenance frequency, or use intensity, rather than the campus location itself. In contrast, unlike the present study, bacteria have been found in bottled water, especially in developing countries, due to a lack of advanced technologies to treat such biological contaminants, as observed in [53], [54]. A poorly treated water source could increase the concentration of microparticles, resulting in altered pH and turbidity values [37]. Moreover, dispensers' functionality differs from one brand to another, as some brands may use advanced water treatment techniques unavailable in others. These functional differences play a significant role in the variability of observed water quality outcomes.
The findings of this study carry meaningful implications for public health policy, institutional management, and water safety regulation, particularly in regions where dispensers represent the primary point-of-use water delivery mechanism for large segments of the population. From a regulatory standpoint, the observed 70% average increase in microparticle concentration in hot dispenser outlets highlights a critical gap in current water quality standards. Existing international guidelines, including those of the WHO, do not establish enforceable threshold limits for microparticles in drinking water at the point of use. Regulatory bodies in the UAE and comparable markets should consider developing specific standards for microparticle concentrations in dispensed water, especially at the hot outlet, and require periodic third-party water quality testing as part of dispenser licensing or product certification frameworks. At the institutional and facility management level, the results suggest that organisations operating large numbers of water dispensers, such as universities, hospitals, corporate offices, and government buildings, should revise their procurement and maintenance protocols. Specifically, facility managers should prioritise the use of cold water outlets for drinking purposes and discourage routine use of the hot outlet for direct water consumption. Maintenance schedules should be revised to include more frequent inspection and replacement of internal filtration media and heated reservoir components, given that these are likely sources of elevated microparticle release. The findings also indicate that the existing rapid-sand filtration systems integrated within the tested dispensers provided no measurable reduction in microparticle concentration; accordingly, decision-makers should consider transitioning to dispensers equipped with more effective point-of-use filtration technologies, such as activated carbon or membrane-based systems capable of retaining sub-micron particles. From a public health communication perspective, consumers, particularly those in settings where hot water dispensers are habitually used to prepare hot beverages, should be made aware of the elevated risk of microparticle exposure associated with this practice. This suggestion is consistent with findings from comparable studies on hot beverages, feeding bottles, and plastic cups summarised in Table 3. Health authorities and consumer protection agencies should incorporate this evidence into public advisories and product labelling requirements for water dispensers sold or operated in the region.
This research paper examined the effects of using hot and cold water dispensers and compared them with those of the original water source, providing a comprehensive analysis of water treatment before and after dispensing. Standard laboratory equipment, such as a microscope (Kern Optics), along with a pump (Rocker 300) and a cellulose nitrate membrane filter, biological reagent (Colilert), pH meter (HQ40d), and turbidity meter (2100P TurbidityMeter), was used to determine the microparticles concentration, bacteria presence, pH levels and turbidity levels, respectively. The findings of the present study indicate that dispensers integrated with rapid-sand filtration are not capable of reducing microparticle concentration; in fact, an average increase of 70% of microparticle concentration was observed in the hot water outlet compared to the cold water outlets and the original samples. Using water dispensers had minimal effects on water quality, as measured by pH and turbidity, indicating that all samples meet the WHO water quality requirements. Lastly, none of the samples tested positive for Escherichia coli, confirming the microbiological safety of the water across all tested sources. Therefore, hot-water outlet dispensers are not recommended, as they elevate the concentration of emerging contaminants. In contrast, the use of cold water outlets is recommended, as they did not show any increase in emerging contaminant concentrations.
Although this study examined multiple water quality parameters to evaluate dispenser effectiveness, further assessments and a larger sample size would contribute to a more comprehensive understanding of their impact. For example, integrating chemical analyses to detect potential contaminants such as heavy metals, including arsenic, aluminium, and iron, would offer deeper insight into water safety. In addition, evaluating other emerging pollutants, such as pharmaceutical residues, organic micropollutants, and microplastics, and determining their concentrations and relevant properties, such as shape, colour, and size, could broaden the scope of the investigation. Expanding the number of tested samples to at least 20 dispensers and the original water source would also improve the reliability of the findings and support more robust conclusions.
The authors would like to express their gratitude to the American University of Sharjah for providing resources for this research. The authors also wish to extend their sincere appreciation to the lab instructor, Riyad Temam, for his valuable guidance and continuous assistance throughout the experimental work.
- ,
Waters Vital Role: Challenges and Consequences of Pollution: A Review ,Int. J. Health Sci. Res. , Vol. 14 (2), :347-3542024, https://doi.org/10.52403/ijhsr.20240243 - ,
A review of physicochemical and biological contaminants in drinking water and their impacts on human health ,Water Sci. Eng. , Vol. 16 (4), :333-3442023, https://doi.org/10.1016/j.wse.2023.04.003 - , , How Much Freshwater Is Available? in Hydro-Climatic Extremes in the Anthropocene in Springer Climate, 2023
- ,
Ecosystem services of Earths largest freshwater lakes ,Ecosyst. Serv. , Vol. 41 , 2020, https://doi.org/10.1016/j.ecoser.2019.101046 - ,
Fresh Water availability and Its Global challenge ,J. Mar. Sci. Res. , Vol. 2 (1), :01-032023, https://doi.org/10.58489/2836-5933/004 - , Monitoring Vegetation, Water, and Land Surface Temperature in Dubai and Muscat Over Three Time Periods, The 10th International Conference on Civil, Structural and Transportation Engineering, 2025
- ,
Life cycle assessment of tetrapod concrete armour units ,Front. Sustain. Cities , Vol. 7 , 2025, https://doi.org/10.3389/frsc.2025.1592987 - , Life Cycle Assessment of Cementitious Bricks, The 10th International Conference on Civil, Structural and Transportation Engineering, 2025
- ,
Water insecurity: an urgent threat to child health ,Lancet Child Adolesc. Health , Vol. 7 (2), :772023, https://doi.org/10.1016/S2352-4642(23)00003-2 - ,
Freshwater availability status across countries for human and ecosystem needs ,Sci. Total Environ. , Vol. 792 , 2021, https://doi.org/10.1016/j.scitotenv.2021.148230 - ,
Safeguarding Chinas water resources ,Natl. Sci. Rev. , Vol. 5 (1), :102-1072018, https://doi.org/10.1093/nsr/nwy007 - ,
Socio-political processes must be emphasised alongside climate change and urbanisation as key drivers of urban water insecurity ,Water Policy , Vol. 23 (1), :36-572020, https://doi.org/10.2166/wp.2020.333 - ,
The Integral Management of the Wastewater Treatment Sector in Mexico Using a Circular Economy Approach ,Recycling , Vol. 9 (5), 2024, https://doi.org/10.3390/recycling9050084 - ,
Long-term performance and economic evaluation of full-scale MF and RO process – A case study of the changi NEWater Project Phase 2 in Singapore ,Water Cycle , Vol. 1 , :128-1352020, https://doi.org/10.1016/j.watcyc.2020.09.001 - , Vision 2030: How water scarcity in Saudi Arabia persists, 2024
- ,
Review on new spending of United States Bipartisan Infrastructure Bill ,J. Infrastruct. Policy Dev. , Vol. 6 (2), 2022, https://doi.org/10.24294/jipd.v6i2.1507 - ,
Water quality aspects related to domestic drinking water storage tanks and consideration in current standards and guidelines throughout the world – a review ,J. Water Health , Vol. 18 (4), :439-4632020, https://doi.org/10.2166/wh.2020.052 - ,
Microplastics in Drinking Water: A Review of Sources, Removal, Detection, Occurrence, and Potential Risks ,Toxics , Vol. 13 (9), 2025, https://doi.org/10.3390/toxics13090782 - ,
Microplastic pollution in bottled water: a systematic review ,Int. J. Environ. Sci. Technol. , Vol. 22 (2), :1283-12962025, https://doi.org/10.1007/s13762-024-05807-1 - ,
Microplastics and associated chemicals in drinking water: A review of their occurrence and human health implications ,Sci. Total Environ. , Vol. 912 , 2024, https://doi.org/10.1016/j.scitotenv.2023.169594 - ,
Microplastics contamination in water supply system and treatment processes ,Sci. Total Environ. , Vol. 926 , 2024, https://doi.org/10.1016/j.scitotenv.2024.171793 - ,
Environmental exposure to microplastics: An overview on possible human health effects ,Sci. Total Environ. , Vol. 702 , 2020, https://doi.org/10.1016/j.scitotenv.2019.134455 - ,
Synthetic Polymer Contamination in Bottled Water ,Front. Chem. , Vol. 6 , 2018, https://doi.org/10.3389/fchem.2018.00407 - ,
Occurrence and identification of microplastics in tap water from China ,Chemosphere , Vol. 252 , 2020, https://doi.org/10.1016/j.chemosphere.2020.126493 - ,
Plastic Debris in 29 Great Lakes Tributaries: Relations to Watershed Attributes and Hydrology ,Environ. Sci. Technol. , Vol. 50 (19), :10377-103852016, https://doi.org/10.1021/acs.est.6b02917 - ,
The use of Colilert-18, Colilert and Enterolert for the detection of faecal coliform, Escherichia coli and Enterococci in tropical marine waters, Trinidad and Tobago ,Reg. Stud. Mar. Sci. , Vol. 40 , 2020, https://doi.org/10.1016/j.rsma.2020.101490 - ,
Quantitative image analysis of microplastics in bottled water using artificial intelligence ,Talanta , Vol. 266 , 2024, https://doi.org/10.1016/j.talanta.2023.124965 - ,
Synthetic Microplastics in UK tap and bottled water; Implications for human exposure ,Emerg. Contam. , Vol. 11 (1), 2025, https://doi.org/10.1016/j.emcon.2024.100417 - ,
Characterization of microplastics in water bottled in different packaging by Raman spectroscopy ,Environ. Sci.: Water Res. Technol. , Vol. 9 (12), :3391-33972023, https://doi.org/10.1039/D3EW00197K - ,
Microplastics: An overview on separation, identification and characterization of microplastics ,Mar. Pollut. Bull. , Vol. 170 , 2021, https://doi.org/10.1016/j.marpolbul.2021.112604 - ,
Microbial pollution of water with special reference to coliform bacteria and their nexus with environment ,Energy Nexus , Vol. 1 , 2021, https://doi.org/10.1016/j.nexus.2021.100008 - ,
Use of two formulations of Colilert and QuantiTrayQuantiTray™ for assessment of the bacteriological quality of water ,Water Res. , Vol. 31 (10), :2495-24991997, https://doi.org/10.1016/S0043-1354(96)00342-9 - , Coliform and E. coli Water Testing with Colilert
- ,
Microplastic pollution of bottled water in China ,J. Water Process Eng. , Vol. 40 , 2021, https://doi.org/10.1016/j.jwpe.2020.101884 - ,
Assessing exposure of the Australian population to microplastics through bottled water consumption ,Sci. Total Environ. , Vol. 837 , 2022, https://doi.org/10.1016/j.scitotenv.2022.155329 - ,
Occurrence of microplastics in commercially sold bottled water ,Sci. Total Environ. , Vol. 867 , 2023, https://doi.org/10.1016/j.scitotenv.2023.161553 - ,
Microplastics pollution indices of bottled water from South Eastern Nigeria ,Int. J. Environ. Anal. Chem. , Vol. 103 (19), :8176-81952021, https://doi.org/10.1080/03067319.2021.1982926 - ,
Synthetic microplastics in hot and cold beverages from the UK market: Comprehensive assessment of human exposure via total beverage intake ,Sci. Total Environ. , Vol. 996 , 2025, https://doi.org/10.1016/j.scitotenv.2025.180188 - ,
Pouring hot water through drip bags releases thousands of microplastics into coffee ,Food Chem. , Vol. 415 , 2023, https://doi.org/10.1016/j.foodchem.2023.135717 - ,
Microplastics and other harmful substances released from disposable paper cups into hot water ,J. Hazard. Mater. , Vol. 404 , 2021, https://doi.org/10.1016/j.jhazmat.2020.124118 - ,
Disposable plastic materials release microplastics and harmful substances in hot water ,Sci. Total Environ. , Vol. 818 , 2022, https://doi.org/10.1016/j.scitotenv.2021.151685 - ,
Microplastics release from infant feeding bottles and milk storage bags ,Food Control , Vol. 168 , 2025, https://doi.org/10.1016/j.foodcont.2024.110921 - ,
Evaluation of the presence of coliform in bottled drinking water, released in Sari in 2016 ,Environ. Health Eng. Manag. , Vol. 5 (3), :181-1862018, https://doi.org/10.15171/EHEM.2018.25 - ,
Bacteriological and Physical Quality of Locally Packaged Drinking Water in Kampala, Uganda ,J. Environ. Public Health , Vol. 2015 , :1-62015, https://doi.org/10.1155/2015/942928 - ,
Reducing water quality data inequities: A low-cost to a membrane filtration technique for the quantification of Escherichia coli in drinking water in low-resource contexts ,PLOS Water , Vol. 4 (5), 2025, https://doi.org/10.1371/journal.pwat.0000367 - ,
Bacteriological Evaluation of Tap Water and Bottled Mineral Water in Taif, Western Saudi Arabia ,Int. J. Curr. Microbiol. Appl. Sci. , Vol. 4 (12), :600-6152015https://www.ijcmas.com/vol-4-12/Ahmad%20F.%20Shahaby,%20et%20al.pdf - ,
Stagnation arising through intermittent usage is associated with increased viable but non culturable Legionella and amoeba hosts in a hospital water system ,Front. Cell. Infect. Microbiol. , Vol. 13 , 2023, https://doi.org/10.3389/fcimb.2023.1190631 - ,
Solubility of CO2 in water from −1.5 to 100 °C and from 0.1 to 100 MPa: evaluation of literature data and thermodynamic modelling ,Fluid Phase Equilib. , Vol. 208 (1–2), :265-2902003, https://doi.org/10.1016/S0378-3812(03)00041-4 - ,
Probing Solubility and pH of CO2 in aqueous solutions: Implications for CO2 injection into oceans ,J. CO2 Util. , Vol. 71 , 2023, https://doi.org/10.1016/j.jcou.2023.102463 - , Drinking-water
- , How Does Local Bottled Water Affect Your Coffee Experience?, Specialty Batch Coffee, 2024
- , Visiting the drinking water department of the Sharjah government, PETplanet, 2024
- ,
Occurrence Of Antibiotic-Resistant Bacteria In Sachet And Bottled Water Brands In Ondo City, Nigeria ,Int. J. Adv. Res. Publ. , Vol. 1 (6), :58-672017https://www.ijarp.org/published-research-papers/dec2017/Occurrence-Of-Antibiotic-resistant-Bacteria-In-Sachet-And-Bottled-Water-Brands-In-Ondo-City-Nigeria.pdf - ,
Bacteriological quality of bottled drinking water versus municipal tap water in Dharan municipality, Nepal ,J. Health Popul. Nutr. , Vol. 35 (1), 2016, https://doi.org/10.1186/s41043-016-0054-0