


Different factors have promoted the diffusion of Electric Vehicles (EV) in the last decade; some factors can be considered at a large scale such as the:
Reduction of energy consumption in the transport sector with the related greenhouse gases emissions [1];
The reduction of the almost-total dependence of the transport sector moving the energy demand from oil to electricity. Other factors can be attributed at local scale considering;
The necessity to reduce emission of local pollutants [Nitrogen oxide (NOx), Carbon monoxide (CO), Sulfur oxide (SOx), particulate matter, unburned hydrocarbons] [2], [3] to improve the local air quality in urban areas;
To lower the costs per kilometre for the end-users when compared to internal combustion engine vehicles [4].
Moreover, the Directives and European policy on the use of Renewable Energy Systems (RES), the Energy Performance of Buildings (EPBD) and Energy related Products (ErP) that have drawn the framework of requirements for the use of environmentally friendly technologies using renewable energy should be considered. Since the publication of the Directive on the promotion of the use of energy from renewable sources [5], Electric Heat Pumps (EHP) are officially part of this development and are valued as a useful tool to achieve European targets concerning energy efficiency and the use of renewable energy.
The combination of a widespread adoption of electric vehicles together with the deployment of EHPs leads to an increased and totally different household electrical demand characteristics. It also poses new challenges to the electric grid regarding its stability with the need of upgrading the electricity distribution infrastructure [6], [7] as well as for the strategy of building new power generation capacity. On this track several possible demand-limiting strategies have been proposed in order to avoid or at least contain the investment needed to reinforce the electric infrastructure as well as to reduce the negative effects on the electricity distribution network, such as [8]-[12]:
Time shifting of heating/cooling (where the operation of a heat pump is moved to periods of off-peak electric demand with the provision of sufficient thermal buffering in order to temporally decouple the operation of the heat pump from the space heating/cooling);
Time shifting of EVs battery charging (battery charging was restricted to periods of off-peak electric demand);
Transmission of electricity from an on-board battery to the central electric grid (V2G approach);
Smart battery charging (customers and network operators can schedule EVs charging profiles in order to obtain technical and economic benefits).
A reduction of the pressure on the electric grid, that can be expected with a widespread use of EVs/EHPs, is also achieved by using micro-cogeneration [Micro Combined Head and Power (MCHP)] systems; these devices are characterized by the combined production of electric and thermal energy from a single fuel source and defined in the Energy Efficiency Directive as units with an electric capacity lower than 50 kW. They are designed to totally or partially match electricity, heat, hot water and/or cooling needs from different types of buildings, including existing, renovated or new buildings and are considered by the European Community as one of the most effective measures to save primary energy and reduce greenhouse gas emissions in domestic and small-scale applications when compared with the conventional system [13], [14]. The widespread use of this generation technology has the additional advantages of reducing electric transmission and distribution losses and diversifying electric energy production [15], [16], thus improving the security of energy supply [17].
The MCHP systems are usually applied under a heat-load following control strategy as they are mainly intended to replace domestic boiler with a large fraction of the electricity usually being produced and exported with low revenues at times (i.e., during the night) when the electrical load of the building is low. In a complementary way EVs are mostly driven during the day and charged at home during the night thus suggesting that the recharging of EVs could drastically increase the use of electricity produced by the micro-cogeneration devices as well as boost the profitability of the system. On this opportunity several papers have investigated the possible synergy between micro-cogeneration and EVs charging. Ribberink et al. [18] simulated the impact of electric vehicle charging on the economics of a 2 kWel internal combustion engine-based MCHP system applied in a detached house in Ottawa (Canada). The performance of a fuel-cell cogenerator system combined with a plug-in hybrid EV was studied in [19] through an optimal operation planning model based on mixed integer linear programming. A residential building-integrated micro-cogeneration system was simulated in [20], [21] to assess the effect of the introduction of overnight EV charging on the energy, environmental and economic performance. Angrisani et al. [22] analyzed, by means of dynamic simulation, the integration between a MCHP system and the energy demands of both an electric vehicle and a typical semidetached house. Wakui et al. [23], [24] performed a feasibility study, from energy point of view, on the combined use of residential cogeneration systems and plug-in hybrid electric vehicle.
The presence in many current applications of an energy demand for electricity, heating and cooling, suggests profitably combining micro-cogeneration units with various technologies currently available for cooling generation [25], [26] such as thermally fed or electrically-driven systems. Among the technologies for composing trigeneration systems, the combination of micro-cogeneration units with electric chillers [27], allows to increase the use of co-generated electricity enhancing the system profitability and reducing the electric peak load associated with the cooling loads during the summer. Different studies considered the incorporation of electric chillers/heat pumps to the traditional micro-cogeneration. Cooper et al. [28], by using a simulation approach, analyzed the relative energy and environmental performances of six micro-trigeneration systems composed of an electric air source heat pump and a solid oxide fuel cell micro-cogeneration unit. Malinowska and Malinowski [29] compared in terms of exergetic efficiency, a small-scale combined heat and power plant incorporating an electric heat pump with a conventional system. Ciampi et al. [30] evaluated the on-site performance during the cooling season of a micro-trigeneration plant composed of a MCHP unit coupled with an electric chiller.
The authors have already investigated [31] a system composed of a MCHP unit (with 6.0 kW as rated nominal electric output and 11.7 kW as rated nominal thermal output) coupled with an electric air-cooled water chiller (EHP with a nominal cooling capacity equal to 4.5 kW) serving a typical Italian residential multi-family house located in Naples (south of Italy). The proposed system, simulated by means of the dynamic simulation software TRNSYS (version 17) [32], covered heating/cooling loads, domestic hot water, electric requirements of domestic appliances and charging of a single electric vehicle.
In this paper a set of seven EV charging profiles have been considered that represent scenarios based upon actual driving data in which electric vehicles would drive three different daily distances (30 km, 53 km and 75 km) and would be charged at three different power levels (2.2 kWel, 3.6 kWel and 6.6 kWel). The performances of the Proposed System (PS) based on a micro-cogeneration device, are compared with those of a Conventional System (CS) composed of a natural gas-fired boiler (for thermal energy production), an electric air-cooled vapor compression water chiller for cooling purposes and a power plant connected to the electric grid. The simulation results are analyzed not only in terms of:
Capability of micro-cogeneration systems in mitigating the effects of a potential increase in electricity demand associated with EVs charging/EHPs utilization;
Primary energy saving, but also from the point of views of;
o Avoided carbon dioxide emissions;
o Economic benefits that could be achieved in the case of the proposed system being used instead of a conventional plant based on separate energy production.
Figure 1 shows the scheme of the system configuration analyzed in this study. The main components of the plant are a natural gas fuelled internal combustion engine-based Micro-cogeneration device (MCHP), an auxiliary natural gas-fired heater (BOILER), an electric Air-Cooled Water Chiller (ACWC), a combined Hot Water Storage Tank (HWT) with three Immersed Heat Exchangers (IHE1, IHE2, IHE3) and a Cold Water Storage Tank (CWT) with one Immersed Heat Exchanger (IHE4), three fan-coils (one per flat) installed in the multi-family residential building, and auxiliaries (pumps, fans, thermostats, 3-way valves, flow diverters, etc.). The system under investigation is devoted to satisfying the space heating and cooling sensible loads, domestic hot water requirements, as well as electric demands.
Scheme of the proposed micro-trigeneration system
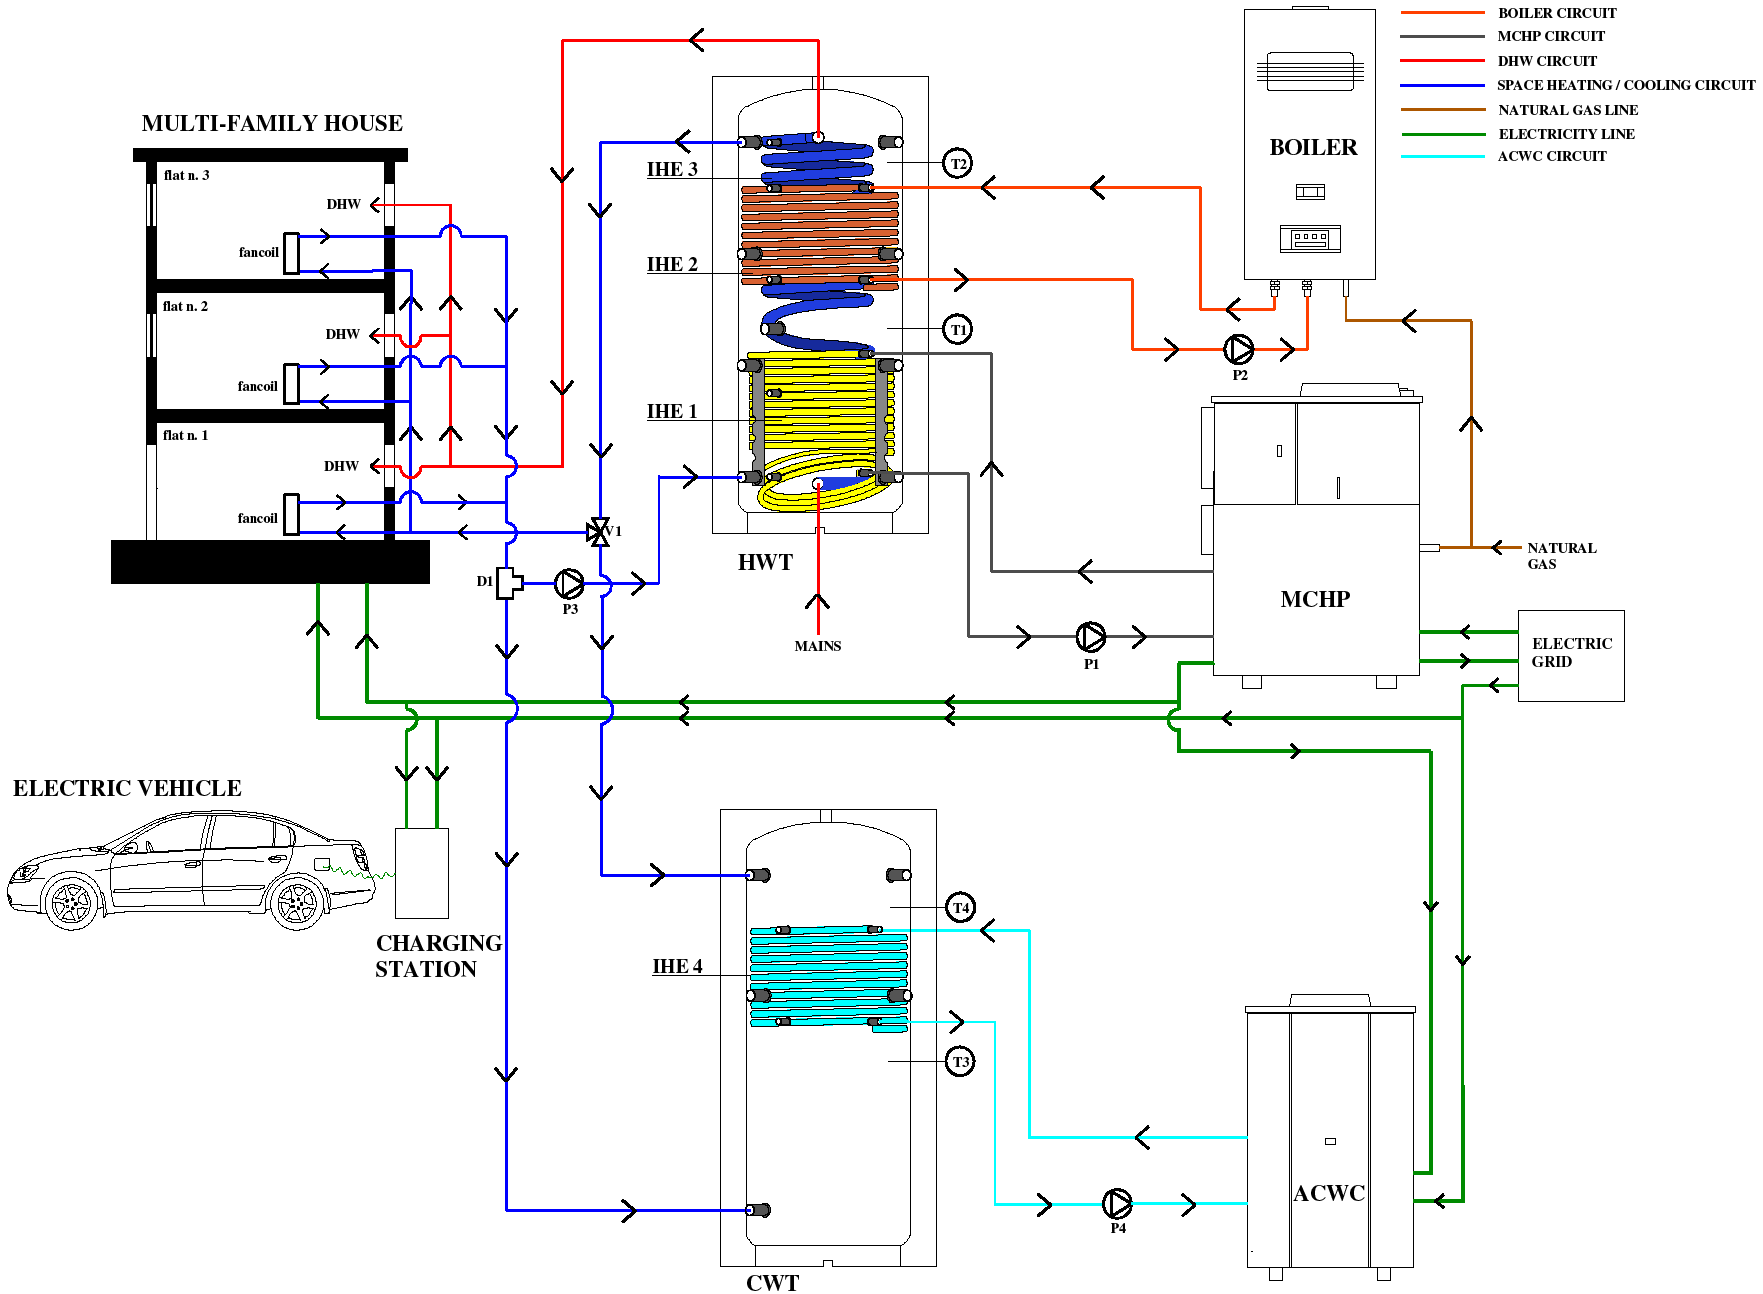
The MCHP device is connected to the immersed heat exchanger located at the bottom of the hot water storage and is operated under a thermal load-following control strategy during the whole year. This means that the system operates depending on the water temperature in the HWT: when this temperature is lower than the set-point value, the unit starts providing its maximum electric and thermal outputs; when this water temperature exceeds the target value, the MCHP unit is turned off. Thermal power during unit operation is recovered from the exhaust gases and the engine jacket of the micro-cogenerator by means of a water-glycol mixture and transferred to the HWT. The heat supplied by the MCHP unit is used for both heating purposes and DHW production. An auxiliary natural gas-fired heater is connected to the immersed heat exchanger located at the top of the hot water tank. The electricity generated by the micro-cogeneration system is a by-product and is used directly for the operation of the electric air-cooled water chiller, the lighting systems, the domestic appliances (such as vacuum cleaner, dishwasher, washing machine, PC, TVs, fridge), the auxiliaries as well as for the charging of a single electric vehicle. Any unused excess electricity is sent to the power line, with the electric grid covering the peak demands.
The ACWC (that belongs to the family of EHPs) is used for producing chilled water for cooling purposes; it is controlled depending on the temperature of the water in the CWT: when this temperature is greater than the set-point value, the unit starts providing its cooling output; when this water temperature drops below the target value, the air-cooled water chiller is turned off.
The hot/chilled water is delivered through pipes from the tanks to the fan-coils installed inside the building when there is a call for heating/cooling from the building. The heating season is assumed to go from November 15th to March 31st (according to Italian Law [33]), with the cooling season from April 1st to November 14th. The room thermostat set-point is assumed equal to 21.0 °C during the heating period and 26.0 °C during the cooling period with a dead-band of ±0.5 °C. The room temperature is controlled during the whole duration of each day.
Each component of the whole system is simulated using the dynamic software TRNSYS (version 17) [32], where each physical piece of the thermodynamic equipment is modelled with a component (named “Type”) that is a FORTRAN source code model. The simulation models are run under the Naples (south of Italy) weather conditions specified by means of a specific EnergyPlus weather data file [34]. A simulation time-step equal to 0.005 hours is used. In the following sections, the main features of the plant component, the “Types” and the control logic used in this study are described in more detail.
A Multi-Family House (MFH) composed of three flats is modelled in this study. The geometrical layout of the MFH is basically a multiplication of a single family house type building geometry. All the flats have the same useable floor area (96.0 m2), while the net height of each flat is 3.0 m; five windows (with double glazing), for a total area equal to 10.8 m2, were considered for each flat. In this study, the thermal transmittance values of both the walls (Uwalls) and the windows (Uwindows) are equated to the minimum threshold values required by Italian Law [35]: 0.40 W/m2K for the external walls, 0.38 W/m2K for the roof, 0.42 W/m2K for the ground, and 2.60 W/m2K for the windows.
The number of interior volume air changes that occur per hour (infiltration rate), induced by wind and stack effect on the building envelope, is assumed as constant and equal to 0.28 h−1 for each single flat according to the European Standard EN 12831:2003 [36].
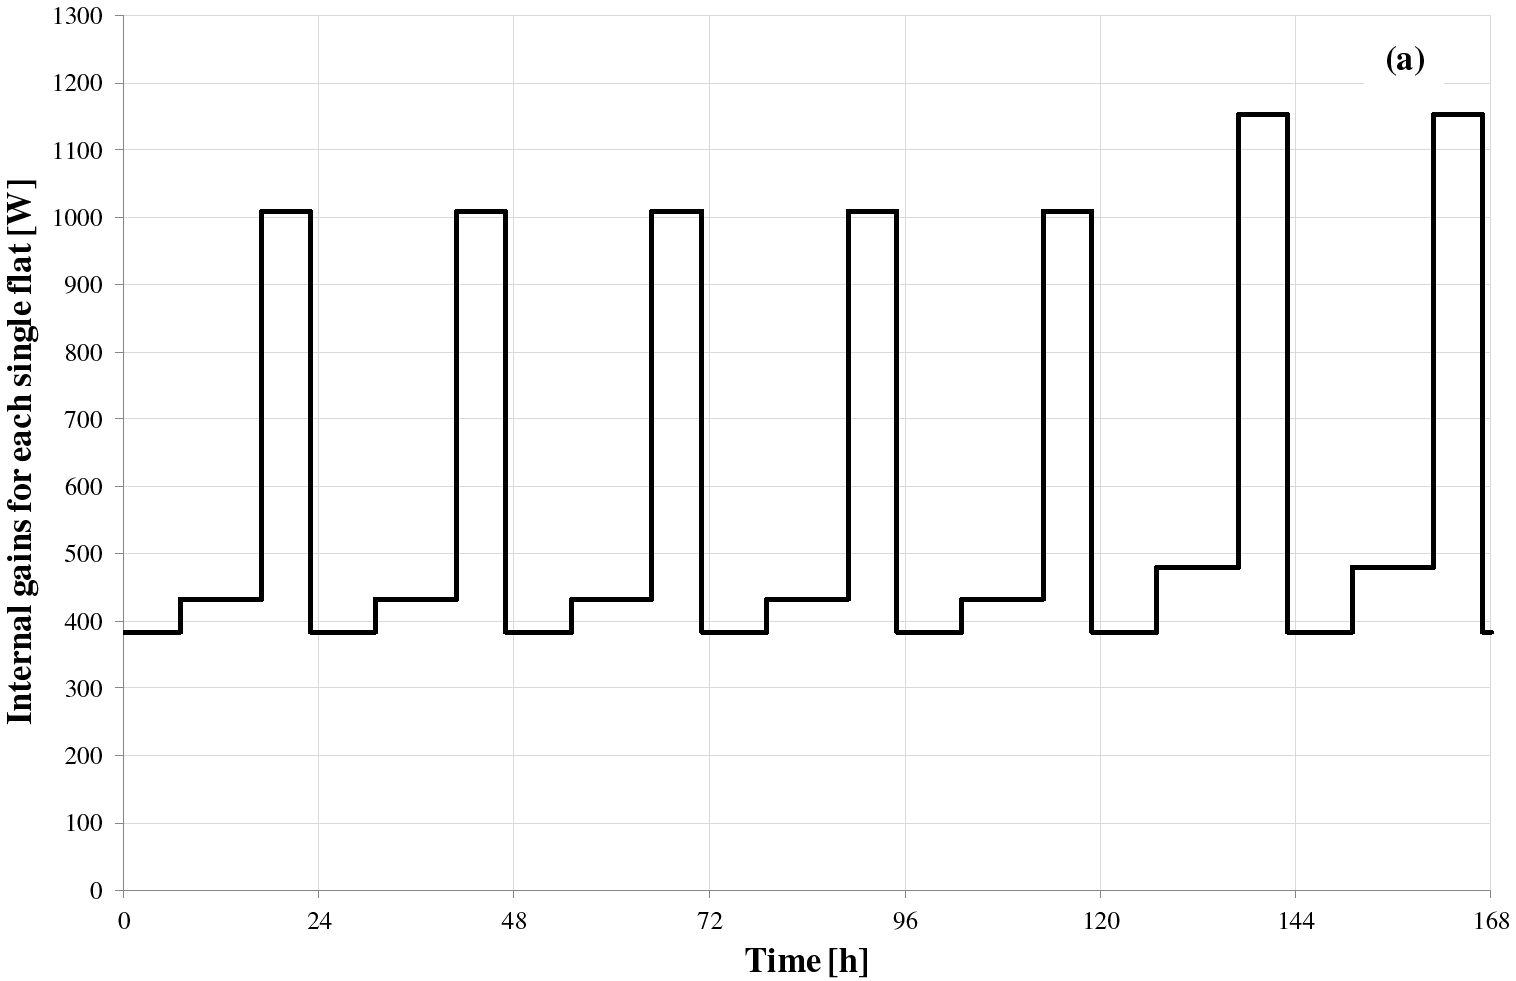
Heat coming from the occupants, domestic appliances and lighting systems is taken into account for each flat according to the weekly profile suggested by the Italian Standard UNI/TS 11300-1 [37] (Figure 2a). It corresponds to a weekly internal gain of 0.140 kWh/m2.
Weekly profiles of internal gains
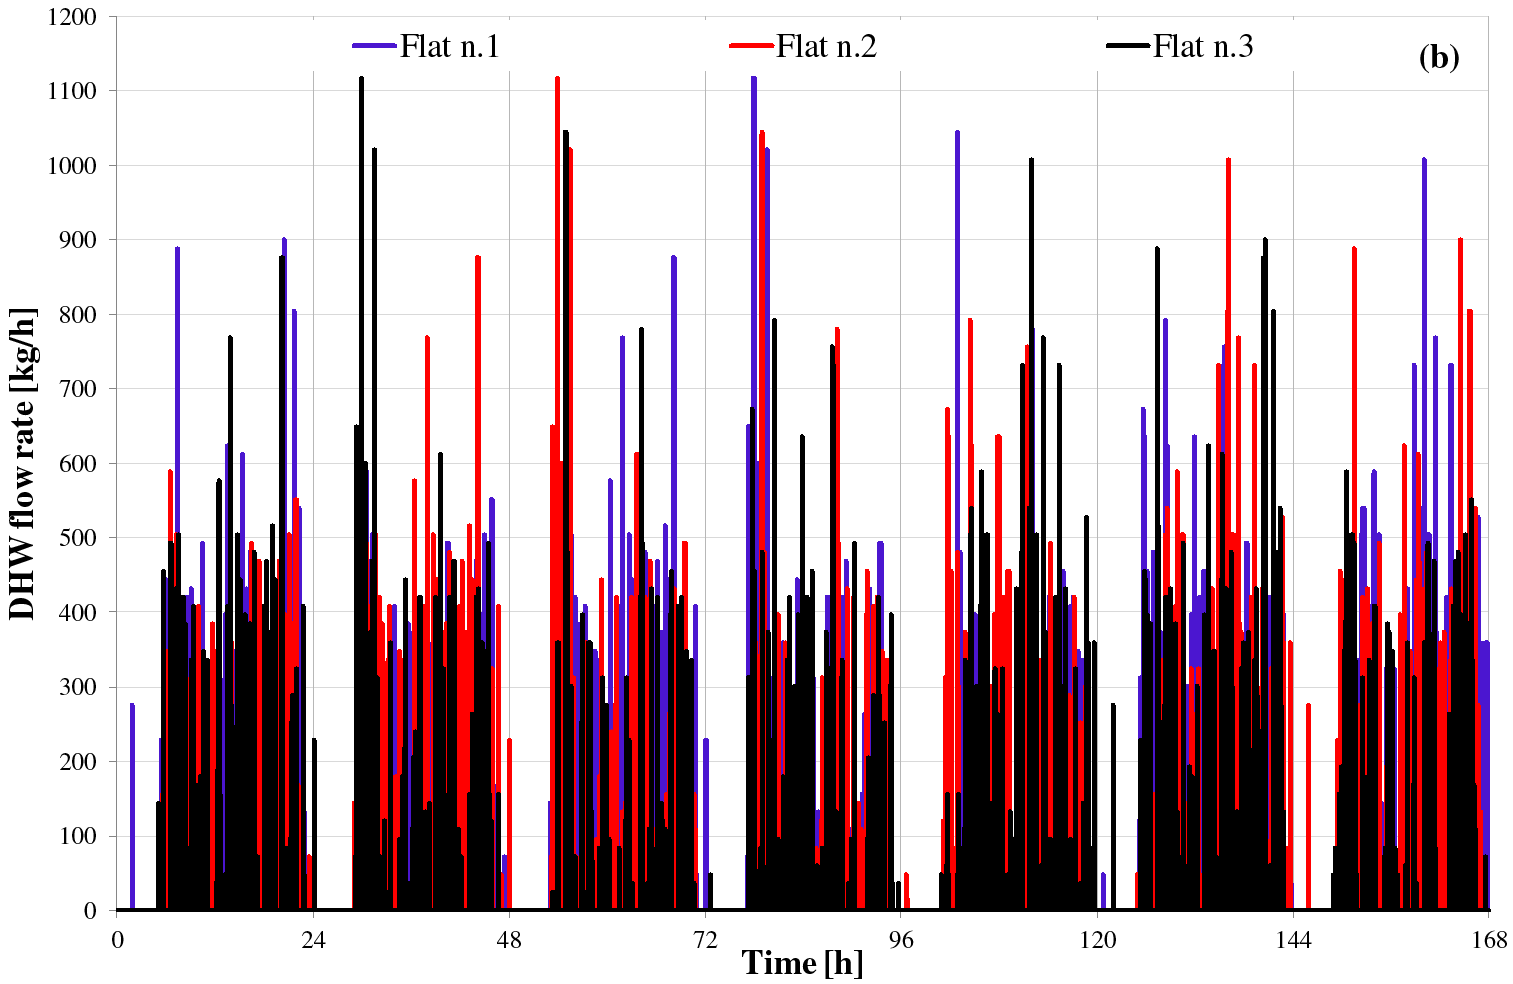
Three weekly domestic hot water demand profiles with an average basic load of 520 l/day each and different initial random values are used to estimate the DHW demand of each single flat during the whole year; the flow rates corresponding to the three weekly profiles were determined according to the values specified by the IEA-SHC Task 26 [38], [39] and reported in Figure 2b.
Weekly profiles of DHW flow rates
Both the heating coil model (“Type 753”) and the cooling coil model (“Type 508”) use a by-pass fraction approach. The blower of fan coils is modelled as a two-speed one (“Type 644”), which is able to spin at one of two speeds (high and low), thereby maintaining one of two constant mass flow rates of air. When there is a call for heating/cooling from the building, the blower is on a high speed; otherwise the blower is on a low speed to circulate air through the building.
The residential house and related loads are simulated using the interface “TRNBuild” of TRNSYS and its “Type 56”; a single interior zone was assumed in the simulations for each flat.
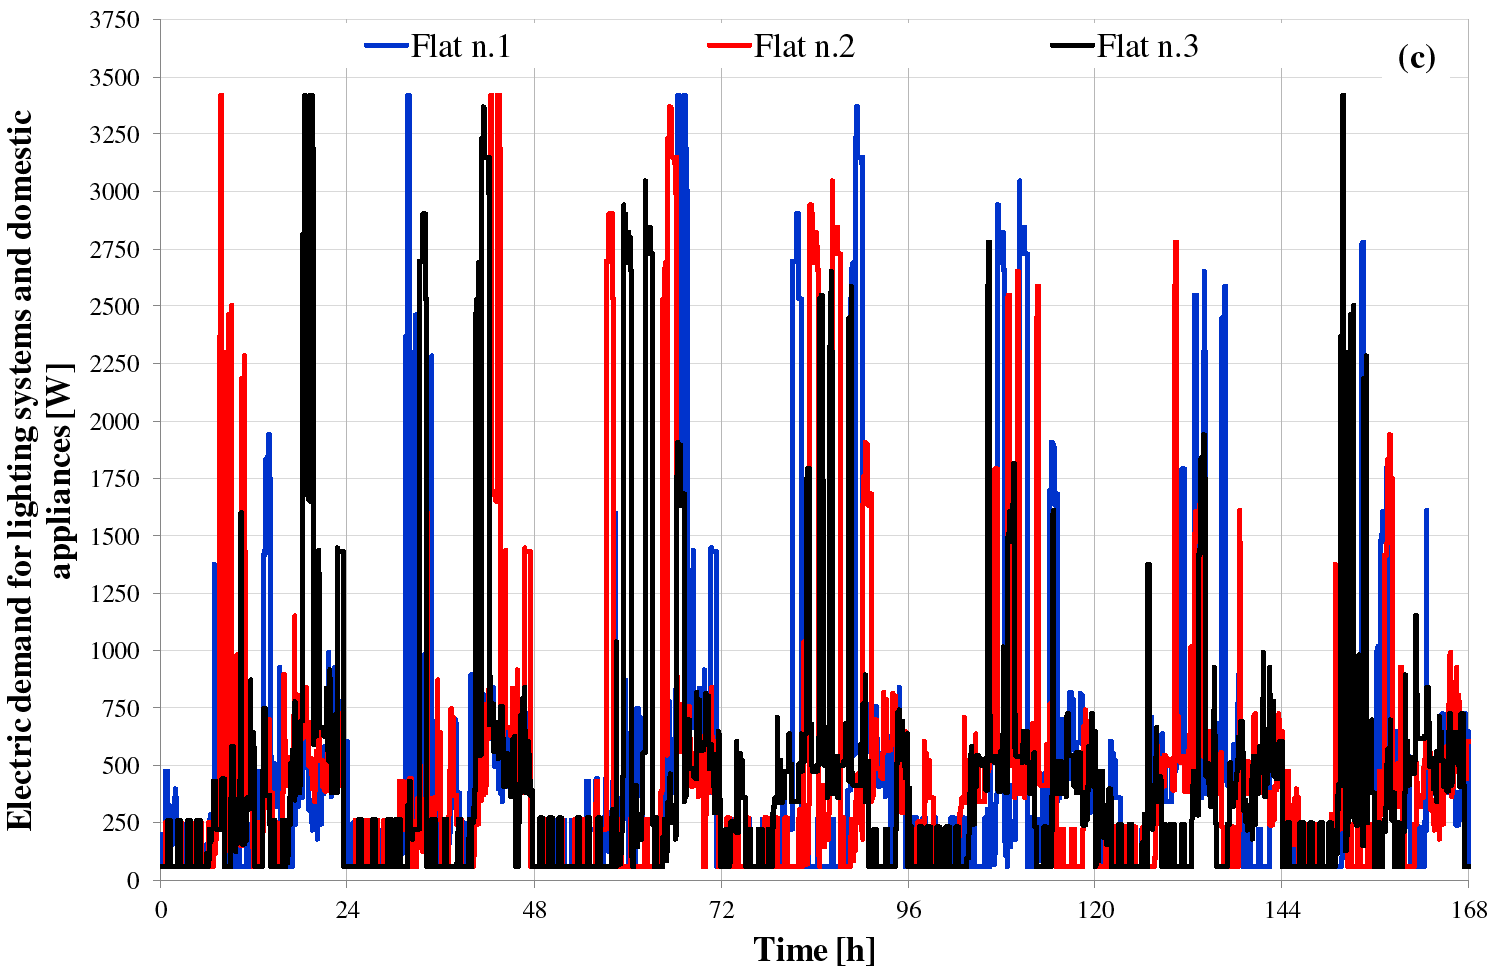
A weekly non-HVAC electric demand profile resulting from the operation of both lighting systems and domestic electric appliances is assumed for each single flat based on the reference values suggested in [40]. The curves associated with each flat are reported in Figure 2c; they correspond to weekly electric energy consumption equal to 0.779 kWh/m2 for all three flats.
Weekly profiles of electric demand for lighting and domestic appliances
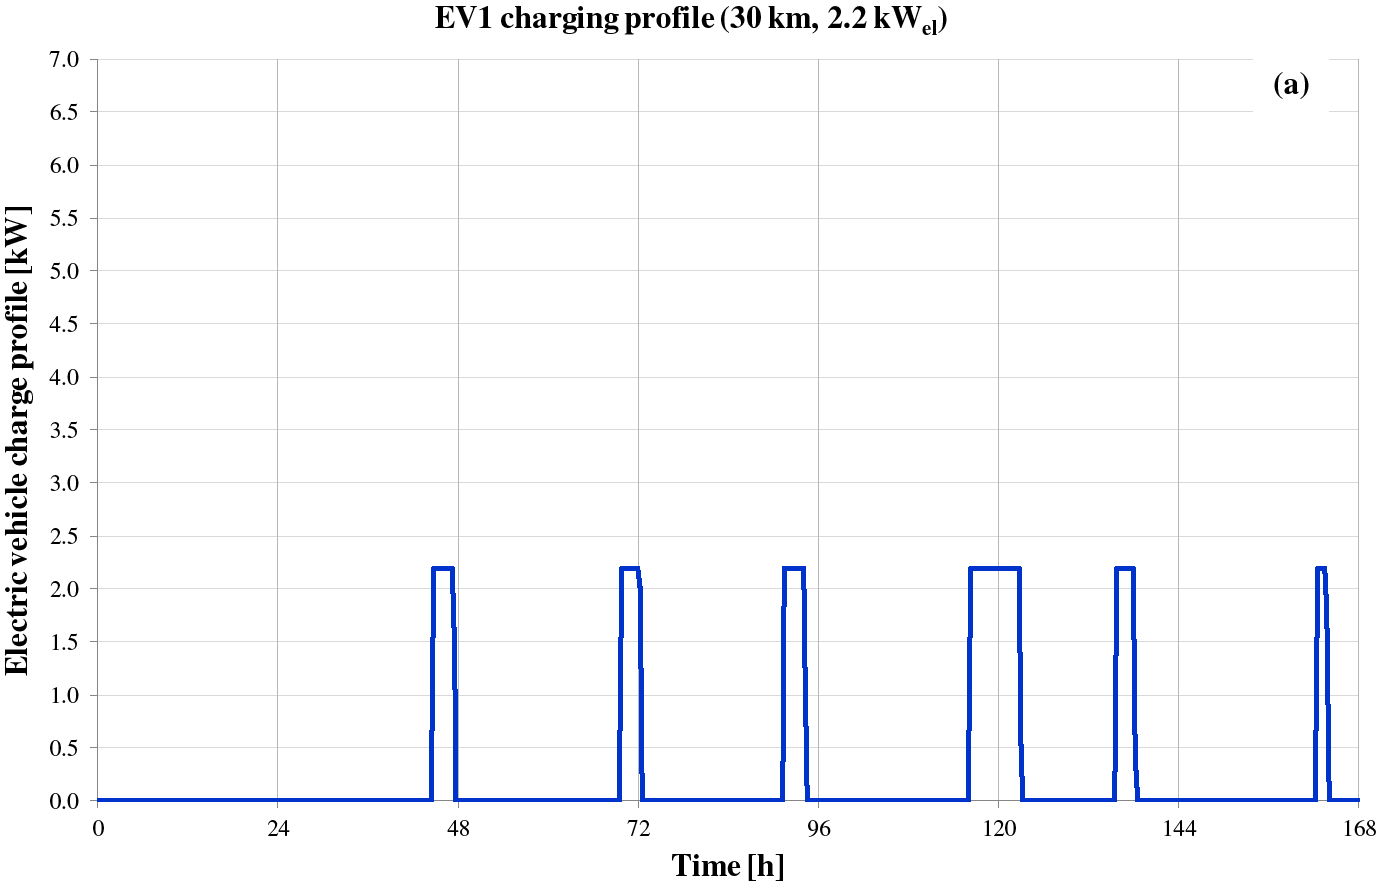
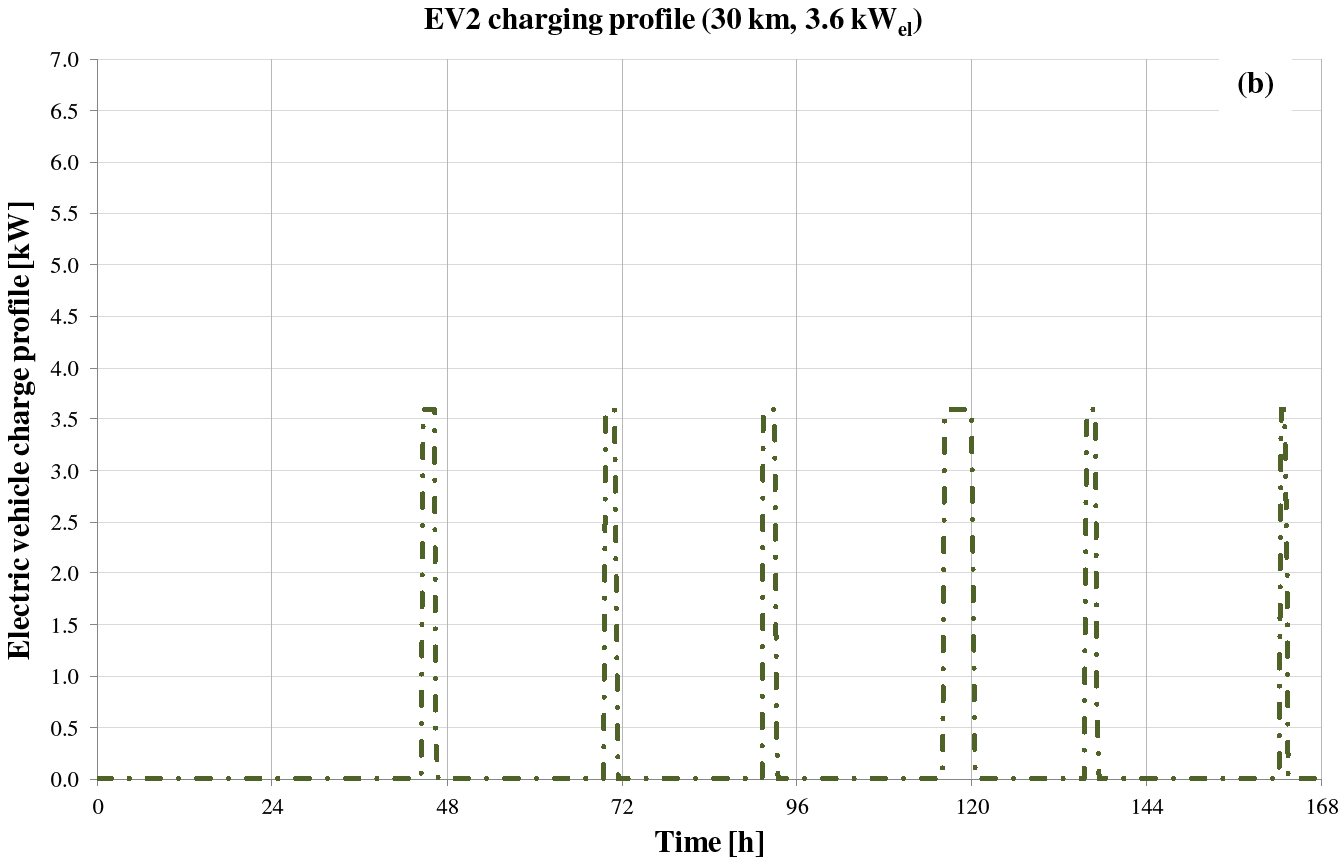
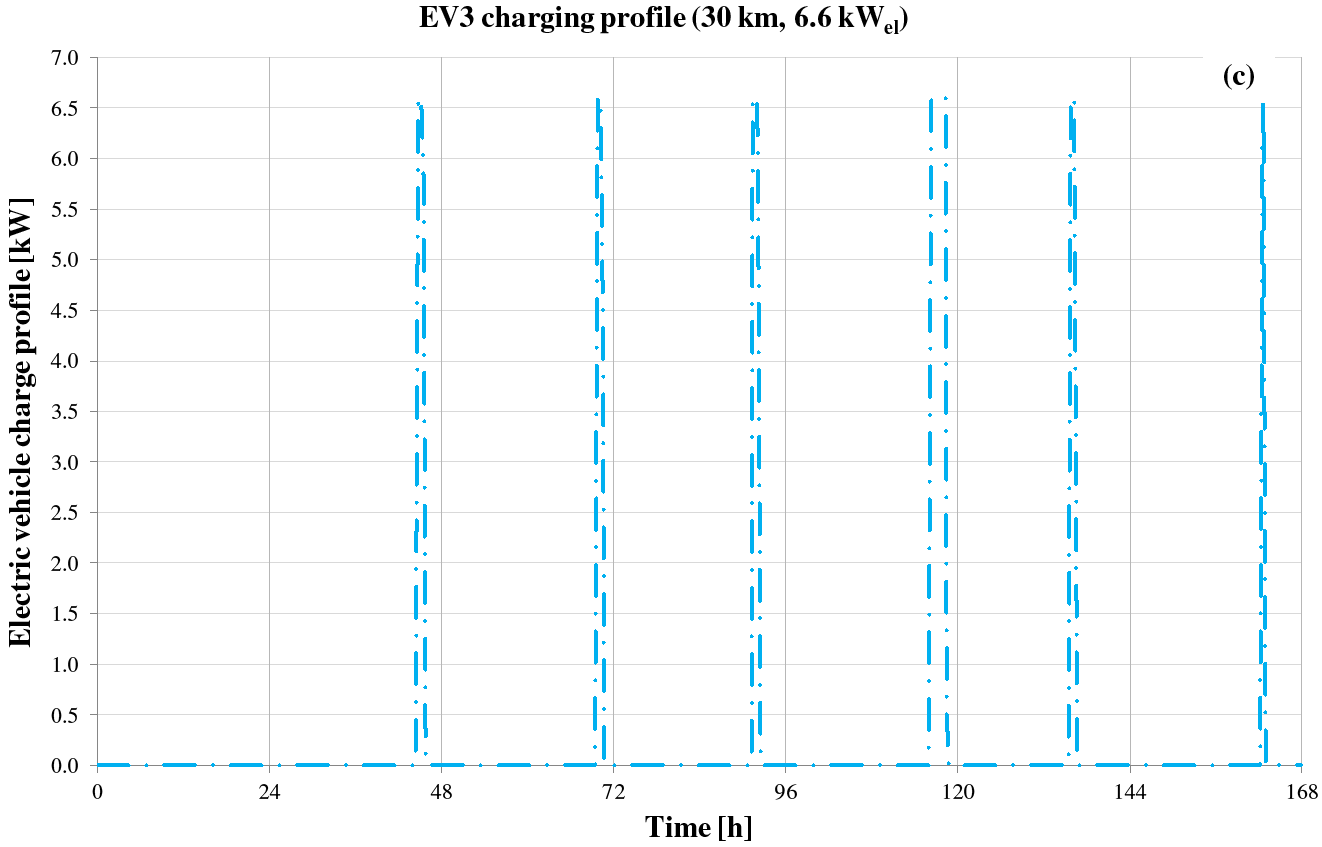
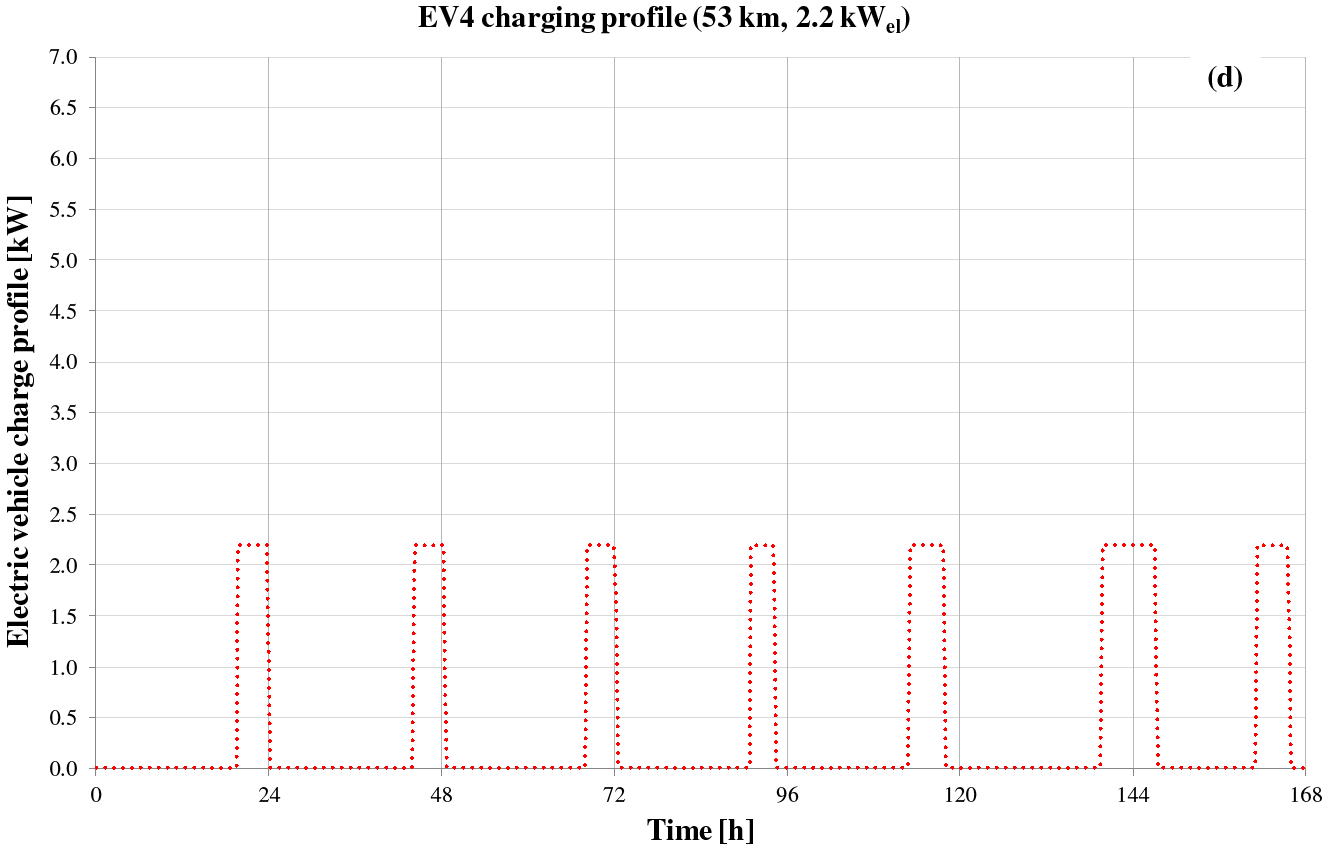
Natural Resources Canada has developed a Plug-in Electric Vehicle and Charge Impact Model (PEV-CIM). PEV-CIM is a versatile software tool that can be used to determine the impact of electric vehicle charging on the future electricity grid, on fuel costs, and on emissions. The tool is freely available from the NRCan website [41]. PEV-CIM is used to create a set of seven EV charging profiles (named EV1, EV2, …, EV7) representing scenarios based upon actual driving data in which electric vehicles would drive three different daily distances (30 km, 53 km and 75 km) and would be charged at three different power levels (2.2 kWel, 3.6 kWel and 6.6 kWel). There is only one charge level (6.6 kW) for the 75 km/day case since lower charge levels would result in unacceptably long charging times on some days of the week. The EV charging profiles investigated in this study are reported in Figure 3.
Electric vehicle charge profiles investigated in this study: EV1
Electric vehicle charge profiles investigated in this study: EV2
Electric vehicle charge profiles investigated in this study: EV3
Electric vehicle charge profiles investigated in this study: EV4
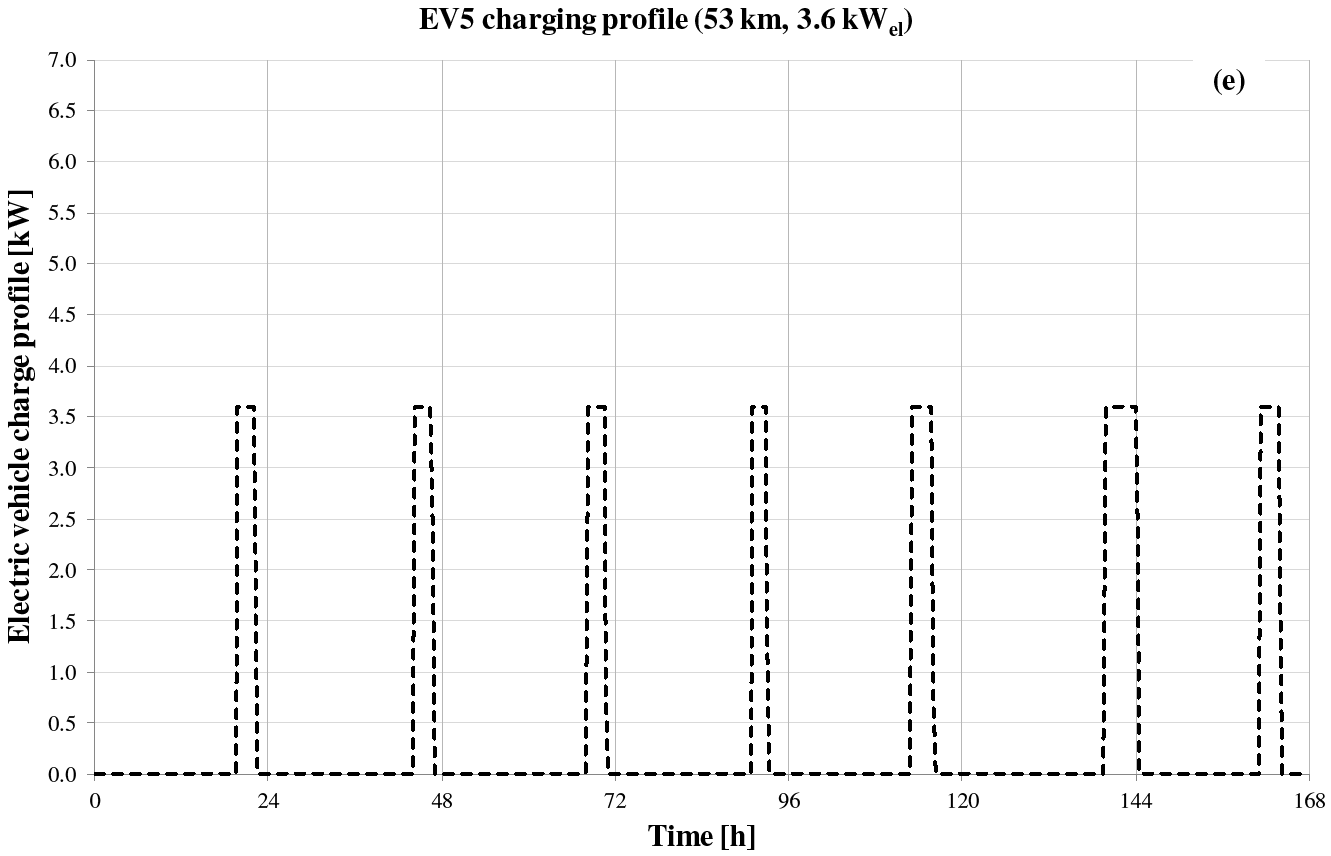
Electric vehicle charge profiles investigated in this study: EV5
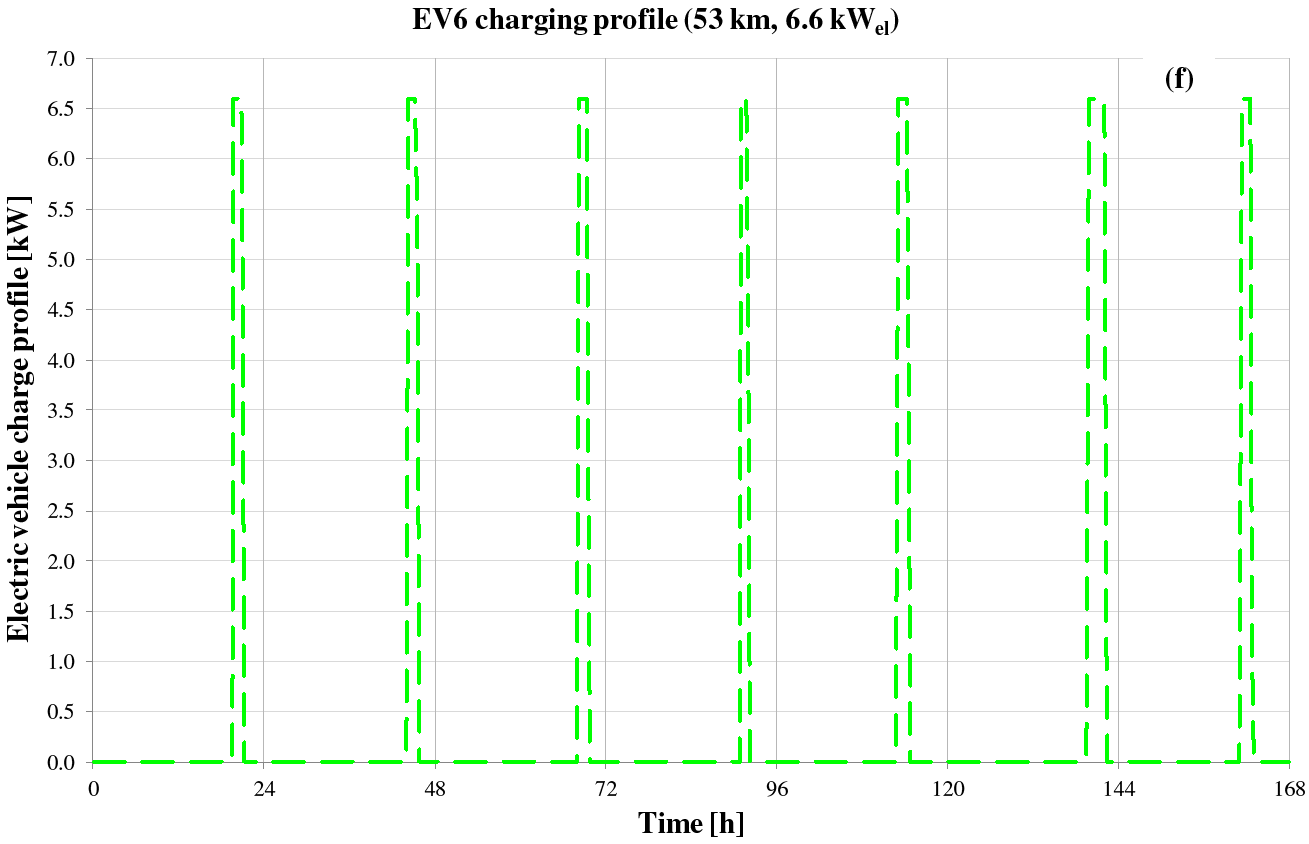
Electric vehicle charge profiles investigated in this study: EV6
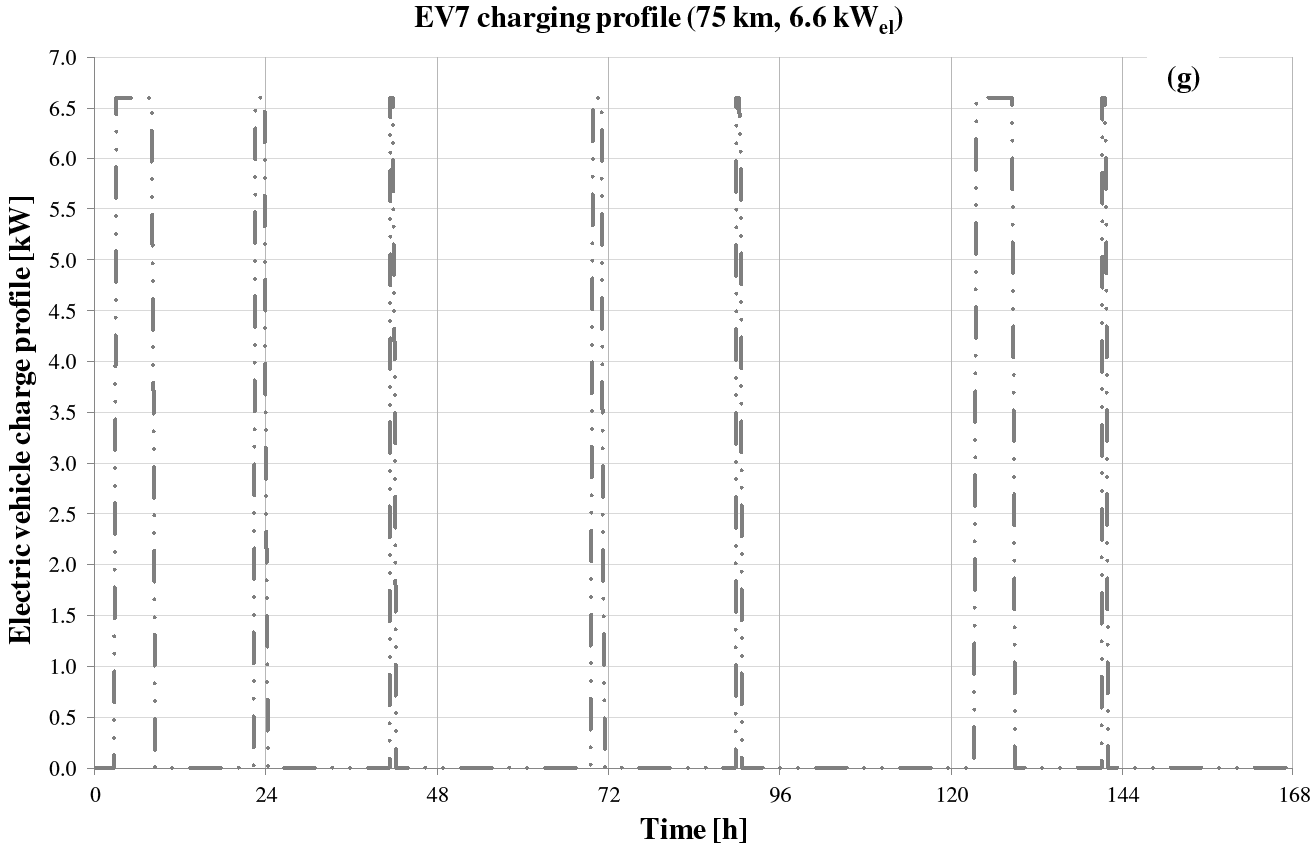
Electric vehicle charge profiles investigated in this study: EV7
The ratio between the DC power usage of the EV divided by the AC power consumption of the charging station is assumed equal to 83.3% for all charging levels.
Hot and cold water storage tanks are modelled as vertical with immersed coiled tube heat exchangers (“Type 534”). The MCHP unit is connected to the immersed IHE1 (located in the lower part of the HWT), while the hot water coming from the boiler goes towards the internal heat exchanger located in the upper part of the tank IHE2; domestic hot water is produced during the whole year by means of the internal heat exchanger IHE3. For the cold water storage tank, the immersed heat exchanger is assumed to be located near the top. Both tanks have a volume of 0.189 m3 and are modelled with 10 isothermal temperature layers to better represent the stratification in the tank, where the top layer is 1 and the bottom layer is 10. The capital cost of the storage tanks is around 400 EUR/each.
A micro-cogenerator commercialized by the AISIN SEIKI company [42] is investigated. Its main characteristics are reported in Table 1.
Main characteristics of the MCHP unit based on manufacturer data [42]
| Model | GECC60A2 (NR-P) |
|---|---|
| Engine type | Reciprocating internal combustion engine, water cooled, 4 cycles, 3 cylinders |
| Displacement [cm3] | 952 |
| Speed revolution [rpm] | 1,600 ÷ 1,800 |
| Fuel | Natural gas |
| Nominal electric output [kW] | 0.3 ÷ 6 |
| Nominalthermal output [kW] | 11.7 |
| Electric efficiency at maximum load [%] | 28.8 |
| Thermal efficiency at maximum load [%] | 56.2 |
A dynamic simulation model of the MCHP unit (“Type 154”) has been developed by the authors [43] thanks to several experiments performed under different operating conditions. In this paper, the MCHP device operates under a heat-led control logic being turned on in case of the temperature at the node 2 of the hot water storage falling below 50 °C until the temperature at the node 5 of the HWT becomes equal to 55 °C. The capital cost of the MCHP unit is around EUR 18,000 [42].
The air-cooled water chiller is the model MRA/K 15 commercialized by the company CLINT [44]. The unit has a nominal cooling capacity of 4.5 kW, with a nominal power of the compressor equal to 1.5 kW; it is equipped with a single rotary compressor and uses R410A as a refrigerant. The refrigerant flowing into the ACWC thermally interacts with water at the evaporator side, and it condenses by means of an air flow at the condenser side. The air-cooled water chiller is simulated by using a model that relies upon catalogue data readily available from the manufacturer [44]. The system is operated according to both the water temperature T9,CWT in the layer 9 of the cooling water tank and the water temperature T2,CWT in the layer 2 of the cooling water tank. In particular, the ACWC device is turned off if T9,CWT falls below 9 °C and is then turned on when T2,CWT becomes equal to its set-point (12 °C). The ACWC unit was simulated by using Type 655 available in TRNSYS 17 library. The capital cost of the air-cooled water chiller is around EUR 1,728 [45].
A 20 kWth natural gas-fired auxiliary heater is used. It is controlled depending on the water temperatures T2,HWT and T5,HWT. In particular, the boiler is turned on if T2,HWT falls below 45 °C and then turned off when T5,HWT is equal to 50 °C. Its efficiency is calculated according to the data provided by the manufacturer [45] as a function of its thermal output. The capital cost of the boiler is around EUR 1,700 [45].
The main focus of this study is to compare the performance of the PS based on a micro-cogeneration device with those of a CS based on separate energy production. In the following, a conventional system composed of a natural gas-fired boiler (for thermal energy production), an electric air-cooled vapor compression water chiller for cooling purposes [44] (the same ACWCs used in the proposed system) and a power plant connected to the electric grid (for electricity production) is considered. A 34.0 kWth boiler [45] is selected for the thermal energy production in the conventional system with a boiler efficiency evaluated according to the manufacturer’s data [45]. Concerning the efficiency of the power plant connected to the national electric grid ηPP, a figure of 0.461 was assumed; this value represents the power plant average efficiency in Italy, including transmission losses [46].
The performances of the proposed micro-trigeneration plant are compared with those associated to a traditional scheme based on separate energy production. A simplified comparison was performed by considering the same thermal, cooling and electric energy outputs for both systems.
The comparison in terms of primary energy consumption was carried out by using the following parameter named Primary Energy Saving (PES):
where and are, respectively, the primary energy consumed by the micro-trigeneration and the traditional systems.
The values of and were calculated as follows:
where , and are, respectively, the primary energy consumption, the heat recovery and the electric output of the MCHP unit, is the thermal output of the boiler of the proposed plant, is the electricity purchased from the grid by the proposed system, and represent, respectively, the efficiency of the boiler associated with the proposed and conventional system according to the manufacturer’s data [45], ηPP is the average efficiency of power plants in Italy, it is considered equal to 0.461 (transmission losses included) according to [46].
The comparison in terms of environmental impact was carried out by assuming a simplified approach neglecting the local pollution effects while considering only the global carbon dioxide equivalent emissions:
The terms and , represent, respectively, the emissions associated with the proposed and reference systems.
An energy output-based emission factor approach was used for the calculation of the carbon dioxide equivalent emissions [47]. In this study, the CO2 emission factor for natural gas β was considered equal to 207 g CO2/kWhp, while the CO2 emissions corresponding to the electricity production were characterized by taking into account an emission factor α equal to 573 g CO2/kWhel. The values assumed in the present study are based on [48] according to the Italian context.
The CO2 emissions of the proposed and conventional systems ( and , respectively) are calculated as follows:
Finally, the economic feasibility of the proposed system was evaluated by comparing its operating costs with those associated with the conventional system using the following formula:
The operating costs due to both natural gas and electric energy consumption were evaluated in detail according to the Italian scenario [46], [49] also taking into account the revenue from selling the electric energy surplus:
whereUCng,MCHP is the unit cost of natural gas for cogenerative use, UCng,B is the unit cost of natural gas for the boiler, LHVng is the lower heating value of natural gas (assumed equal to 49,599 kJ/kg) [50], ρng is the density of natural gas (assumed equal to 0.72 kg/m3), UCel,buy and UCel,sell are, respectively, the unit cost of the electric energy purchased and sold, is the electric energy sold to the central grid by the proposed system.
Table 2 reports the unit cost of natural gas for both cogenerative use and for applications other than cogeneration upon varying of the level of cumulative natural gas usage related to the Italian region that includes the city of Naples. This table highlights that the excise tax is lower for cogenerative use with respect to different applications.
Unit cost of natural gas for cogenerative use and other applications as a function of the level of cumulative natural gas consumption for Naples [46]
| Cumulative natural gas consumption [Nm3/year] | ||||||
|---|---|---|---|---|---|---|
| from 0 to 120 | from 121 to 480 | from 481 to 1,560 | from 1,561 to 5,000 | from 5,001 to 80,000 | from 80,001 to 200,000 | |
| Variable rate [EUR/Nm3] | 0.47988 | 0.65521 | 0.62764 | 0.62324 | 0.58612 | 0.53182 |
| Regional tax [EUR/Nm3] | 0.019 | 0.031 | 0.031 | 0.031 | 0.031 | 0.031 |
| Excise tax for cogenerative use [EUR/Nm3]* | 0.012498 | |||||
| Excise tax for applications other than cogeneration [EUR/Nm3] | 0.038 | 0.135 | 0.12 | 0.15 | 0.15 | 0.15 |
| VAT [%] | 10 | 10 | 21 | 21 | 21 | 21 |
| Yearly fixed charge [EUR/year] | 91.00 | |||||
| Total use cost [EUR/cogenerative Nm3] | 0.562516 | 0.76858 | 0.81208 | 0.80675 | 0.76184 | 0.69614 |
| Total cost for applications other than cogeneration [EUR/Nm3] | 0.59057 | 0.90333 | 0.94215 | 0.97313 | 0.92822 | 0.86251 |
* Only a portion of natural gas consumption amounting to 0.22 Nm3/kWhel is liable to a tax reduction (0.0004493); on the gas amount not liable of tax reduction, the excise tax paid is 0.012498 EUR/Nm3
Regarding the operating cost of the electric energy, a simplified analysis is performed by assuming the following unit costs according to the Italian scenario:
An average unit cost equal to 0.208 EUR/kWh [46] for the electricity purchased from the grid;
An average unit cost for the electricity fed to the grid of 0.0623 EUR/kWh [49].
Both capital and maintenance costs are neglected.
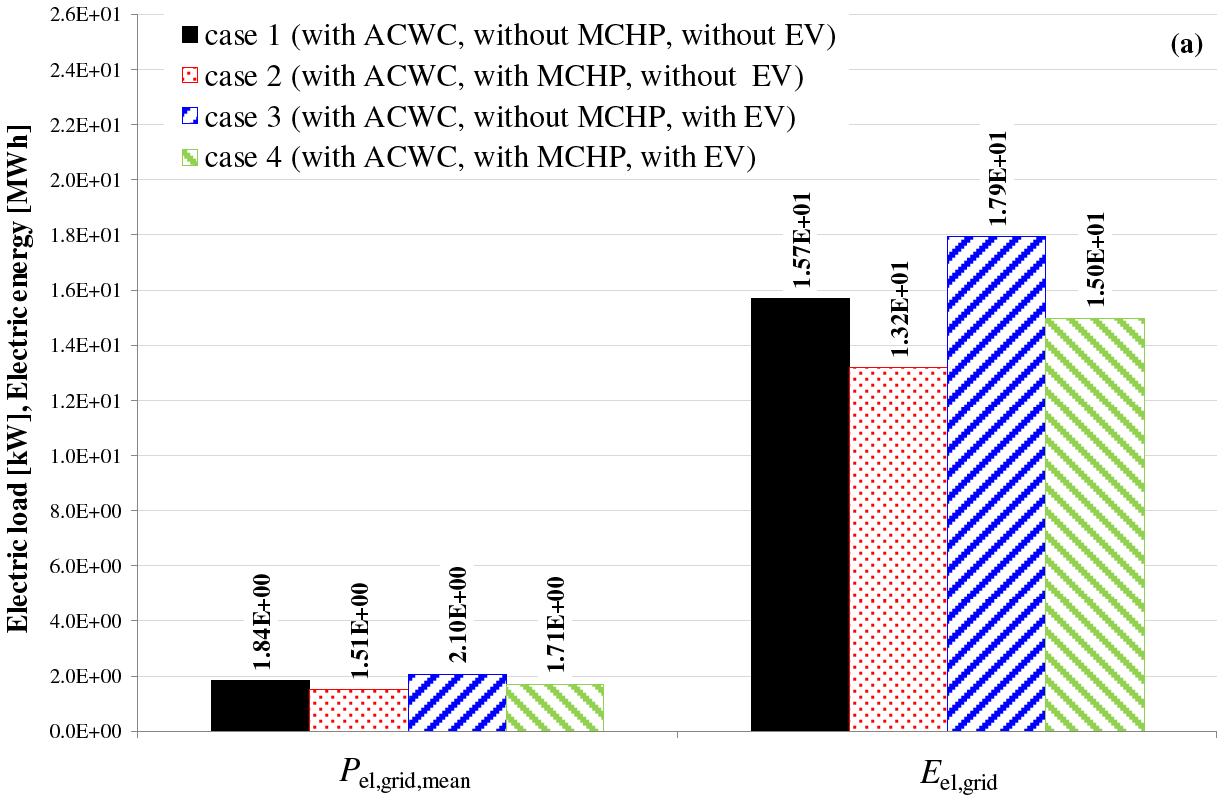
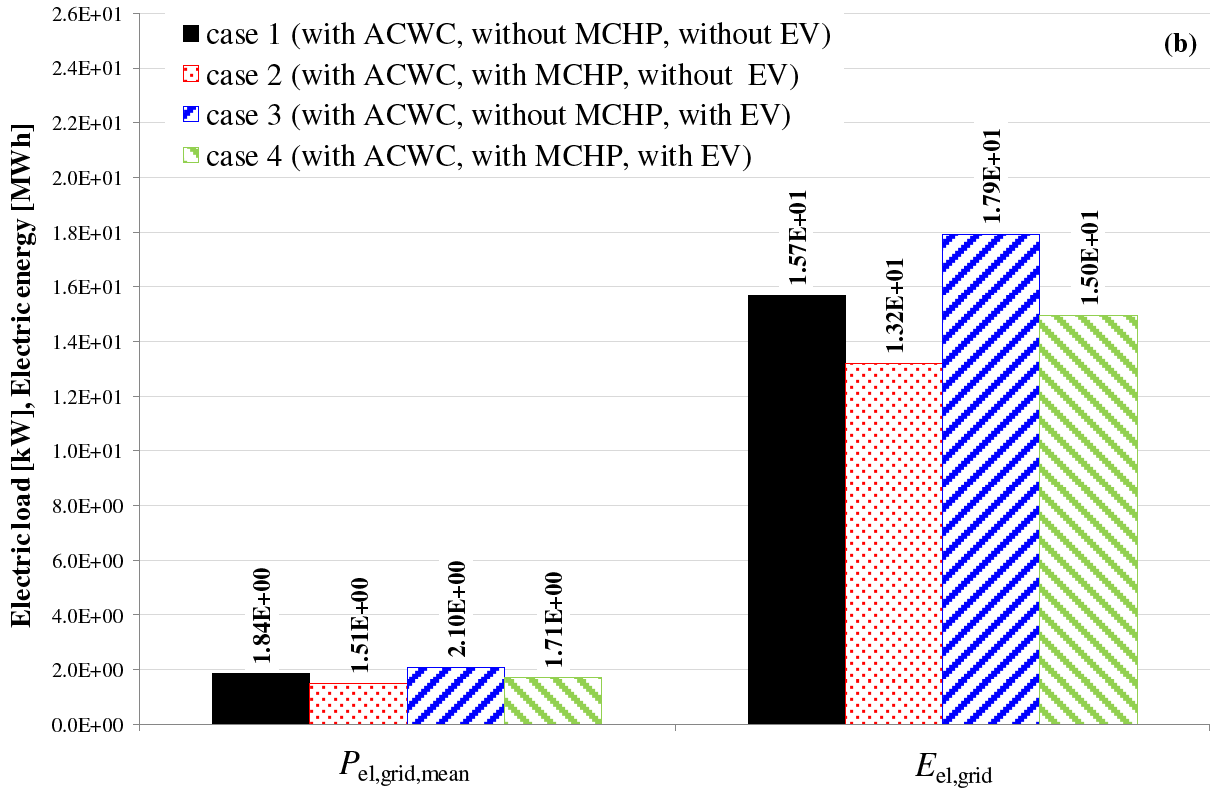
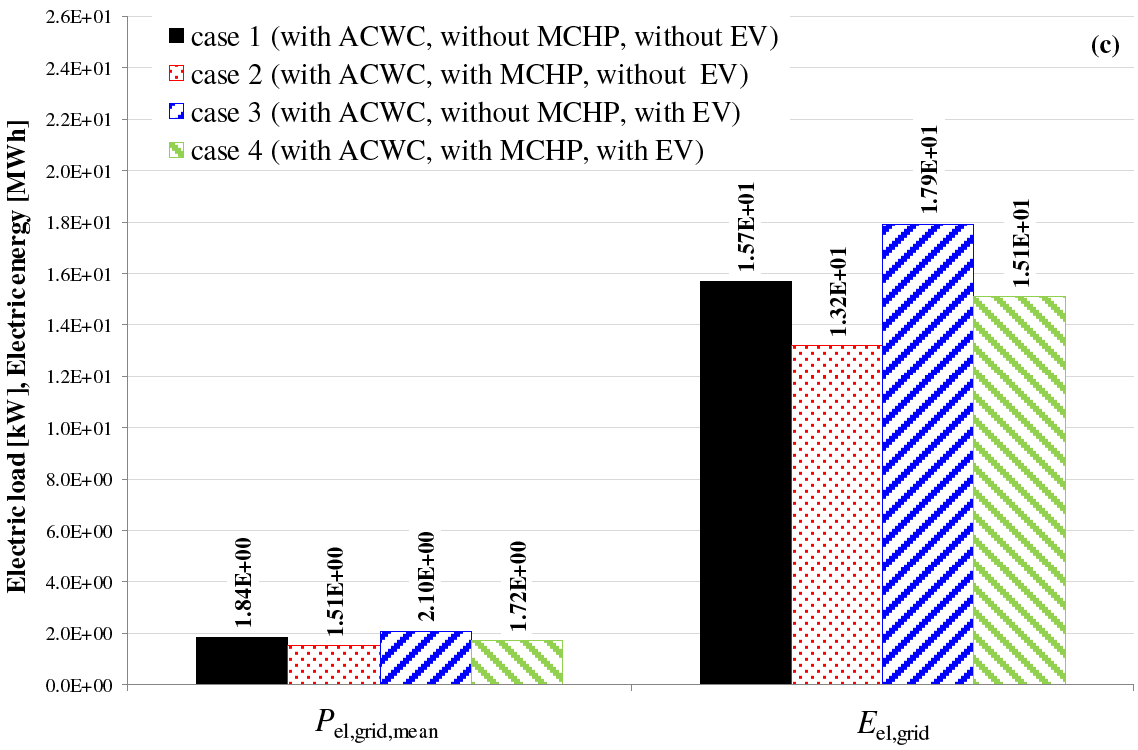
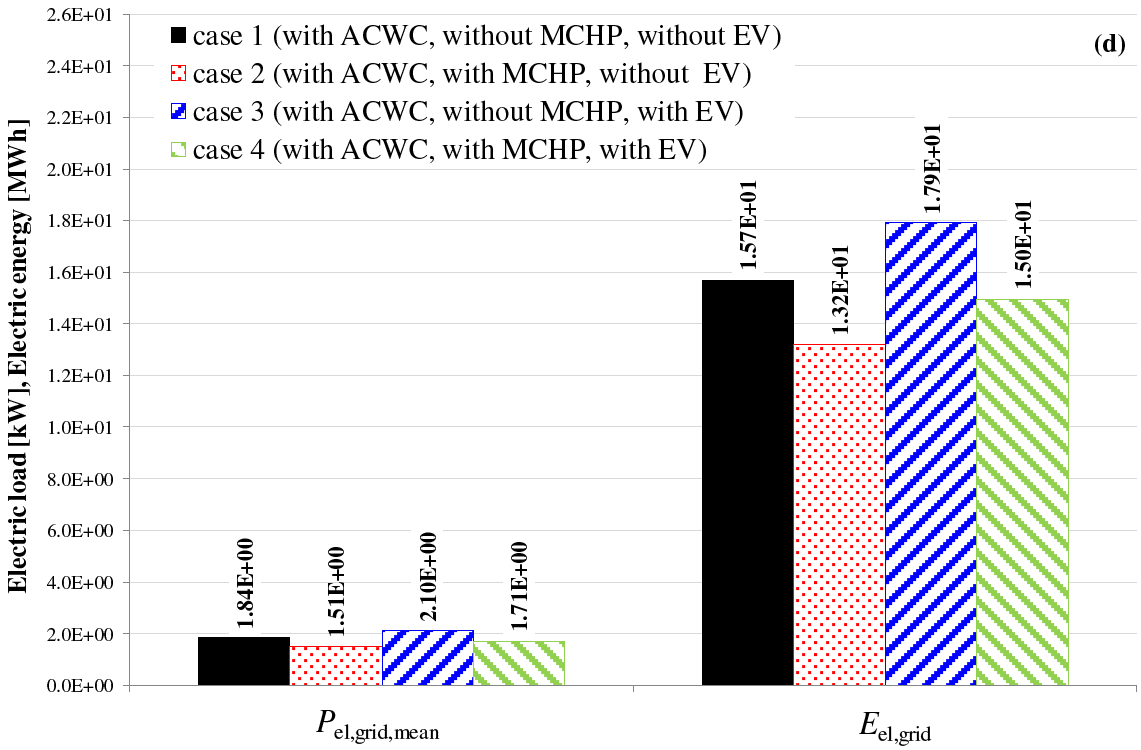
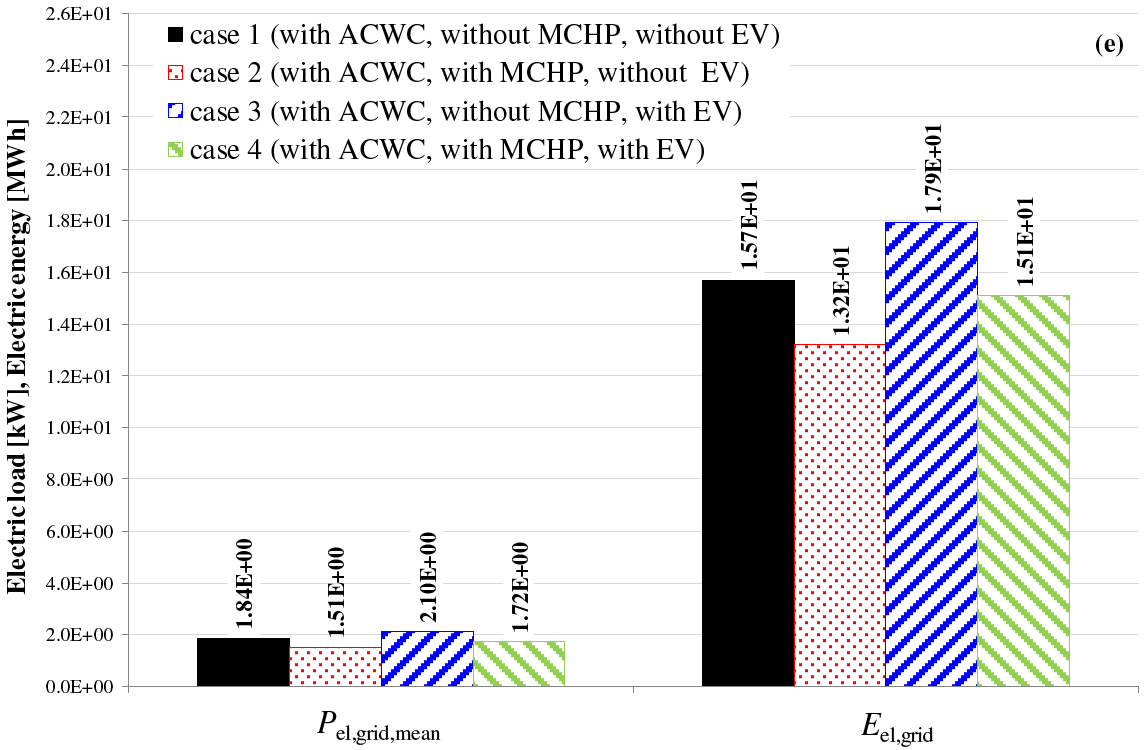
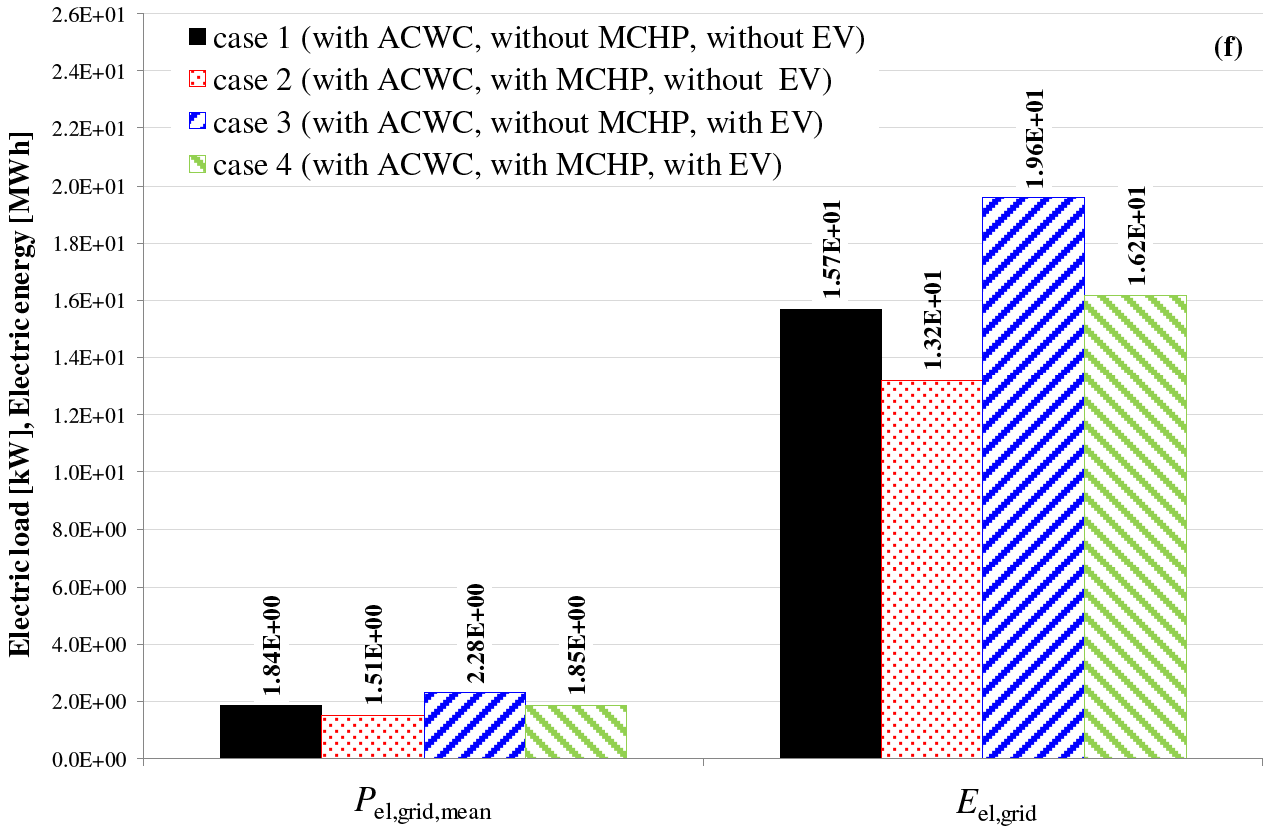
Figure 4 reports the annual average electric load for the grid Pel,grid,mean as well as the annual electric energy purchased from the power line Eel,grid associated with the whole building upon varying the EV charging profile in the following four cases:
Operation with the ACWC, but without both the MCHP unit and the EV charging;
Operation without the EV charging, but with both the ACWC and the MCHP unit;
Operation without the MCHP device, but with both the ACWC and the EV charging;
Operation with the MCHP device, the ACWC as well as the EV charging.
Figures 4a-4g are related to the EV charging profiles EV1, EV2, EV3, EV4, EV5, EV6 and EV7 respectively. These figures demonstrate that:
Using the ACWC in combination with the MCHP unit (case 2) reduces both the annual average electric power demand (−22.2%) and the annual electric energy consumption (−18.9%) when compared to case 1 where the ACWC is used without the MCHP device (EV charging is not considered in both cases 1 and 2);
Whatever the EV charging profile is, using the electric vehicle without the MCHP unit (case 3) enhances both the annual average electric power demand (from +12.1%, in the case of the EV charging profiles being EV1 or EV2 or EV3, up to +25.5%, in the case of the EV charging profile being EV7) and the annual electric energy supplied by the central grid (from +12.4%, in the case of the EV charging profile being EV1 or EV2 or EV3, up to +26.0%, in the case of the EV charging profile being EV7) when compared to the case 1 where only the ACWC is used;
If compared to the case where the EV is charged and the ACWC is used without the MCHP device (case 3), it is worth noting that the micro-cogeneration technology (case 4) allows to reduce both the values of Pel,grid,mean (from −20.3%, in the case of the EV charging profile being EV7, up to −23.8%, in the case of the EV charging profile being EV5) and the values of Eel,grid (from −17.9%, in the case of the EV charging profile being EV7, up to −21.1%, in the case of the EV charging profile being EV5). This means that MCHP technology can significantly reduce the impact on the electric grid associated with a widespread use of EVs as well as ACWCs.
Average electric power load on the central grid Pel,grid,mean and annual electric energy purchased from the power line Eel,grid upon varying the EV charging profile: EV charging profile EV1
Average electric power load on the central grid Pel,grid,mean and annual electric energy purchased from the power line Eel,grid upon varying the EV charging profile: EV charging profile EV2
Average electric power load on the central grid Pel,grid,mean and annual electric energy purchased from the power line Eel,grid upon varying the EV charging profile: EV charging profile EV3
Average electric power load on the central grid Pel,grid,mean and annual electric energy purchased from the power line Eel,grid upon varying the EV charging profile: EV charging profile EV4
Average electric power load on the central grid Pel,grid,mean and annual electric energy purchased from the power line Eel,grid upon varying the EV charging profile: EV charging profile EV5
Average electric power load on the central grid Pel,grid,mean and annual electric energy purchased from the power line Eel,grid upon varying the EV charging profile: EV charging profile EV6
Average electric power load on the central grid Pel,grid,mean and annual electric energy purchased from the power line Eel,grid upon varying the EV charging profile: EV charging profile EV7

Figure 5a highlights the annual values of the electric energy consumed by the lighting systems, domestic electric appliances and auxiliaries (vacuum cleaner, dishwasher, washing machine, PC, TVs, fridge, lighting systems, pumps, fans, etc.). Eel,bui&aux, the electric energy consumed by the ACWC Eel,ACWC, the electric energy consumption associated with the seven EV charging profiles under investigation Eel,EV1, Eel,EV2, Eel,EV3, Eel,EV4, Eel,EV5, Eel,EV6 and Eel,EV7, the thermal output of the MCHP unit Eth,MCHP, the electric energy produced by the MCHP device Eel,MCHP, the thermal energy supplied by the boiler Eth,B, and the cooling energy from the ACWC Ecool,ACWC. This figure indicates that:
The thermal energy production is around 2.74 times greater than that for space cooling;
The MCHP device provides 81% of the total heat load for space heating and DHW, while the remainder is supplied by the backup burner;
The charging profiles EV1, EV2 and EV3 consume around 2,200 kWh (15% of Eel,bui&aux), the profiles EV4, EV5 and EV6 consume around 3,850 kWh (27% of Eel,bui&aux), while the EV7 charging demand accounts for about 5,520 kWh (39% of Eel,bui&aux);
The electric energy consumed by the ACWC is around 17% of the consumption associated to the lighting systems, domestic appliances and auxiliaries;
The micro-cogeneration unit produces around 10,600 kWh of electricity that is available to cover the overall electric demand.
Thermal, electric and cooling energy flows of the proposed micro-trigeneration system
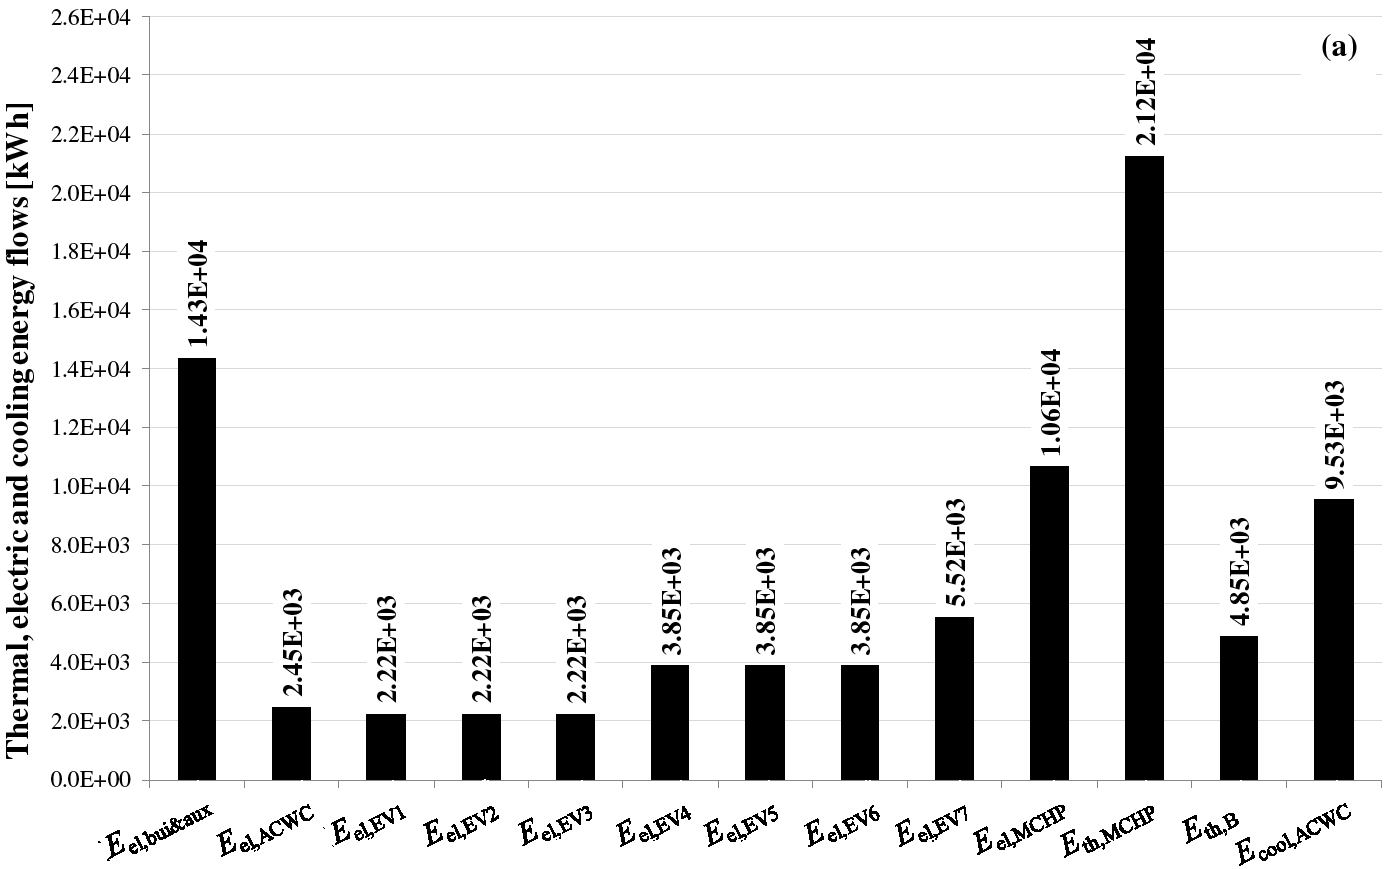
Figure 5b reports the annual values of the electric energy produced by the MCHP unit and sold to the electric grid upon varying the EV charging profiles (Eel,sold,EV1, Eel,sold,EV2, …, Eel,sold,EV7), considering also the case without the EV charging (Eel,sold,withoutEV). The values reported in this figure highlight that about 66% of the electric energy produced by the MCHP unit is sold to the electric grid without the EV charging.
Electric energy sold to the electric grid
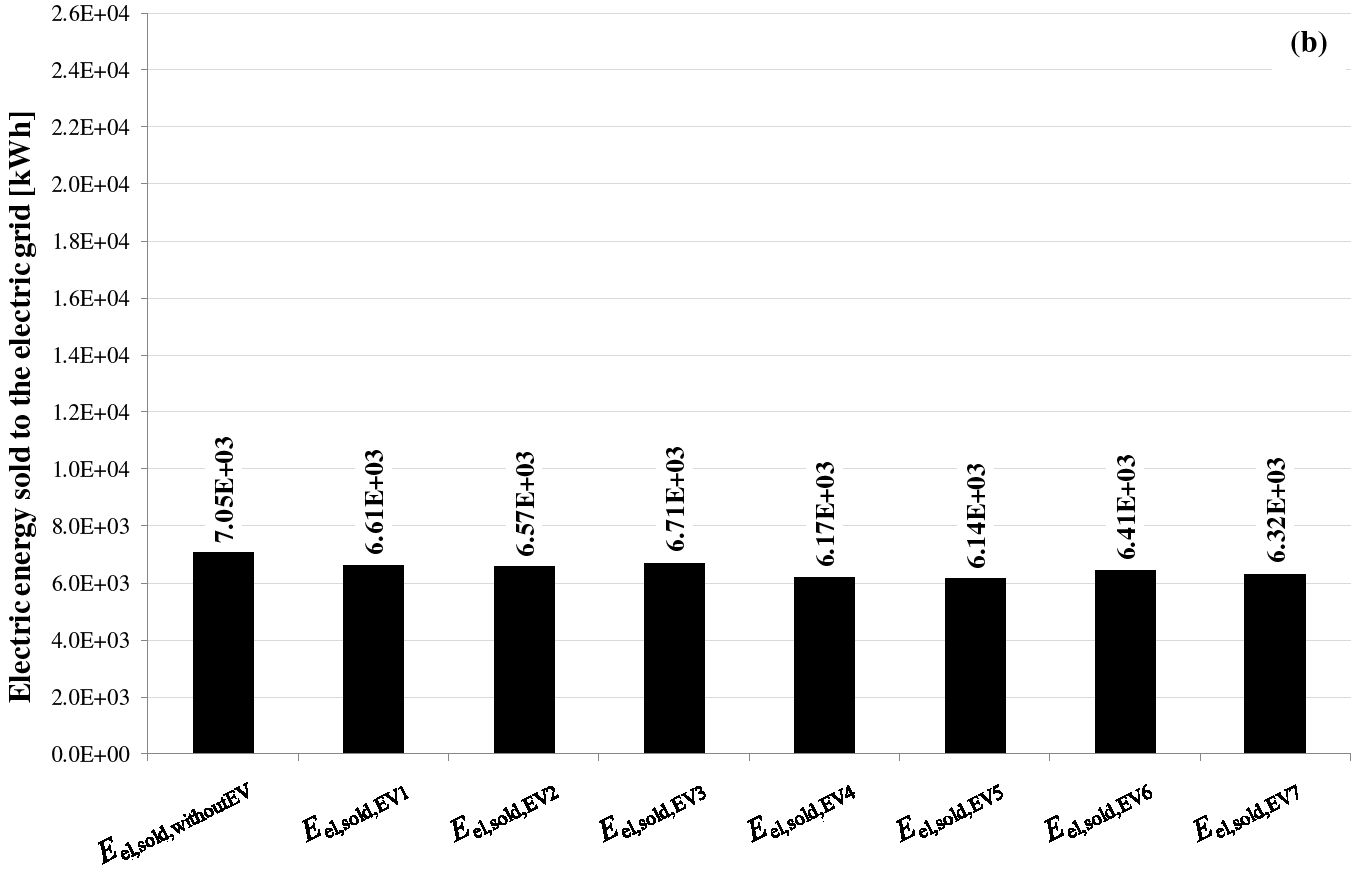
The electricity sold to the electric grid represents more than 55% of the electric energy supplied by the MCHP device, regardless of the EV charging profile used. This percentage is calculated as the ratio between the electric energy sold to the electric grid upon varying the EV charging profiles (Eel,sold,EV1, Eel,sold,EV2, …, Eel,sold,EV7 reported in Figure 5b) and the electric energy produced by the MCHP device Eel,MCHP (indicated in Figure 5a).
The EV charging only takes a small percentage [ranging from 3.2% (in the case of EV3) to 8.6% (in the case of EV5)] of the MCHP power production. These percentages are obtained as the difference between the electric energy sold to the electric grid without the EV charging (Eel,sold,withoutEV reported in Figure 5b) and the electric energy sold to the electric grid in the cases with the EV charging (Eel,sold,EV1, Eel,sold,EV2, …, Eel,sold,EV7 indicated in Figure 5b). This result underlines that the fraction of exported power is also significant in the cases with EV charging and, therefore, the potential benefits associated with the combination of MCHP with EV charging are not fully exploited due to timing issues (EV recharging at times without MCHP power production) or power mismatch issues (EV recharging at high charge power can use less of the MCHP power production).
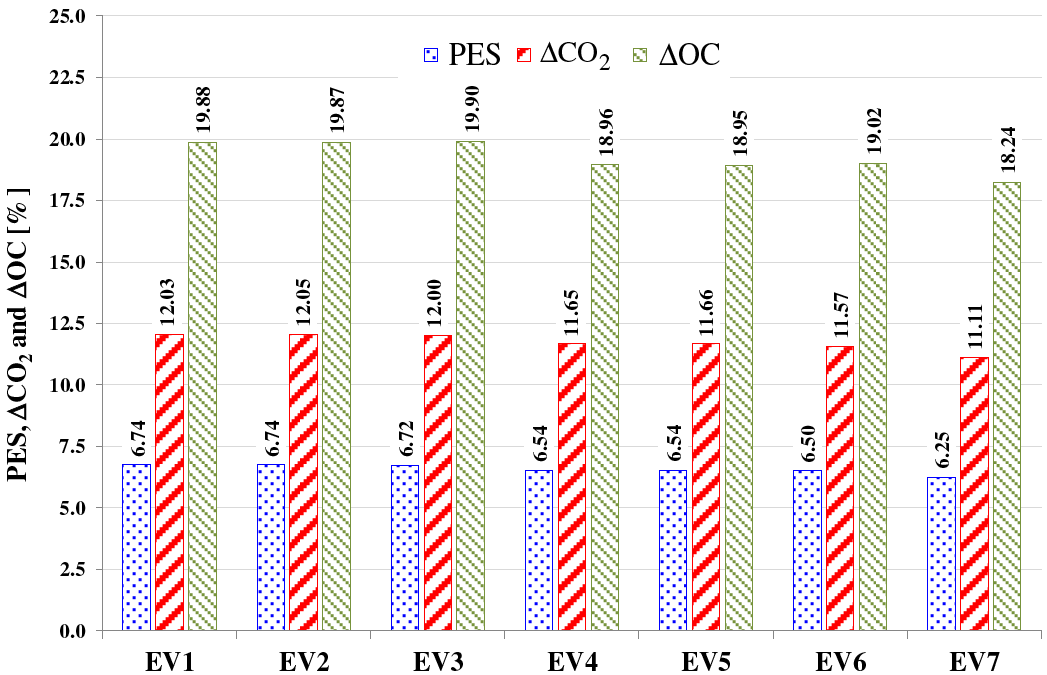
Figure 6 highlights the values of PES [eq. (1)], ΔCO2 [eq. (4)] and ΔOC [eq. (7)] upon varying the EV charging profile. The figure indicates how:
Whatever the EV charging profile is, the proposed system allows for a reduction of the annual primary energy consumption in comparison to the conventional system with a percentage difference ranging from 6.25% (with EV7) to 6.74% (with both EV1 and EV2);
Whatever the EV charging profile is, the proposed system reduces the carbon dioxide equivalent emissions in the range from 11.11% (with EV7) to 12.05% (with EV2);
Whatever the electric demand profile is, the values of ΔOC are always positive and range from 18.24% (with EV7) to 19.90% (with EV3); the values of ΔOC are larger than the values of PES and ΔCO2 mainly due to the revenues associated with the electricity sold to the central grid;
The reduction in terms of primary energy consumption, equivalent carbon dioxide emissions and operating costs is due to the relevant amount of electricity co-generated by the MCHP unit that allows to reduce the total amount of electric energy supplied by the central grid as well as the significant heat load covered by the thermal energy co-generated by the MCHP unit that allows to minimize the thermal energy supplied by the boiler;
The performance associated with the charging profiles EV1, EV2 and EV3 (characterized by a driving distance equal to 30 km) are better than those related to the other charging profiles in terms of PES, ΔCO2 and ΔOC, even if no significant differences have been highlighted among the seven charging profiles under investigation.
Values of PES, ΔCO2 and ΔOC upon varying the EV charging profile
This suggests that the current scenarios are only able to realize a small fraction of the total potential benefit between MCHP and EV and the reduction of the impact on the electric grid associated with a widespread use of EVs along with the MCHP systems could be improved by optimizing the coincidence between MCHP power production and EV charging profiles.
In this paper, the yearly operation of a building-integrated micro-trigeneration system was investigated upon varying the EV charging profile. A set of seven EV charging profiles representing scenarios in which electric vehicles would drive three different daily distances (30 km, 53 km and 75 km) and would be charged at three different power levels (2.2 kWel, 3.6 kWel and 6.6 kWel) was considered.
The proposed micro-trigeneration system was simulated over the whole year by means of transient simulations in order to investigate the capability of the cogeneration technology of:
Reducing the negative effects associated with a potential widespread utilization of EVs charging/EHPs utilization;
Saving primary energy;
Reducing the carbon dioxide equivalent emissions;
Reducing the operating costs in comparison to a conventional system based on separate energy production.
The simulation results demonstrated that:
Micro-cogeneration technology is potentially able to alleviate the impact on the central electric grid associated with a widespread utilization of EVs/ACWCs by reducing both the values of the annual average electric power demand as well as the values of the annual electric energy consumption;
Whatever the EV charging profile is, the proposed system integrated with a MCHP unit allows for a reduction of the annual primary energy consumption in comparison to a conventional system based on separate energy production larger than 6%;
Whatever the EV charging profile is, the proposed system allows to reduce the carbon dioxide equivalent emissions in comparison to a conventional system with values of ΔCO2 that range between 11% and 12%;
Whatever the EV charging electric demand profile is, the cogeneration system is more convenient than the conventional system from an economic point of view, ensuring a reduction of the operating costs of more than 18%;
Further work has to be performed to improve the coincidence between MCHP power production and EV charging and, therefore, exploit the total potential benefit between MCHP and EV.
| E | energy | [kJ] |
| m | mass of a given pollutant | [kg] |
| OC | operating cost | [EUR] |
| P | power/pump | [kW] |
| PES | primary energy saving | [%] |
| T | temperature/thermostat | [-] |
| UCng | unit cost of natural gas | [EUR/Nm3] |
| UCel | unit cost of electric energy | [EUR/kWhel] |
| V | 3-way valves | [-] |
| α | CO2 emission factor for electricity production | [g CO2/kWhel] |
| β | CO2 emission factor associated to the natural gas consumption | [g CO2/kWhp] |
| Δ | difference | [-] |
| η | efficiency | [%] |
| μ | energy output-based emission factor | [g CO2/kWh] |
| CS | conventional system |
| E | energy |
| P | proposed system |
| ACWC | air-cooled water chiller |
| B | boiler |
| buy | related to the electric energy bought |
| cool | cooling |
| el | electric |
| EV | electric vehicle |
| MCHP | micro combined heat and power |
| ng | natural gas |
| p | primary |
| PP | power plant |
| sold | related to the electric energy sold |
| th | thermal |
| TOT | total |
| ACWC | Air-Cooled Water Chiller |
| D | Diverter |
| DHW | Domestic Hot Water |
| EV | Electric Vehicle |
| IHE | Internal Heat Exchanger |
| MCHP | Micro Combined Heat and Power |
- ,
Reducing Emissions from Transport , , http://ec.europa.eu/clima/policies/transport/index_en.htm [Accessed: 05-November-2015] - ,
Global and Local Emission Impact assessment of distributed Cogeneration Systems with Partial-load Models ,Applied Energy , Vol. Vol. 86 (No. 10), :2096-30062009, https://doi.org/10.1016/j.apenergy.2008.12.026, pp - ,
Influence of Climatic Conditions and Control Logic on NOx and CO Emissions of α Micro-cogeneration Unit serving an Italian Residential Building ,Applied Thermal Engineering , Vol. Vol. 71 (No. 2), :858-8712014, https://doi.org/10.1016/j.applthermaleng.2013.12.037, pp - ,
Lessons Learned ‒ The EV Project Greenhouse Gas (GHG) Avoidance and Fuel Cost Reduction ,Final Report , 2012, http://www.theevproject.com/downloads/documents/15.%20GHG%20Avoidance_V1.1.pdf [Accessed: 05-November-2015] - ,
Directive 2009/28/EC of the European Parliament and of the Council of 23 April 2009 on the Promotion of the use of Energy from Renewable Sources and Amending and Subsequently Repealing Directives 2001/77/EC and 2003/30/EC, L 140/16, Off ,J. Eur. Union , 2009 - ,
Impact assessment of Electric Vehicle charging on α LV Distribution System, Energetics (IYCE), Proceedings of the 3rd International Youth Conference , 2011 - ,
Uncoordinated charging Impacts of Electric Vehicles on Electric Distribution Grids: Normal and Fast charging Comparison ,Power and Energy Society General Meeting, IEEE , 1-72012, pp - ,
Modelling the Impact of Integrated Electric Vehicle charging and Domestic Heating Strategies on Future Energy Demands ,9th International Conference on System Simulation in Buildings , 2014 - ,
Performance assessment of Tariff-based Air Source Heat Pump Load shifting in α UK Detached Dwelling featuring Phase Change-enhanced buffering ,Applied Thermal Engineering , Vol. Vol. 71 (No. 2), :809-8202014, https://doi.org/10.1016/j.applthermaleng.2013.12.019, pp - ,
Plug-in Electric Vehicles in Electric Distribution Networks: A Review of Smart Charging Approaches ,Renewable & Sustainable Energy Reviews , Vol. Vol. 38 , :717-7312014, https://doi.org/10.1016/j.rser.2014.07.040, pp - ,
The Technical, Economic and Commercial Viability of the Vehicle-to-grid Concept ,Energy Policy , Vol. Vol. 48 , :394-4062012, https://doi.org/10.1016/j.enpol.2012.05.042, pp - ,
A New Model based on Optimal Scheduling of Combined Energy Exchange Modes for Aggregation of Electric Vehicles in α Residential Complex ,Energy , Vol. Vol. 69 , :186-1982014, https://doi.org/10.1016/j.energy.2014.02.063, pp - ,
Directive 2004/8/EC of the European Parliament and of the Council of the 11 February 2004 on the Promotion of Cogeneration based on the useful Heat Demand in the Internal Energy Market and amending Directive 92/42/EEC ,Official Journal of the European Union , 2004 - ,
Modelling the Italian Household Sector at the Municipal Scale: Micro-CHP ,Renewables and Energy Efficiency, Energy , Vol. Vol. 68 , :92-1032014, https://doi.org/10.1016/j.energy.2014.02.055, pp - ,
IEA/ECBCS Annex 42, The Simulation of Building ‒ Integrated Fuel Cell and Other Co-generation Systems (COGEN-SIM) , 2007, http://www.ecbcs.org/annexes/annex42.htm [Accessed: 05-November-2015] - ,
IEA/ECBCS Annex 54, Integration of Micro-generation and Related Energy Technologies in Buildings , 2013, http://iea-annex54.org/index.html [Accessed: 05-November-2015] - ,
Conceptualizing and measuring Energy Security: A Synthesized Approach ,Energy , Vol. Vol. 36 (No. 8), :5343-53552011, https://doi.org/10.1016/j.energy.2011.06.043, pp - ,
Exploring the Potential Synergy between Micro-cogeneration and Electric Vehicle charging ,Applied Thermal Engineering , Vol. Vol. 71 (No. 2), :677-6852014, https://doi.org/10.1016/j.applthermaleng.2013.10.051, pp - ,
Energy-saving Effect of α Residential Polymer Electrolyte Fuel Cell Cogeneration System combined with α Plug-in Hybrid Electric Vehicle ,Energy Conversion and Management , Vol. Vol. 77 , :40-512014, https://doi.org/10.1016/j.enconman.2013.09.018, pp - ,
Dynamic Performance assessment of α Residential Building-integrated Cogeneration System under different Boundary Conditions, Part I: Energy Analysis ,Energy Conversion and Management , Vol. Vol. 79 , :731-7482014, https://doi.org/10.1016/j.enconman.2013.10.001, pp - ,
Dynamic Performance assessment of α Residential Building-integrated Cogeneration System under different Boundary Conditions, Part II: Environmental and Economic Analyses ,Energy Conversion and Management , Vol. Vol. 79 , :749-7702014, https://doi.org/10.1016/j.enconman.2013.09.058, pp - ,
Integration between Electric Vehicle charging and Micro-cogeneration System ,Energy Conversion and Management , Vol. Vol. 98 , :115-1262015, https://doi.org/10.1016/j.enconman.2015.03.085, pp - ,
Energy-saving Effect of α Residential Polymer Electrolyte Fuel Cell Cogeneration System combined with α Plug-in Hybrid Electric Vehicle ,Energy Convers Management , Vol. Vol. 77 , :40-512014, https://doi.org/10.1016/j.enconman.2013.09.018, pp - ,
Optimal Structural design of Residential Cogeneration Systems with Battery based on improved Solution Method for Mixed-integer Linear Programming ,Energy , Vol. Vol. 84 , :106-1202015, https://doi.org/10.1016/j.energy.2015.02.056, pp - ,
Thermodynamic Performance assessment of α Small Size CCHP (Combined Cooling Heating and Power) ,System with Numerical Models, Energy , Vol. Vol. 65 , :240-2492014, https://doi.org/10.1016/j.energy.2013.11.074, pp - ,
Thermo-ecological assessment of CCHP (Combined Cold-Heat-and-Power) Plant supported with Renewable Energy ,Energy , Vol. Vol. 92 (Part 3), :279-2892015, https://doi.org/10.1016/j.energy.2015.02.005, pp - ,
Cogeneration Systems with Electric Heat Pumps: Energy-shifting Properties and Equivalent Plant modelling ,Energy Conversion and Management , Vol. Vol. 50 (No. 8), :1991-19992009, https://doi.org/10.1016/j.enconman.2009.04.010, pp - ,
Effect of Operating Conditions on Performance of Domestic Heating Systems with Heat Pumps and Fuel Cell Micro-cogeneration ,Energy and Buildings , Vol. Vol. 70 , :52-602014, https://doi.org/10.1016/j.enbuild.2013.11.077, pp - ,
Parametric Study of Exergetic Efficiency of α Small-scale Cogeneration Plant Incorporating α Heat Pump ,Applied Thermal Engineering , Vol. Vol. 23 (No. 4), :459-4722003, https://doi.org/10.1016/S1359-4311(02)00216-8, pp - ,
Experimental Analysis of α Micro-trigeneration System composed of α Micro-cogenerator coupled with an Electric Chiller ,Applied Thermal Engineering , Vol. Vol. 73 (No. 1), :1307-13202014, https://doi.org/10.1016/j.applthermaleng.2014.09.018, pp - ,
Impact of Electric Vehicle charging on the Dynamic Performance of α Micro-trigeneration System for Residential Applications ,10th Conference on Sustainable development of Energy, Water and Environment Systems , 2015, 27 September-2 October - ,
TRNSYS, A Transient System Simulation Program ,Tech. Rep , 2004 - ,
Decree of President of Italian Republic n.412/93 , , http://efficienzaenergetica.acs.enea.it/doc/dpr412-93.pdf [Accessed: 05-November-2015] - ,
EnergyPlus Energy Simulation Software , , http://apps1.eere.energy.gov/buildings/energyplus/cfm/weather_data3.cfm/region=6_europe_wmo_region_6/country=ITA/cname=Italy [Accessed: 05-November-2015] - ,
, Italian Decree n. 311/06 , , http://www.camera.it/parlam/leggi/deleghe/06311dl.htm [Accessed: 05-November-2015] - ,
Heating Systems in Buildings ‒ Method for Calculation of the Design Heat Load , - ,
UNI/TS 11300-1, Energy Performance of Buildings ‒ Part 1: Evaluation of Energy need for Space Heating and Cooling , - ,
IEA / SHC Task 26 Load Profiles , , http://sel.me.wisc.edu/trnsys/trnlib/library15.htm#IEA26Load [Accessed: 05-November-2015] - ,
Realistic Domestic Hot Water Profiles in Different Time Scales , 2001, http://sel.me.wisc.edu/trnsys/trnlib/iea-shc-task26/iea-shc-task26-load-profiles-description-jordan.pdf [Accessed: 05-November-2015] - ,
Domestic Electricity demand Model ‒ Simulation Example, Loughborough University’s Institutional Repository , , http://hdl.handle.net/2134/5786 [Accessed: 05-November-2015] - ,
Natural Resources Canada, The Plug-in Electric Vehicle-Charge Impact Model (PEV-CIM) , , https://www.nrcan.gc.ca/energy/software-tools/7441 [Accessed: 05-November-2015] - ,
Aisin Seiki, Tecnocasa Climatizzazione , , www.tecnocasa.com/EN/Default.aspx?level0=prodotti&level1=mchp [Accessed: 05-November-2015] - ,
Calibration and Validation of α Model for Simulating Thermal and Electric Performance of an Internal Combustion Engine-based Micro-cogeneration Device ,Applied Thermal Engineering , Vol. Vol. 45-46 , :79-982012, https://doi.org/10.1016/j.applthermaleng.2012.04.020, pp - ,
, , http://www.clint.it/index.php?lang=en [Accessed: 05-November-2015] - ,
, , http://www.vaillant.co.uk/ [Accessed: 05-November-2015] - ,
, , www.autorita.energia.it [Accessed: 05-November-2015] - ,
Assessment of the Greenhouse Gas Emissions from Cogeneration and Trigeneration Systems, Part I: Models and Indicators ,Energy , Vol. Vol. 33 (No. 3), :410-172008, https://doi.org/10.1016/j.energy.2007.10.006, pp - ,
Experimental assessment of the Energy Performance of α Hybrid Desiccant Cooling System and Comparison with other Air-conditioning Technologies ,Applied Energy , Vol. Vol. 138 , :533-5452015, https://doi.org/10.1016/j.apenergy.2014.10.065, pp - ,
, , http://www.gse.it/it/Ritiro%20e%20scambio/Ritiro%20dedicato/Pages/default.aspx [Accessed: 05-November-2015] - ,
Manuale del Termotecnico , 2007