


Coal-fired power plants are responsible to fuel 41% of global electricity demand [1]. In some countries, this share is much higher. In China for instance, the world’s largest coal producer and consumer, the use of coal for power generation is not expected to decrease in the short to medium term [2]. Despite the on-going transition to a low carbon economy driving a move to renewable sources of energy, the supply of base-load remains dependent on fossil fuel to face their intermittent supply. In this scenario, coal is the most plentiful, and one of the cheapest, among fossil alternatives. As an example, the water scarcity crisis that occurred in Brazil, during 2013-2015, limited the hydropower generation. It is known that the majority of Brazilian electricity is supplied by hydro sources [3], this source is responsible to supply 65% of the total electricity demand [4]. As result, electricity from coal-fired power plants has increased 24.2%, presently, mineral coal represents 9.6% of the thermoelectric power source in Brazil [5].
In the face of the huge amount of solid waste produced by coal-fired power plants, many initiatives were raised in the last decades, aiming to improve waste management of such processes. Common associated solid wastes are: fly and bottom ash, flue gas desulfurization sludges, boiler blowdown and coal pile runoff, chemicals and other materials related to power plants operation. Within all named solid wastes, fly-ash, bottom ash, slag and scrubber sludge are the ones produced in higher volume [6].
Coal combines organic and mineral components in varying proportions, with ash yields ranging from 3 to 49%. Consequently, coal power generation produces significant amounts of solid wastes, Coal Combustion Products (CCP), consisting of fly-ash, bottom ash, boiler slag, and material from Flue-Gas-Desulfurization (FGD, process applied to flue-gas stream to chemically trap sulfur) [7]. The term coal ash has been used to refer to all the different ash types [8]. CCP is composed basically of non-combustible minerals and a small fraction of unreacted carbon [1]. Depending on burner and pollution control technologies (e.g., FGD), the solid wastes composition varies significantly. Wet CCP is disposed in large surface impoundments while dry CCP is disposed in landfills. To reduce landfill occupation, there is a need for utilization of CCP into valuable materials.
Semi-Dry FGD (SD-FGD) is a technology that uses Spray Dryer Absorption (SDA) to control Sulfur dioxide (SO2) emissions by flue gases, by chemical reaction with lime. According to Electric Power Research Institute [9], in 2007, about 12% of USA power plants were using SD-FGD systems, whose water use is 30 to 40% lower than the Wet-FGD technology, being attractive in regions where water supply is limited. However, while Wet-FGD CCP has commercial value for gypsum production, SD-FGD solid is almost useless, having landfills as usual destination. In general, CCP produced by SD-FGD systems is composed of Calcium sulfite (CaSO3), fly-ash and unreacted lime. Most power plants with SD-FGD do not have fly-ash pre-collectors resulting in solid waste with high ash content (> 50%).
CCP plays an important role in the cement industry. Besides reducing the need for landfill space, the use of fly-ash as substitute for traditional cement brings environmental benefits: Greenhouse Gas (GHG) emissions and primary raw material reduction. In fact, CCP has been used for decades, as a substitute for mined or manufactured materials, lowering construction costs [10]. Fly-ash is not required to pass through the clinker kiln, an energy-intensive step of Portland cement production. Furthermore, concrete from fly-ash is durable, strong and corrosion resistant [11]. There are patented processes for dry oxidation of CaSO3 from SD-FGD waste into Calcium sulfate (CaSO4). In general they claim technologies to transform CCP into cementitious material or suitable for other applications. Patent 4,478,810, authored by Bloss et al. [12], claims a method of treating final products from FGD. Patent 4,544,542, authored by Angevine et al. [13], claims a method for oxidation of FGD absorbent and the product produced thereby. Patent 4,666,694, authored by Jons et al. [14], claims a method for treating by-products from flue gas.
Alternative methods aiming to improve CCP properties and applications have also been highlighted in the literature. Li et al. [15] reported improving the pozzolanic degree of fly-ash using chemical activators solutions of Sodium hydroxide (NaOH), Sodium sulfate (Na2SO4) and Sodium chloride (NaCl) injected into the fluidized fly-ash through a side spray device, in a Fluidized Bed Reactor (FBR). Ren-ping et al. [16] studied the oxidation characteristics of ashes containing CaSO3. SDA material has been used commercially to manufacture cement in Germany after treatment in a fluidized bed process [17]. In fact, post-treatment is necessary since the use of SD-FGD solid residue as cementitious (pozzolanic) material must comply with the ASTM C618 standard or similar country-specific standards [18]. According to ASTM C618, when the CaSO3 content of fly-ash exceeds 5% by mass, it is considered inadequate for commercialization as cement additive or replacement material for concrete.
Despite the economic advantage of using SD-FGD waste as cement, the commercial application of this residue remains a challenge. In USA only 22% of SD-FGD residue is used, with mining applications representing 83% of this use. In general, coal fired power plants with SD-FGD dispose its solid waste on landfills, with massive land use. In USA, the production of SD-FGD waste was about 3.5 × 10⁶ tonnes in 2009 and is expected to double by 2019 [9].
Clearly, increased utilization of SD-FGD solid residue is needed [19]. The SD-FGD waste landfill is a potential source of contaminants. Besides landfill soil and nearby vegetation ash contamination, leaching of CCP landfills could carry toxic substances, like mercury [2], hexavalent chromium [20] and other contaminants [21], posing potential impact to groundwater.
Additionally, landfill construction and maintenance present economic penalty to electricity generation. Furthermore, the air inside and around the landfill is unhealthy to local workers, because of the high concentration of particulate matter.
Animal tests revealed that SD-FGD waste is not a skin sensitizer but, is irritating to eyes. If ingested, it is an irritant to the digestive tract, causing gastro-intestinal disturbances, erosion or hemorrhage. A moderately acute oral and injection toxicity was indicated in animals. Sulfites are recognized as a food allergen. Breathing difficulty, sneezing, throat swelling and hives could be observed after minutes of ingestion. The inhalation of sulfite aerosol caused mild lung changes in rats and effects on respiratory tract of dogs [22].
Attempts to add use and commercial value to fly-ash appear in the literature since decades. Mulder [23] investigated mechanical properties of coal fly-ash for road base construction material application. Camilleri et al. [24] studied the viability of use of fly-ash from coal-fired power plant as a cement replacement in concrete mixes. Today this topic is still being explored by many researchers. Use as Geopolymer is proposed by Chindaprasirt and Rattanasak [25] and Xu et al. [26]. Doudart de la Grée et al. [27] investigated the use of fly-ashes as building materials. Ding et al. [28] proposed the recovery of alumina from fly-ash.
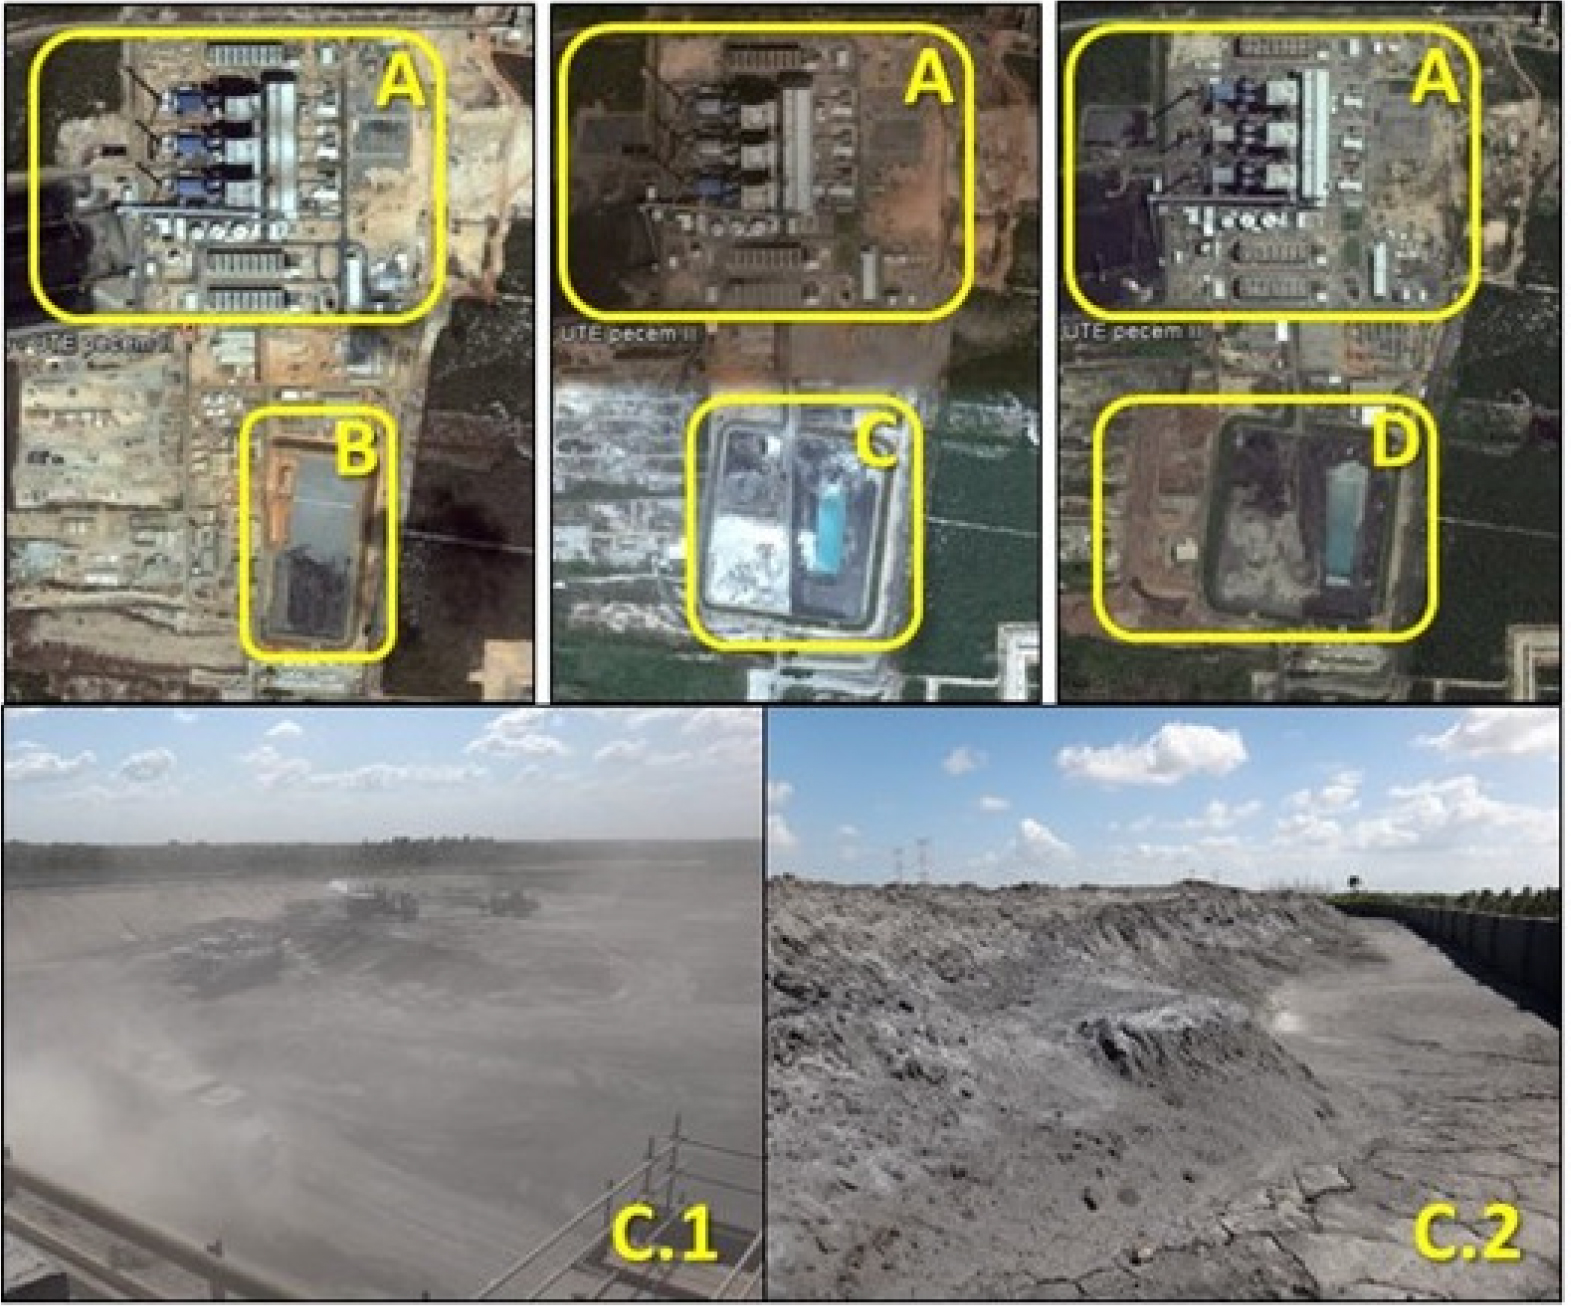
A Brazilian coal-fired power plant complex, located in the Northeast region, is considering an alternative destination for its SDA solid waste. This complex has 3 identical 360 MW Pulverized Coal Combustion (PCC) power plants, equipped with SD-FGD for reduction of SO2 emissions. After 4 years of operation, 2 landfills, with total area of ~79,500 m2 of area, became almost full with CCP and a third one is being built for operation guarantee (see Figure 1).
Time evolution of ash landfills at a Brazilian coal fired power plant [source: Google Earth (satellite images) and site pictures (landfills 1 and 2): 3 × 360 MW power plants (a); year of 2012 – power plant operations start-up ‒ landfill I (b); year of 2015 – landfill I is full, landfill II in use (c); landfill II in 2015 (c.1); landfill I in 2015 (c.2) and year of 2017 – landfill II is almost full, and landfill III is under construction (d)]
Aiming to solve the environmental challenge related to CCP landfilling, a SD-FGD waste treatment pilot-plant was designed and constructed at the Federal University of Rio de Janeiro [29]. It is based on the above-mentioned patents information with a modified layout and innovative equipment design. The main equipment is a FBR, to oxidize CaSO3, reducing the sulfite
Based on experimental results of de Castro et al. [29] and patent information [13], this work assesses the potential environmental impacts avoided if a full-scale SD-FGD waste treatment unit were put in operation. For a full-scale plant, an air compressor is required to supply air at the FBR pressure. Pressure losses through the economizer, air heater, FBR, cyclone and filter are estimated in 150 kPa, and the compressor pressure ratio is 2.47.
Environmental impacts of waste management are assessed using Waste Reduction Algorithm (WAR) [30] for three alternative destinations of CCP: BASE case, CASE I and CASE II. BASE case is the coal-fired power plant (Figure 1) operating with the FGD process and the resulting CCP destined to landfills, considered as waste on WAR. CASE I adapts the power plant to operate with the proposed full-scale FGD waste treatment unit, converting the SDA residue into a class C pozzolanic material. Although CASE I manages CCP without increasing SO2 emissions, it demands capital investments (CAPEX) for building the solid waste treatment unit. Although the air used to oxidize CaSO3 must be heated above 400-600 °C, the oxidation reaction is exothermic and, depending on the residue composition, could be autothermic. However, extra energy is necessary (e.g., for plant start-up or compensation of heat losses). Integration with hot gases, vapor purge or combustion air from the power plant process would avoid fuel consumption. CASE II consists of turning-off the SD-FGD, making possible to commercialize the residue directly as Class C pozzolanic material, because ashes are not contaminated by desulfurization products.
It is worth noting that CASE I is an environmentally friendly approach for CCP management, while CASE II prioritizes economic performance at the expense of environmental impacts. That alternative is legally possible only if the SO2 concentration in exhausted gas complies with local environmental regulation (in Brazil, 400 mg/Nm³, according to CONAMA 03/1990 [31]). Adjusting the FGD operation and using low sulfur coal, SO2 emissions will probably be very close to the regulation limit. In the event of surpassing emission limit, increased atmospheric pollution would result, comparatively to CASE I and BASE case.
The main objective of the study is to evaluate, based on a gate-to-gate Life Cycle Assessment (LCA) methodology, the environmental performance of the three CCP management alternatives, considering a set of environmental impact metrics (i.e., not restricted to solely evaluating SO2 emissions). The results aim to quantify how much CASE I is less polluting than CASE II and BASE case, proving the relevance of SDA waste treatment unit for coal-fired power plants operating with SD-FGD system. The present results and the proposed methodology contribute to the decision-making process of CCP managing of coal-fired power plants using SD-FGD. No similar work was found in the scientific literature, proving the originality of this study.
The assessment of environmental impacts of a process or product systems is useful as a decision-making tool and can be achieved using LCA [4]. ISO 14040 [32] establish four basic steps to perform a LCA:
Goal and scope definition;
Inventory analysis;
Impact assessment;
Interpretation of results.
The main goal is support decision-making on process configurations to monetize mixed coal combustion products from a 360 MW pulverized coal power plant with semi-dry FGD. A gate-to-gate life cycle assessment is performed, considering three scenarios: BASE – standard power plant [33], CASE I – base plant adopting dry thermal oxidation treatment of spray dryer solids, CASE II ‒ bypass of desulfurization system. Cases I and II allow commercialization of the solid residue as class C fly-ash.
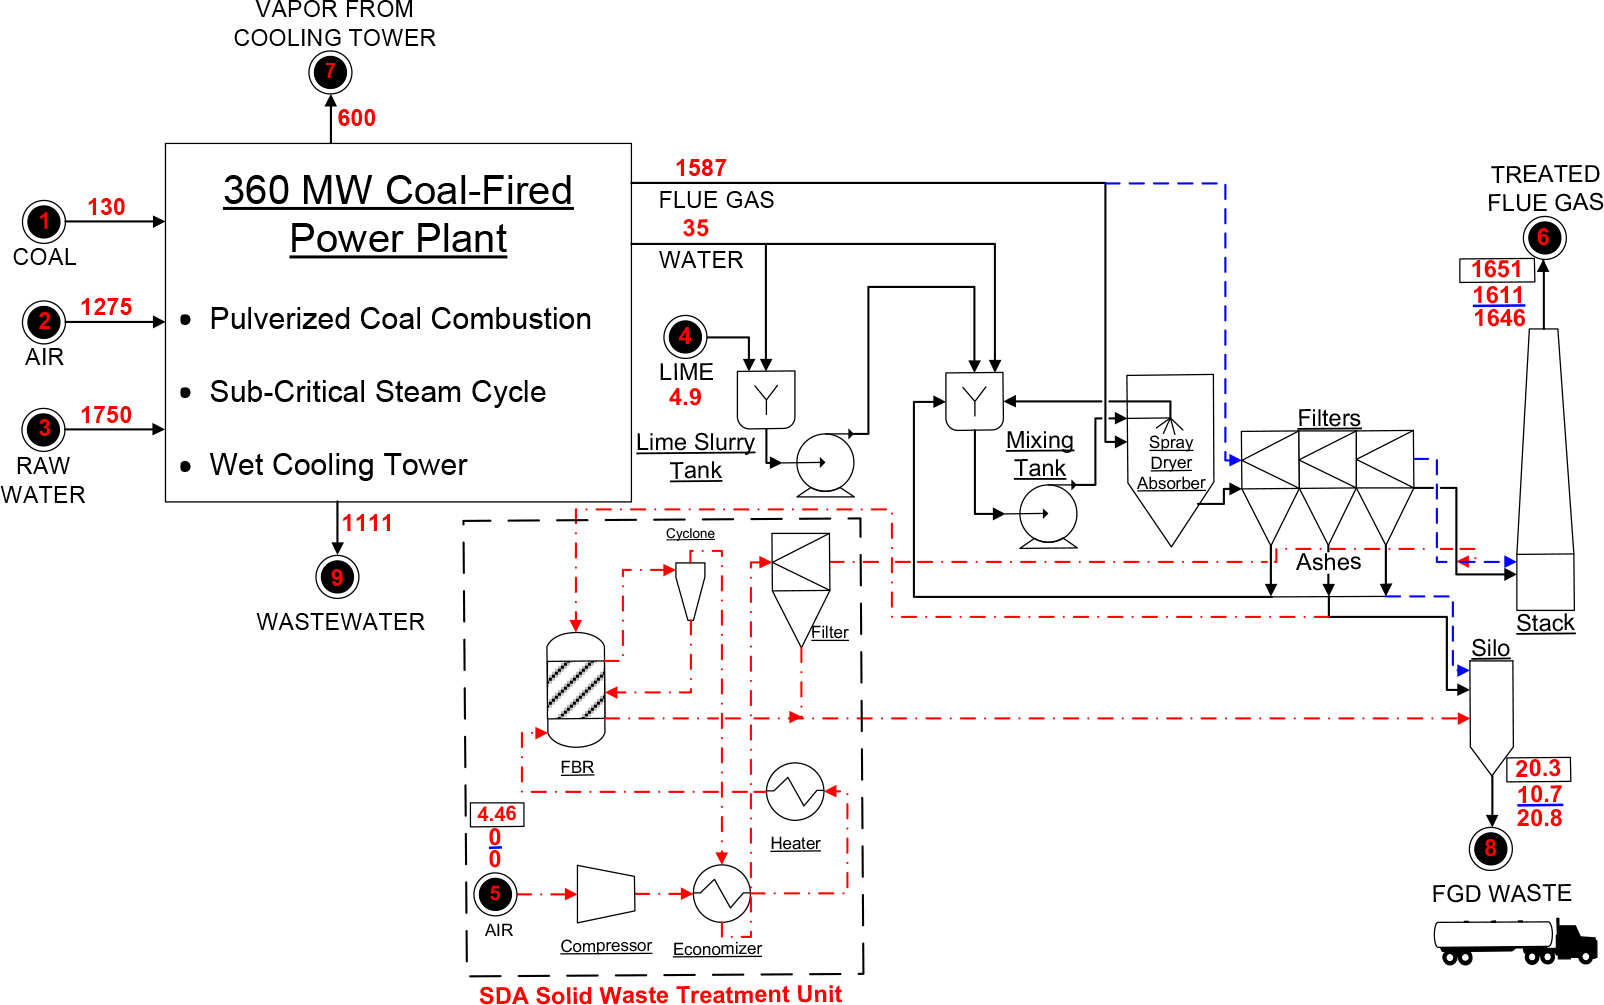
A global mass balance of each process was performed, classifying the streams as: inlet, waste outlet and product outlet. These streams are based on the Process Flow Diagram (PFD) of the Brazilian Coal-Fired power plant pictured in Figure 2, used as case study of the proposed methodology. The missing information was calculated from mass balance.
Flow diagram of the coal-fired power plant with SD-FGD waste treatment unit (dashed box), numbers in black indicate mass flow of original power plant [t/h], while red numbers within boxes correspond to CASE I and underlined blue numbers correspond to CASE II
The power plant is supplied with Colombian Coal, with composition assumed as similar to Colombian field IGM 1238 [34]. The considered set of reactions expected to occur inside the FBR and the SDA solid residue composition and mass flow is presented by Cruz et al. [33]. The last was obtained from the heat and mass balances of the power plant used as case study and considers coal with 1.5%w/w of sulfur.
Based on Angevine et al. [13], considering a temperature of 550 °C and 5% of excess O2, it is possible to achieve a SO3 mass composition of 3.2% on the treated SDA waste, complying with ASTM Standard C-618 [18] Sulfur trioxide (SO3) limit for class C or F fly-ash. Based on experiments of de Castro et al. [29], a conversion of 91.3% was considered for SO3 oxidation reaction. These results were considered for mass and energy balances of SDA treatment unit of CASE I. The specific heat of SDA residue, used to estimate energy consumption for heating the SDA residue from 80 °C to 550 °C was considered 730 J/kgK, the same value of a class C fly-ash [35].
As the FBR does not exist in industrial scale, the fluidization air flow was estimated. In a pilot scale FBR dealing with a 10%w/w CaSO3 × ½H2O feed, the flow ratio of fluidization air to stoichiometric air was taken as 3.75. Considering the calcium sulfite mass fraction as 38.4%, the stoichiometry air flow with 5% of O2 excess was considered enough to promote bed fluidization. The air compressor power was calculated by eq. (1) [36]:
where Pw is the brake horsepower [kW], q is the gas flow rate [kg/h], Z is the average compressibility factor, R is the gas constant (8.314 kJ/kmolK), T is the gas inlet temperature [K], MW is the molecular mass [kg mol/kg], rP is the pressure ratio, n is the polytropic exponent and ηP is the polytropic efficiency. The pressure ratio is calculated dividing the outlet pressure, P2 [kPa], by the inlet pressure P1 (kPa). P2 is considered 250 kPa (gauge). P1 is the atmospheric pressure (0 kPa gauge). ηP is considered 80%, q of inlet air stream (stream 1 of Figure 3), calculated as a function of the FBR demand.
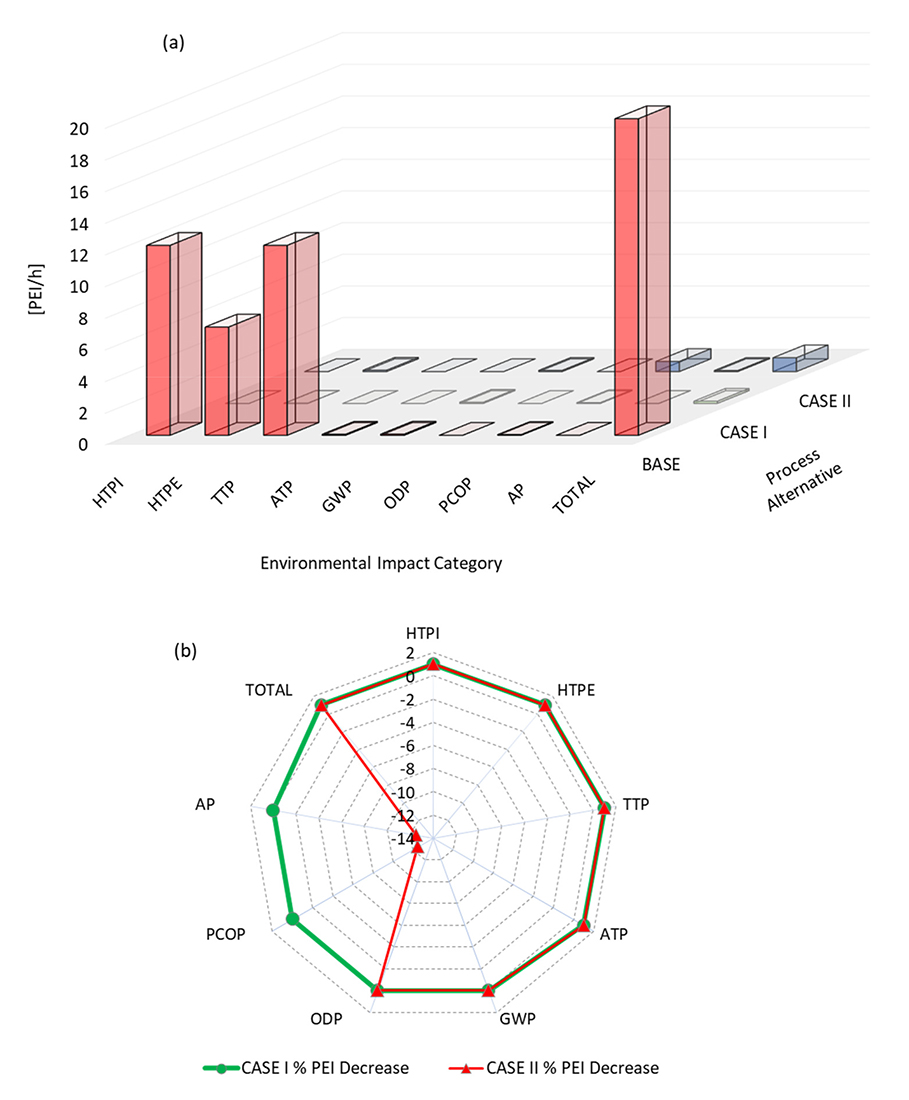
Environmental impact assessment: PEI/h for each impact categories (a) and decrease of PEI generation rates for CASE I and CASE II with respect to BASE case (b)
The air is pre-heated to 250 °C by the economizer. The heater service is to heat the air to the reactor temperature (550 °C). However, the energy supplied by the oxidation of CaSO3 and integration with high temperature steam purges from the closed loop steam cycle could bring the air heating energy input to zero (the air heater can be used only for the start-up of the system). The SDA power consumption was obtained from the Environmental Impacts Assessment Study of the power plant used as case study [37].
Evaluated alternatives are compared based on quantitative Potential Environmental Impacts (PEI), using United States Environmental Protection Agency (USEPA) Waste Reduction Algorithm [38]. To compare the environmental friendliness of chemical processes, WAR algorithm uses the concept of PEI balance. It is based on the idea that the PEI of a certain amount of material and energy can be defined as the effect that they would have on the environment if they were emitted [30]. As PEI is a conceptual quantity, it cannot be directly measured, but can be calculated from measurable parameters, using functional relations [38]. The balance considers the flow of PEI (mass + energy) across the process boundary [PEI/h]. From the balance, PEI indexes are calculated, providing the degree of environmental friendliness of the process.
WAR algorithm describes the Potential of Environmental Impacts Rate [PEI/h] for each category using the eq. (2) [38]:
where Îout is the output PEI rate, αiis the user defined weight factor for the ith impact category, Mj,out is the output mass flow of the jth stream, xkjis the composition of the kth component in the jth output stream, Ψkiis the normalized score of ith impact category for the kth component (scoreki/<scoreki>). <scoreki>is the average score of all components in a same category. According to Young and Cabezas [30], WAR classifies PEI in impact categories, with the global PEI resulting from their weighted sum (with user defined weights). Table 1 shows the impact categories and weights adopted for the current evaluation. The objective of the study is comparing scenarios. Therefore, the weight and absolute value of each category individually does not matter in the proposed analysis. We are interested in the difference between cases. Using different weights for some categories might be considered an attempt to manipulating the conclusions. Thus, it was decided to keep all weights equal to 1, for all the 3 cases.
WAR environmental impacts categories and adopted weights
Impact | Description | Weight |
|---|---|---|
HTPI | Human Toxicity Potential by Ingestion | 1 |
HTPE | Human Toxicity Potential by Exposure | 1 |
ATP | Aquatic Toxicity Potential | 1 |
TTP | Terrestrial Toxicity Potential | 1 |
GWP | Global Warming Potential | 1 |
ODP | Ozone Depletion Potential | 1 |
PCOP | Photochemical Oxidation Potential | 1 |
AP | Acidification Potential | 1 |
The inventory streams of cases BASE, I and II were used as input of WAR algorithm, through the software WAR GUI Version 1.0.17 (2008), namely chemical composition and flow rates of mass streams entering and leaving the process. Energy input were ignored (considered zero) since all the alternative cases present similar energy use.
The methodology stated on the last section was successfully applied and the main results are presented below.
According to Cruz et al. [33], the mass flow of SDA solid residue is 20.8 t/h, fly ash specific heat is 730 J/kgK. The initial CaSO3 × ½H2O content on SDA residue is 38.4%w/w, with 2% of water (humidity), 8.3% of Calcium hydroxide [Ca(OH)2] and 51.3% of inert minerals (fly-ash). Therefore, it is possible to calculate the heat balance around the FBR, product mass flow and composition as well as the air mass flows (in and out) to promote CCP oxidation inside the FBR, as shown in Tables 2-4.
FBR heat balance
Item | Energy [kW] |
|---|---|
Air heating | 372 |
Solids heating | 1,980 |
Reaction 1 (CaSO3 × ½H2O CaSO3 + H2O) | 494 |
Reaction 2 (CaSO4 × ½H2O CaSO4 + H2O) | 0.0 |
Reaction 3 [Ca(OH)2 CaO + H2O] | 697 |
Reaction 4 (CaSO3 + ½O2 CaSO4) | −4,260 |
Balance | −717 |
FBR product stream
Component | MW [g/mol] | Flow [mol/h] | Flow [kg/h] | Composition [% weight] |
|---|---|---|---|---|
CaSO3 × ½H2O | 129 | - | - | 0.00 |
CaSO4 × 2H2O | 172 | - | - | 0.00 |
Ca(OH)2 | 74 | - | - | 0.00 |
CaSO3 | 120 | 6,186 | 742 | 3.7 |
CaSO4 | 136 | 55,671 | 7,571 | 37.3 |
CaO | 56 | 23,307 | 1,305 | 6.5 |
H2O | 18 | - | - | 0.00 |
Inert | - | - | 10,660 | 52.5 |
Total | 20,279 | 100.0 |
FBR air inlet and outlet streams
FBR air inlet stream | ||||
|---|---|---|---|---|
Component | MW [g/mol] | Flow [mol/h] | Flow [kg/h] | % Molar [mole %] |
O2 | 32 | 32,475 | 1,039 | 21.0 |
N2 | 28 | 122,167 | 3,421 | 79.0 |
Air | 29 | 154,642 | 4,460 | 100.0 |
FBR air outlet stream | ||||
Component | MW [g/mol] | Flow [mol/h] | Flow [kg/h] | % Molar [mole %] |
O2 | 32 | 4,639 | 148 | 2.3 |
N2 | 28 | 122,167 | 3,421 | 59.8 |
H2O | 18 | 77,325 | 1,392 | 37.9 |
Air | 24 | 204,131 | 4,961 | 100.0 |
The FBR heat balance shows that, considering all stated premises, the reaction could be self-sufficient in terms of energy, and energy input is necessary only to start up the FBR and to supply the compressor. As shown in Table 5, the extra energy is 1,275 kW. This is only 0.35% of the plant turbine power output (360 MW) and was not considered in the WAR algorithm analysis.
Overall power plant heat balance for CASE I and CASE II
Case | Unit | I | II |
|---|---|---|---|
Coal consumption | [t/h] | 135 | 135 |
Boiler duty | [kW] | 987,368 | 987,368 |
Turbine output | [kW] | 360,000 | 360,000 |
Compressor power | [kW] | 135 | 0.00 |
SDA consumption | [kW] | 1,140 | 0.00 |
Net electrical power output | [kW] | 358,725 | 360,000 |
SDA + Ash treatment energy penalty | [kW] | 1,275 | 0.00 |
SDA + Ash treatment energy penalty | [%] | 0.35 | 0.00 |
Plant efficiency (LHV) | [%] | 36.33 | 36.46 |
Based on streams inventory, the PEI generation rate of each case (BASE, I and II) were calculated using the software WAR. Tables 6-8 show the streams inventory of each case. The results for each environmental impact category and the total PEI rate are summarized in Figure 3.
BASE case streams inventory
Stream | 1 | 2 | 3 | 4 | 5 | 6 | 7 | 8 | 9 |
|---|---|---|---|---|---|---|---|---|---|
Type | Inlet | Inlet | Inlet | Inlet | Inlet | Wasteoutlet | Waste outlet | Waste outlet | Waste outlet |
Name | Coal | Air inlet 1 | Raw water | Lime | Air inlet 2 | Flue gas | Water vapor | FGD waste | Wastewater |
Flow [t/h] | 129 | 1,275 | 1,750 | 4.9 | - | 1,646 | 600 | 20.4 | 857 |
Coal | 1.000 | - | - | - | - | - | - | - | - |
N2 | - | 0.8113 | - | - | 0.8113 | 0.6845 | - | - | - |
O2 | - | 0.1887 | - | - | 0.1887 | 0.0508 | - | - | - |
H2O | - | - | 1.0000 | - | - | 0.0761 | 1.0000 | 0.0200 | 1.000 |
SO2 | - | - | - | - | - | 0.0002 | - | - | - |
CO2 | - | - | - | - | - | 0.1884 | - | - | - |
SiO2 | - | - | - | - | - | - | - | 0.1319 | - |
Al2O3 | - | - | - | - | - | - | - | 0.1391 | - |
CaO | - | - | - | 0.9500 | - | - | - | 0.1368 | - |
MgO | - | - | - | 0.0500 | - | - | - | 0.0144 | - |
Fe2O3 | - | - | - | - | - | - | - | 0.0649 | - |
TiO2 | - | - | - | - | - | - | - | 0.0094 | - |
P2O5 | - | - | - | - | - | - | - | 0.0030 | - |
CaSO3 | - | - | - | - | - | - | - | 0.3840 | - |
SO4 | - | - | - | - | - | - | - | 0.0964 | - |
CASE I streams inventory
Stream | 1 | 2 | 3 | 4 | 5 | 6 | 7 | 8 | 9 |
|---|---|---|---|---|---|---|---|---|---|
Type | Inlet | Inlet | Inlet | Inlet | Inlet | Waste outlet | Waste outlet | Product | Waste outlet |
Name | Coal | Air inlet 1 | Raw water | Lime | Air inlet 2 | Flue gas | Water vapor | Fly-ash | Wastewater |
Flow [t/h] | 129 | 1,275 | 1,750 | 4.9 | 4.9 | 1,651 | 600 | 20.4 | 857 |
Coal | 1.000 | - | - | - | - | - | - | - | - |
N2 | - | 0.8113 | - | - | 0.8113 | 0.6845 | - | - | - |
O2 | - | 0.1887 | - | - | 0.1887 | 0.0508 | - | - | - |
H2O | - | - | 1.0000 | - | - | 0.0761 | 1.0000 | - | 1.000 |
SO2 | - | - | - | - | - | 0.0002 | - | - | - |
CO2 | - | - | - | - | - | 0.1884 | - | - | - |
SiO2 | - | - | - | - | - | - | - | 0.1352 | - |
Al2O3 | - | - | - | - | - | - | - | 0.1426 | - |
CaO | - | - | - | 0.9500 | - | - | - | 0.1195 | - |
MgO | - | - | - | 0.0500 | - | - | - | 0.0148 | - |
Fe2O3 | - | - | - | - | - | - | - | 0.0665 | - |
TiO2 | - | - | - | - | - | - | - | 0.0097 | - |
P2O5 | - | - | - | - | - | - | - | 0.0031 | - |
CaSO3 | - | - | - | - | - | - | - | 0.0365 | - |
SO4 | - | - | - | - | - | - | - | 0.4722 | - |
CASE II streams inventory
Stream | 1 | 2 | 3 | 4 | 5 | 6 | 7 | 8 | 9 |
|---|---|---|---|---|---|---|---|---|---|
Type | Inlet | Inlet | Inlet | Inlet | Inlet | Waste outlet | Waste outlet | Product | Waste outlet |
Name | Coal | Air inlet 1 | Raw water | Lime | Air inlet 2 | Flue gas | Water vapor | Fly-ash | Wastewater |
Flow [t/h] | 129 | 1,275 | 1,715 | 0 | 0 | 1,611 | 600 | 10.7 | 921 |
Coal | 1.0000 | - | - | - | - | - | - | - | - |
N2 | - | 0.8113 | - | - | 0.8113 | 0.6942 | - | - | - |
O2 | - | 0.1887 | - | - | 0.1887 | 0.0487 | - | - | - |
H2O | - | - | 1.0000 | - | - | 0.0582 | 1.0000 | - | 1.000 |
SO2 | - | - | - | - | - | 0.0028 | - | - | - |
CO2 | - | - | - | - | - | 0.1961 | - | - | - |
SiO2 | - | - | - | - | - | - | - | 0.2572 | - |
Al2O3 | - | - | - | - | - | - | - | 0.2712 | - |
CaO | - | - | - | 0.9500 | - | - | - | 0.1048 | - |
MgO | - | - | - | 0.0500 | - | - | - | 0.0281 | - |
Fe2O3 | - | - | - | - | - | - | - | 0.1264 | - |
TiO2 | - | - | - | - | - | - | - | 0.0184 | - |
P2O5 | - | - | - | - | - | - | - | 0.0059 | - |
CaSO3 | - | - | - | - | - | - | - | - | - |
SO4 | - | - | - | - | - | - | - | 0.1880 | - |
Table 6 refers to BASE case streams inventory. On BASE case it can be noticed that the stream 8 is considered as waste, because the 20.4 t/h of SD-FGD solid is landfilled. Table 7 represents CASE I, this is the only one when the stream 5 (air) is not zero. This air is used on the FBR reactor, to oxidize the CaSO3 to CaSO4. On Tables 7 and 8 the stream 8 is considered a product, and not a waste. In this way, environmental impacts of those streams are not considered by the software on PEI generation rates. On Table 8 (CASE II), it is noticed that the solids production (stream 8) is lower. It happens because FGD is out of operation. There is no lime consumption (stream 4 flow is zero), the only solid waste source is coal combustion. CASE II presents a 2% decrease on water consumption (stream 3). The reason is that FGD uses 35 t/h of water, that evaporates on the SDA. It is shown by the difference on waste flue gas mass flow (stream 6) of CASE II, compared to CASE I and BASE case. Stream 6 of CASE I presents a higher flow because the air used by the FBR is mixed with the flue gas from boiler. CASE II presents a lower flow because, as the flue gases do not pass through SDA, no water vapor is mixed with this stream.
Figure 3a shows clearly that BASE case scores are higher in categories related to human health and terrestrial toxicity (HTPI, HTPE and TTP), proving that FGD waste is indeed an environmental problem. As the PEI rate of these categories were an order of magnitude higher related to the other ones, results are presented in Figure 4, for PEI generation rates [PEI/h] in categories ATP, GWP, ODP, PCOP, AP, and decrease in PEI generation of CASES I and II with respect to BASE case.
PEI generation rates [PEI/h] for categories ATP, GWP, ODP, PCOP, AP and decrease in PEI generation of Cases I and II with respect to BASE case
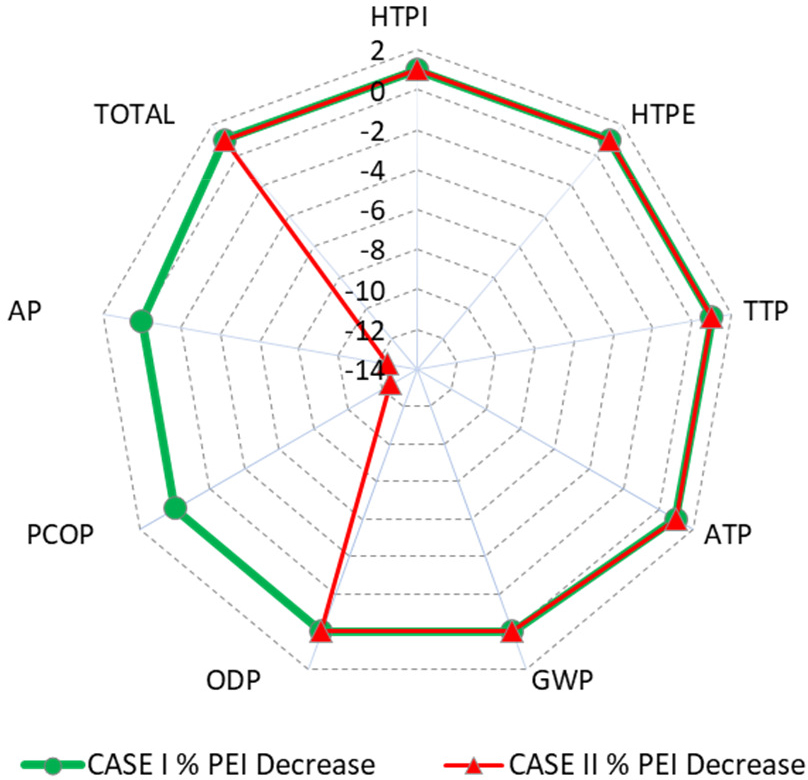
The absence of SO2 recovery system resulted in a photochemical oxidation and acidification potential PEI generation rate 1,245% higher for CASE II. That happens because these categories are directly affected by SO2 emissions. The total PEI generation reduction of CASE I was approximately 500% related to CASE II, showing definite inferiority of CASE II with respect to CASE I. It is worth noting that CASES I and II have very lower Total PEI generation rates since both CCP (solid wastes from FGD) comply with specifications for commercial use, hence being considered products and, as such, are not computed as waste (reducing PEI generation) by WAR. Clearly, the more environmentally friendly alternative to FGD solid waste problem is CASE I.
Heat and mass balances were performed for three modes of operation of the Semi-Dry FGD section of a Coal Fired power plant in the northeast of Brazil. WAR results demonstrated that BASE case is much more aggressive to the environment, due to the large amount of useless FGD waste produced. The treatment of FGD waste (CASE I) or the bypass of the SDA system (CASE II) were compared separately, as alternatives to transform the solid waste into a class C fly-ash. Because of the SDA system bypassing, SO2 emission was responsible for increasing PCOP and AP by 1,245%. CASE I was demonstrated to be the more environmentally friendly alternative, although resulting in capital expenditure to install an FBR and auxiliary equipment, to oxidize CaSO3 and solve the problem of landfill use. The SDA and FBR operation also entail an increment of operational expenditures, like energy (1,275 kW or 0.35% of the total turbine power output), water (35 t/h) and lime consumption (4.9 t/h).
Both Cases I and II allow the commercialization of the solids coming from the SDA as class C fly-ash. Thus, considering only the economic point of view, CASE II is better, but this study proves that the environmental impacts related to SO2 emissions increases dramatically, and could be prohibitive in countries where the environmental legislation is more restrictive, like in Western Europe and USA. CASE I is more sustainable, because it solves SO2 emissions, while reducing environmental impacts in other impact categories, contrarily to CASE II, which favors economics, increasing air pollution to mitigate landfill related environmental impacts. In the long term, depending on the ash and cement market, CASE I could become profitable, resulting from commercialization of treated CCP. Future work must include new data from the recently improved pilot plant and ash analytical methodology, aiming to generate a more accurate streams inventory. Results from this work could be validated, using other LCA software and data basis, like SimaPro and Ecoinvent. Use of low-grade heat from power plant could favor the economic and environmental performance of the full-scale SD-FGD treatment system. This effect must be investigated, and results included in future LCA studies.
This work was supported by COPPETEC 18235 granted by ANEEL, Brazil, under the Program of Research and Technological Development of the Electricity Sector, and CNPq/Brazil.
- ,
Coal & Electricity , 2017, World Coal Association, https://www.worldcoal.org/coal/ uses-coal/coal-electricity, [Accessed: 14-March-2017] - ,
Mercury Speciation and Emission from the Coal‐fired Power Plant Filled with Flue Gas Desulfurization Equipment ,Can. J. Chem. Eng. , Vol. 88 (5), :867-8732010, https://doi.org/10.1002/cjce.20331 - ,
J. Sustain. Dev. Energy, Water Environ. Syst. ,Clean Energy Certification in Brazil: A Proposal , Vol. 3 (1), :95-1052015, https://doi.org/10.13044/j.sdewes.2015.03.0007 - ,
Life Cycle Assessment of a Small Hydropower Plant in the Brazilian Amazon ,J. Sustain. Dev. Energy, Water Environ. Syst. , Vol. 4 (4), :379-3912016, https://doi.org/10.13044/j.sdewes.2016.04.0029 - ,
National Energetic Balance 2015 (in Portuguese) , 2015, Empresa de Pesquisa Energética (EPE), https://ben.epe.gov.br/downloads/S%25c3%25adntese do Relat%25c3%25b3rio Final_2015_Web.pdf, [Accessed: 07-April-2016] - ,
Waste Manag. , Vol. 14 (3), :299-3081994, https://doi.org/10.1016/0956-053X(94)90076-0, Developments in the Management of Wastes from Coal-fired Power Plants - ,
The National Coal Resource Assessment Overview ,U.S. Geol. Surv. Prof. Pap. , Vol. 1625 (F), :4022009 - ,
, Coal Combustion Products: A Global Perspective, Proceedings of the World of Coal Ash Conference , 2013 - ,
, Characterization of Spray Dryer Absorber Products for Use in Cement and Concrete Applications 1017580 , 2009, Electric Power Research Institute (EPRI) - ,
U.S. Historical Perspective and Forecast ,Key Findings 2015, Coal Combustion Products Utilization , 2015, American Coal Ash Association (ACAA) - ,
, Coal Combustion Products , 2018, World Coal Association (WCA), https://www. worldcoal.org/coal/uses-coal/coal-combustion-products, [Accessed: 14-March-2017] - ,
, Method of Treating Final Products from Flue Gas Desulfurization, , 1984 - ,
, Method for Oxidation of Flue Gas Desulfurization Absorbent and the Product Produced Thereby , 1985 - ,
Method for Treating By-Products from Flue Gas , 1987 - ,
Pozzolanic Reaction of Fly Ash Modified by Fluidized Bed Reactor-vapor Deposition , Vol. 92 , :98-1092017, https://doi.org/10.1016/j.cemconres.2016.11.016, Cem. Concr. Res. - ,
The Chemical and Oxidation Characteristics of Semi-dry Flue Gas Desulfurization Ash from a Steel Factory , Vol. 28 (10), :865-8712010, https://doi.org/10.1177/0734242X09339952, Waste Manag. Res. - ,
A Review of Literature Related to the Use of Spray Dryer Absorber Material Production ,Characterization, Utilization Applications, Barriers, and Recommendations , 2007, Electric Power Research Institute (EPRI), Technical Report - , Annual Book of ASTM Standards, Standard Specification for Coal Fly Ash and Raw or Calcined Natural Pozzolanfor Use, 2015
- ,
Beneficial Use of Coal Combustion Products ,An American Recycling Success Story , 2014, American Coal Ash Association (ACAA), https://www.acaa-usa.org/ Portals/9/Files/PDFs/Production-and-Use-Brochure.pdf, [Accessed: 07-April-2016] - ,
On the Removal of HexavalentChromium from a Class F Fly Ash ,Waste Manag. , Vol. 51 , :105-1102016, https://doi.org/10.1016/j.wasman.2016.02.038 - ,
Leachate from Land Disposal of Coal Fly Ash , Vol. 8 (6), :429-4491990, https://doi.org/10.1016/0734-242X(90)90019-J, Waste Manag. Res. - ,
Product of Semi-Dry Absorption method of Flue Gas Desulphurization , , European Chemicals Agency (ECHA)Registration Dossier, https://echa.europa.eu/registration-dossier/-/registered-dossier/15224/7/2/2#, [Accessed: 30-March-2017] - ,
A Mixture of Fly Ashes as Road Base Construction Material , Vol. 16 (1), :15-201996, https://doi.org/10.1016/S0956-053X(96)00026-8, Waste Manag. - ,
Utilization of Pulverized Fuel Ash in Malta , Vol. 26 (8), :853-8602006, https://doi.org/10.1016/j.wasman.2005.11.022, Waste Manag. - ,
Utilization of Blended Fluidized Bed Combustion (FBC) Ash and Pulverized Coal Combustion (PCC) Fly Ash in Geopolymer , Vol. 30 (4), :667-6722010, https://doi.org/10.1016/j.wasman.2009.09.040, Waste Manag. - ,
Low-reactive Circulating Fluidized Bed Combustion (CFBC) Fly Ashes as Source Material for Geopolymer Synthesis , Vol. 30 (1), :57-622010, https://doi.org/10.1016/j.wasman.2009.09.014, Waste Manag. - ,
Contaminated Biomass Fly Ashes – Characterization and Treatment Optimization for Reuse as Building Materials ,Waste Manag. , Vol. 49 , :96-1092016, https://doi.org/10.1016/j.wasman.2015.12.023 - ,
Research and Industrialization Progress of Recovering Alumina From Fly Ash: A Concise Review , Vol. 60 , :375-3872017, https://doi.org/10.1016/j.wasman.2016.06.009, Waste Manag. - ,
Fluidized Bed Treatment of Residues of Semi-dry Flue Gas Desulfurization Units of Coal-fired Power Plants for Conversion of Sulfites to Sulfates , Vol. 143 , :173-1872017, https://doi.org/10.1016/j.enconman.2017.03.078, Energy Convers. Manag. - ,
Designing Sustainable Processes with Simulation: The Waste Reduction (WAR) Algorithm , Vol. 23 (10), :1477-14911999, https://doi.org/10.1016/S0098-1354(99)00306-3, Comput. Chem. Eng. - ,
CONAMA Resolution No. 003 from June 28th 1990 (in Portuguese) , 1990, National Environment Council (CONAMA) - ,
Environmental Management — Life Cycle Assessment — Principles and Framework ,ISO 14040 , 2006, The International Standards Organisation - ,
Impact of Solid Waste Treatment from Spray Dryer Absorber on the Levelized Cost of Energy of a Coal-fired Power Plant , Vol. 164 , :1623-16342017, https://doi.org/10.1016/j.jclepro.2017.07.061, J. Clean. Prod. - ,
World Coal Quality Inventory: South America , 2006, http://pubs.usgs.gov/of/2006/1241/Chapter 5-Colombia.pdf, [Accessed: 28-May-2015] - ,
Thermal Properties of High-volume Fly Ash Mortars and Concretes , Vol. 34 (3), :263-2752011, https://doi.org/10.1177/1744259110376613, J. Build. Phys. - , Engineering Data Book (20th ed.), Gas Processors Suppliers Association, 2004
- ,
Environmetal Impact Assessment, Port of Itaqui Power Plant Enterprise (in Portuguese) , 13952008, Diferencial Energia Empreendimentos e Participação Ltda (DEEPL) - ,
Pollution Prevention with Chemical Process Simulators: The Generalized Waste Reduction (WAR) Algorithm — Full Version , Vol. 23 (4-5), :623-634, Comput. Chem. Eng.