


Nowadays, plastic materials are widely used in household applications, packing, electrical and vehicle equipment. Over the years, global production has reached 500 million tons per year. Arise of production of a such products, led to numerous waste management problems. There are three ways to dispose plastic waste: landfilling, incineration and recycling. Polyurethane (PU) products are used in wide spectrum of applications, due to the possibility of easily shaping their properties, therefore significant amount of waste is derived from it annually. For example, only in China it is expected that every year will be more than 14 million refrigerators of scrap. Since the polyurethane is an essential insulation material in refrigerators and it weight is around 6.36 kg per unit, more than 100,000 tons of a such waste is expected. Since the decomposition in natural conditions is not possible, followed up by small pile-up density (30 kg/m3), landfilling is excluded as a waste management option [1]. Chemical recycling methods have been extensively studied so far, nevertheless economically viable solution is still missing. Hydrolysis has been scaled up to pilot plant application for flexible PU foams and produced polyol was of high quality. Nevertheless, high energy demand required for this process, limit greater application of this technique at the moment. Aminolysis and phosphorolysis never went beyond research stage and for several years no new advances of these techniques have been reported. Glycolysis is the most promising chemical recycling technique introduced so far, especially for flexible PU foams. Products (polyol) obtained from this process is of high quality and can be easily used for the synthesis of a new polyurethane products. Even tough, absence of market where these product could be offered, coupled with economic inefficiency constrain greater deployment of this technique [2]. Consequently, waste-to-energy application looks like the most promising waste management technique for PU scrap, at least in the near future.
Alternative fuels derived from waste have been recognized as a possible solution to substitute or at least decrease consumption of fossil fuels. Mehmood et al. [3] investigated potential of co-firing between different coal types and biomass, including Refuse-Derived Fuel (RDF). Scope of the work was to determine the biomass influence on exhaust gas temperature and formation of sulfur dioxide (SO2), nitrogen oxides (NOx) and carbon dioxide (CO2) emissions. Rostek and Biernat [4], performed Thermogravimetry/Differential Scanning Calorimetry analysis (TG/DSC) on a different plastic waste in order to examine decomposition kinetics. Investigation was carried out under argon/nitrogen atmosphere, while special attention was given to an enthalpy changes and the nature of a reactions. Guo et al. [5] investigate the nitrogen migration in a pyrolysis and gasification fixed-bed reactor of a waste rigid polyurethane foam. In this study, the influence of the temperature and catalysts on the nitrogen-product distribution have also been studied. The study showed that within the temperature increment: more gas products are generated from catalytic pyrolysis than gasification. Moreover, gas productive rate is higher in gasification process than in pyrolysis and calcium oxide is the best catalyst which facilitates the migration of fuel-N into the pollution-free nitrogen (N2). Guo et al. [6] in their another work, analysed an influence of a catalyst on a yield of N-containing species from waste rigid polyurethane foam. Results showed that yield of N-containing species in the presence of catalyst is more influenced by sweeping gas flow rate than by pyrolysis temperature. Jomaa et al. [7] investigated the pyrolysis of polyurethane by dynamic thermogravimetry analysis in order to obtain the kinetic parameters of polyurethane pyrolysis. The kinetics parameters obtained by this study would be used later in Computational Fluid Dynamics (CFD) codes to simulate gas emission during the casting process. Garrido et al. [8] studied the thermal decomposition of flexible polyurethane foam at 550 °C and 850 °C using a laboratory scale reactor under nitrogen and air atmospheres. Significant yield of toxic compounds and emissions, alongside with the high net caloric value of flexible polyurethane foam, makes it a suitable fuel for cement kilns. Garrido and Font [9] analysed the thermal degradation of flexible polyurethane foam under different conditions using the Thermogravimetric Analysis (TGA), Thermogravimetric Analysis-Infrared (TG-IR) spectrometry and Thermogravimetric Analysis-Mass (TG-MS) spectrometry. The results obtained by this study showed that under an inert atmosphere, flexible polyurethane foam started the decomposition by breaking the urethane bond to produce long chains of ethers which were degraded immediately in the next step. However, under an oxidative atmosphere, at the first step not only the urethane bonds were broken but also some ether polyols started their degradation which finished at the second step producing a char that was degraded at the last stage. Jiao et al. [10] investigated the thermal degradation characteristics of rigid polyurethane foam in both air and nitrogen gaseous environments, using the thermogravimetric analysis. The study found that the thermal degradation of rigid polyurethane foam material in air and nitrogen, present a three-stage and a two-stage process, respectively. In addition, degradation reaction rate of rigid polyurethane foam in air is accelerated significantly due to the presence of oxygen. Chetehouna et al. [11] using the thermogravimetric analyser coupled to a mass spectrometer investigated the thermal degradation and kinetic parameters of innovative insulation materials. Thermogravimetry (TG) curves obtained from the analysis of eight samples showed that the thermal decomposition of composite samples is more complex than the one of the basic materials and seems to be mostly affected by the binder nature. Raclavska et al. [12] investigated the effect of moisture on the release of heavy metals during the pyrolysis of Municipal Solid Waste (MSW). It was concluded that with the increment of moisture content, release of heavy metals is increased, shifting some element classification from volatile to highly volatile. Wang et al. [13] investigated thermal decomposition of the rigid polyurethane foam used as an insulation material. Sample was investigated in air atmosphere with non-isothermal thermogravimetry and differential scanning calorimetry. The results reveal that decomposition consist of three stages: the loss of low-stability organic compounds, oxidative degradation of organic components, and oxidative degradation of residue material. He et al. [14] compared thermal degradation of polyurethane foam under oxidative and non-oxidative atmospheres. TGA coupled with in-situ Fourier Transforms Infrared (FTIR) spectroscopy showed that in the condensed phase, presence of oxygen began to accelerate the degradation process, while decomposition in N2 occurred with a delay of 30-70 ℃. Chen et al. [15] studied thermal degradation of polyurethanes containing pyridine (PUPys), which is nowadays widely used to fabricate supramolecular polymer networks. Investigation was carried out under nitrogen and oxygen atmospheres. The results showed at least two stages of degradation with better thermal stability under oxygen atmosphere. Furthermore, thermal stability is better at lower temperatures, while addition of hard segment (MDI-BDO) promotes the weight loss at higher temperatures. Up to now, a lot has been done in the field of PU degradation in inert atmosphere, where dominantly nitrogen or air was used as a sweep gas. At the same time, experimental investigations in oxygen-enriched atmosphere are seldom. Tang et al. [16], [17] in their studies compared decomposition behaviour of waste plastic under N2/O2 and CO2/O2 atmospheres. Both studies showed that the reactivity of a sample is reduced under CO2 atmosphere which results with uncomplete burnout. Furthermore, similar combustion performance was noted for 80% N2/20% O2 and 70% CO2/30% O2 atmospheric conditions, indicating that oxygen-enriched combustion may enhance the process. Below 600 ℃, replacement of N2 by CO2 did not affect reaction mechanism, while changes in kinetic mechanism were noted above 600 ℃.
In this study non-isothermal TGA was used to study the thermochemical behaviour of polyurethane plastic waste under seven different atmospheric conditions (100% N2; 5% O2/95% N2; 20% O2/80% N2; 5% O2/95% CO2; 10% O2/90% CO2; 20% O2/80% CO2; 30% O2/70% CO2). The studied polyurethane was previously used as an insulation material inside refrigerators. Polyurethane decomposition kinetic constants have been estimated by the simultaneous evaluations of seven weight loss curves measured for the heating rate of 20 K/min and a final temperature of 1,073 K. The obtained results showed that the studied polyurethane under an inert atmosphere (100% N2), decomposed quicker than in oxygen containing atmospheres. However, under an oxidative atmosphere, a smaller amount of mass was left at the end of the analysis, whereas in the inert atmosphere still the fixed carbon remained in the sample. The obtained results can be used for further investigation of polyurethane incineration process.
Investigated sample was Waste Rigid Polyurethane Foam (WRPUF) which was conducted to particle sizing and simultaneous thermogravimetric and calorimetric analysis.
Polyurethane used in this study was wasted PU plastic previously used as an insulation material inside refrigerators, collected from Croatia. The raw sample was firstly milled and sieved into the diameter of 50-100 μm, then dried at 105 °C for 24 h in an oven before use. Particle size distribution is given in Figure 1. The ultimate/proximate analyses and the ash composition analysis are shown in Table 1 and Table 2, respectively.
Particle size distribution of the investigated sample
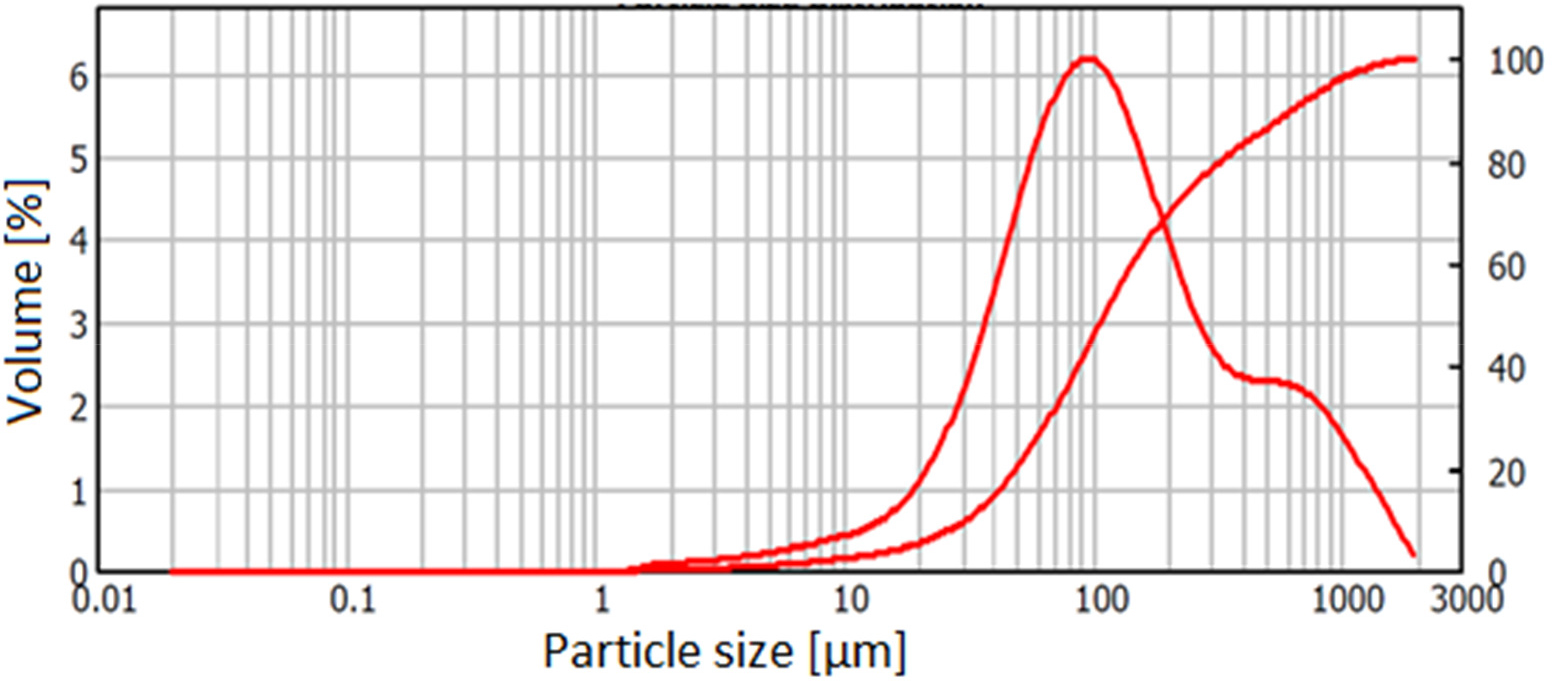
From the Figure 1 it is visible that about 80% of the particles size is below 300 µm, thus limitations regarding heat transfer could be neglected [18]. Particle size analysis was carried out within the laser particle sizer Malvern Instruments, Mastersizer 2000.
Ultimate and proximate analyses of polyurethane
Sample | Ultimate analysis [wt.%] | Proximate analysis [wt.%] | ||||||
|---|---|---|---|---|---|---|---|---|
Cad | Had | Oad | Nad | Sad | Vad | FCad | Aad | |
Polyurethane | 62.69 | 6.32 | 24.01 | 6.37 | 0.63 | 83.2 | 10.6 | 6.2 |
Mad: moisture as air dried basis, Vad: volatile matter as air dried basis, FCad: fixed carbon as air dried basis, Aad: ash as air dried basis
Ash composition analysis
Sample | TiO2 | Na2O | Fe2O3 | MgO | P2O5 | Al2O3 | SO3 | Cl | CaO | K2O | SiO2 | CuO | BaO | ZnO |
Polyurethane | 23.4 | 2.65 | 31.5 | 2.57 | 0.934 | 3.40 | 1.29 | 0.284 | 7.09 | 0.998 | 10.4 | 0.398 | 1.09 | 6.04 |
All the thermal analyses were conducted using a STA-409PC thermal analyser (NETZSCH, German). About 8 mg of fuel sample was held initially at room temperature for 30 min and then heated with a heating rate of 20 K/min from room temperature up to 800 °C under seven different atmospheric conditions (100% N2; 5% O2/95% N2; 20% O2/80% N2; 5% O2/95% CO2; 10% O2/90% CO2; 20% O2/80% CO2; 30% O2/70% CO2) with a flow rate of 200 mL/min. The mass loss (TG) curves, Differential Thermogravimetric (DTG), and Differential Scanning Calorimetry (DSC) are recorded online by the bundled software, and then investigated.
An two-step global model is used for description of the combustion process, which proceeds as the combination of two single reaction [19]:
where the sum of tar and gas is defined as the volatiles, and k(T) is the temperature dependent rate constant of reaction. Even though, the second step (2) is expected to be controlled by the oxygen diffusion, previous research showed that changes in kinetic mechanism are noticed only for the temperatures above 600 °C [20]. Since most of the polyurethane foam is occasionally decomposed below 600 °C, no restrictions toward reaction order model description of the combustion process is recognised.
For each single reaction, usually described by the Arrhenius equation, k(T) is expressed as:
where A is the pre-exponential factor (or frequency factor) [s−1], E is the activation energy [kJ mol−1], T is the absolute temperature [K] and R is the universal gas constant [8.314 J K−1mol−1].
Accordingly, the kinetic equation of common type is generally written as:
where α, t, k(T) and f(α) represent the conversion, the time, the rate constant and the function of reaction model, respectively. In this study, conversion α is defined as:
where mt, miand mf,are time t, initial and final weights of the feedstock, respectively.
The function f(α) is expressed as:
where n is the reaction order. It has been assumed that pyrolysis of solid fuel is a first order reaction [21], [22], and similar assumptions are employed here to investigate the kinetic characteristics of polyurethane pyrolysis and combustion. Therefore, f(α) is rewritten as:
By combining eqs. (3-6, the reaction rate is expressed in the form of:
In this study, non-isothermal TGA experiments with a constant heating rate β
[K min−1] are conducted, hence eq. (7) is modified into:
Rearranging and integrating gives:
which is universally accepted as the Coats-Redfern equation.
Plotting the left-hand side of eq. (10) for different conversion degrees versus 1/T at that time
gives an approximate straight line of slope
−E/R. The full solution is to be done
iteratively by first put an assuming value of E into the
equation and then recalculating the left-hand side till convergence occurs.
Meanwhile, a quick solution is also available by simply assuming it as a
constant, since it generally shows that for most values of E as
well as the temperature range, the expression of ln
Results analysis and the respective discussion are divided into three parts. First is focused on the thermogravimetric and calorimetric analysis. Secondly, kinetic analysis is carried out with a detail literature overview and obtained kinetic parameters from this investigation. Finally, influence of the atmosphere compositions is discussed.
The TG curves, DTG curves and the DSC curves during the combustion of polyurethane in different oxygen concentrations in CO2/O2 mixed atmospheres at a heating rate of 20 K/min were showed in Figure 2a and 2b. Curves representing the pyrolysis process in nitrogen atmosphere are also exhibited as a reference.
TG and DTG curves (a) and DSC curves (b)
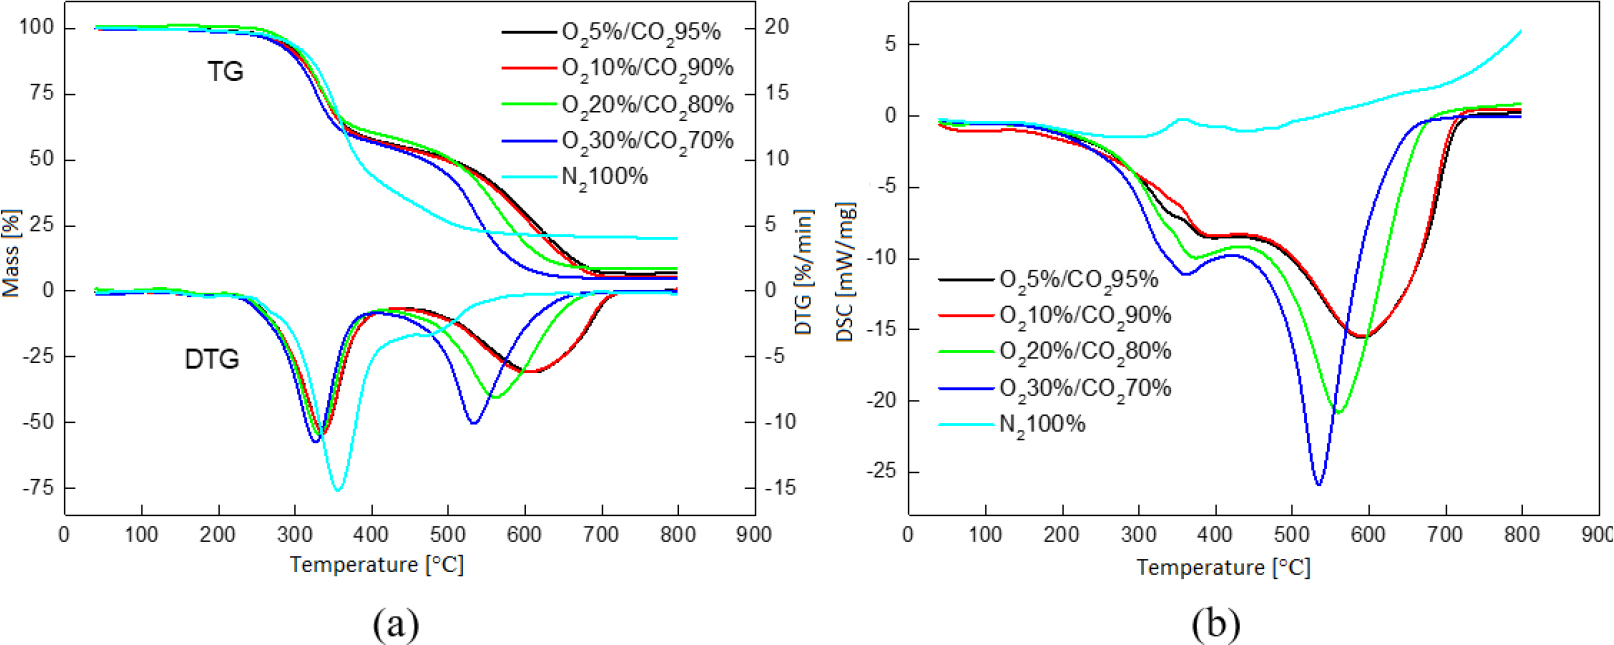
Figure 2a reports the mass loss processes as well as their rates, and by distinguishing two peaks from one mass loss rate curve, taking the valley of DTG curves as the division point of the bimodal peak, two reaction stages are confirmed for each oxygen-containing atmosphere, indicating the two stages of the combustion process of polyurethane. In these cases, the PU presents two temperature ranges of combustion whose maximums of the decomposition rates approximately distribute in 320-340 °C and in 530-610 °C, respectively. The two-stage phenomena has already been reported by other authors [17]-[25], [26] who indicated that the first stage represents the decomposition of polyurethane and the release of volatile compounds, while the second stage corresponds to the oxidation process of the residues. With the increase of oxygen concentration, the same characteristics are maintained, as shown in Figure 2a, while deviation begins to appear in the form of a lower temperature range of the second stage. From both TG and DTG curves, with the increase of oxygen concentration, the first stage shows to be less effected and the trend of TG/DTG curves is basically unchanged, while the second peaks occur earlier under the influence of oxygen acceleration. This results corresponds well with the work of Branca et al. [26] who postulated that oxygen exerts a small influence on the primary decomposition of polyurethane, while it affects significantly the breakage of the polymeric chains. While decomposition of a sample under oxygen-enriched atmosphere is almost equally divided above and below 400 ℃, decomposition under nitrogen atmosphere almost entirely happened below 400 ℃. Similar phenomena was previously noted by other authors [27], [28]. Figure 2b also puts a strong support on the conclusion that higher oxygen content in the atmosphere enhances the oxidation process which is highly exothermic, thus promoting the peak value of DSC curves. Decomposition process under nitrogen atmosphere is almost entirely endothermic.
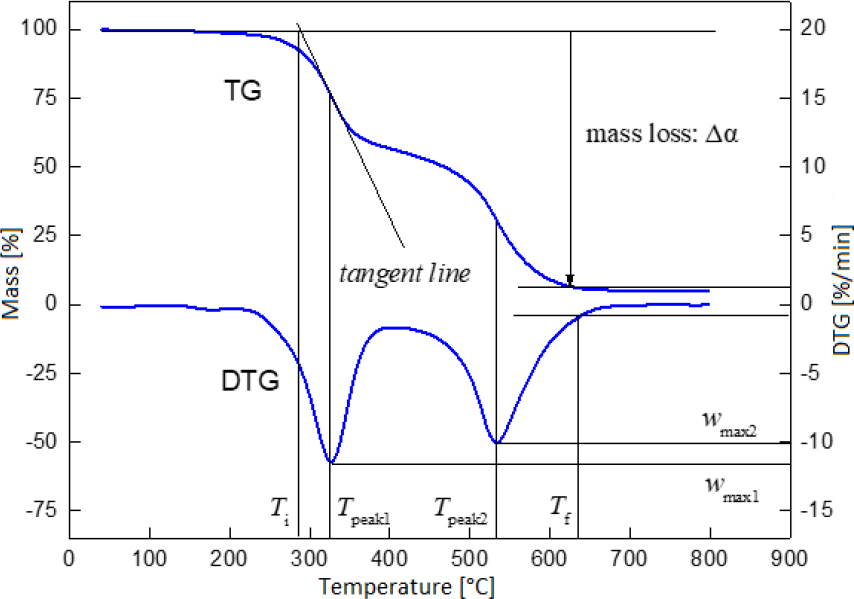
To precisely understand the impact of changing atmosphere conditions, a summary of the degradation characteristics for the polyurethane is given in Table 3, while Figure 3 illustrates their concrete embodiments in TG and DTG curves. It is visible that initial temperatures (Ti) and the peak temperatures in the first stage (Tpeak1) are quantitatively similar and roughly comprise 289.0-295.8 °C and 326.5-336.2 °C, respectively. However, the peak temperatures in the second stage (Tpeak2) and the final temperatures (Tf) are greatly influenced, that deviations from 609.3 °C to 533.2 °C and from 700.4 °C to 633.1 °C are obtained, respectively. Furthermore, the higher oxygen-concentrating atmospheres are associated with similar maximum weight loss rate in the first stage (wmax1), but higher of that in the second stage (wmax2), and therefore result in higher mean weight loss rate (wmean).
Degradation characteristics of polyurethane
Atmosphere |
Ti [°C] |
Tpeak1 [°C] |
Tpeak2 [°C] |
Tf [°C] |
wmax1 [% min−1] |
wmax2 [% min−1] |
wmean [% min−1]> |
|---|---|---|---|---|---|---|---|
O25%/CO295% | 295.8 | 336.2 | 609.3 | 700.4 | −10.742 | −6.131 | −4.177 |
O210%/CO290% | 294.5 | 336.1 | 601.9 | 697.5 | −10.799 | −6.128 | −4.238 |
O220%/CO280% | 291.4 | 331.2 | 550.9 | 655.6 | −10.898 | −8.076 | −4.642 |
O230%/CO270% | 289.0 | 326.5 | 533.2 | 633.1 | −11.464 | −10.928 | −4.953 |
O25%/N295% | 292.0 | 333.2 | 581.0 | 672.5 | −10.914 | −7.054 | −4.460 |
O220%/N280% | 287.5 | 327.2 | 547.4 | 635.4 | −10.928 | −9.345 | −4.876 |
N2100% |
316.3 |
Tpeak [°C] |
536.4 |
wmax [% min−1] |
−5.840 |
||
356.3 |
−15.122 |
||||||
Source: Ti: initial weight loss temperature, ti: initial weight loss time [min], Tpeak1: peak temperature in the first stage, Tpeak2: peak temperature in the second stage, Tf: final temperature, tf: final temperature [min], wmax1: maximum weight loss rate in the first stage, wmax2: maximum weight loss rate in the second stage, wmean: mean weight loss rate, wmean = Δα/(tf − ti)
Explanation of the TG and DTG curves
Cai et al. [23] reported a method that involves taking several independent first order reactions to describe a whole reaction curve, and by introducing this method, each stage of the combustion process is defined as a first order reaction whose Arrhenius kinetic plot of ln
Plots of ln
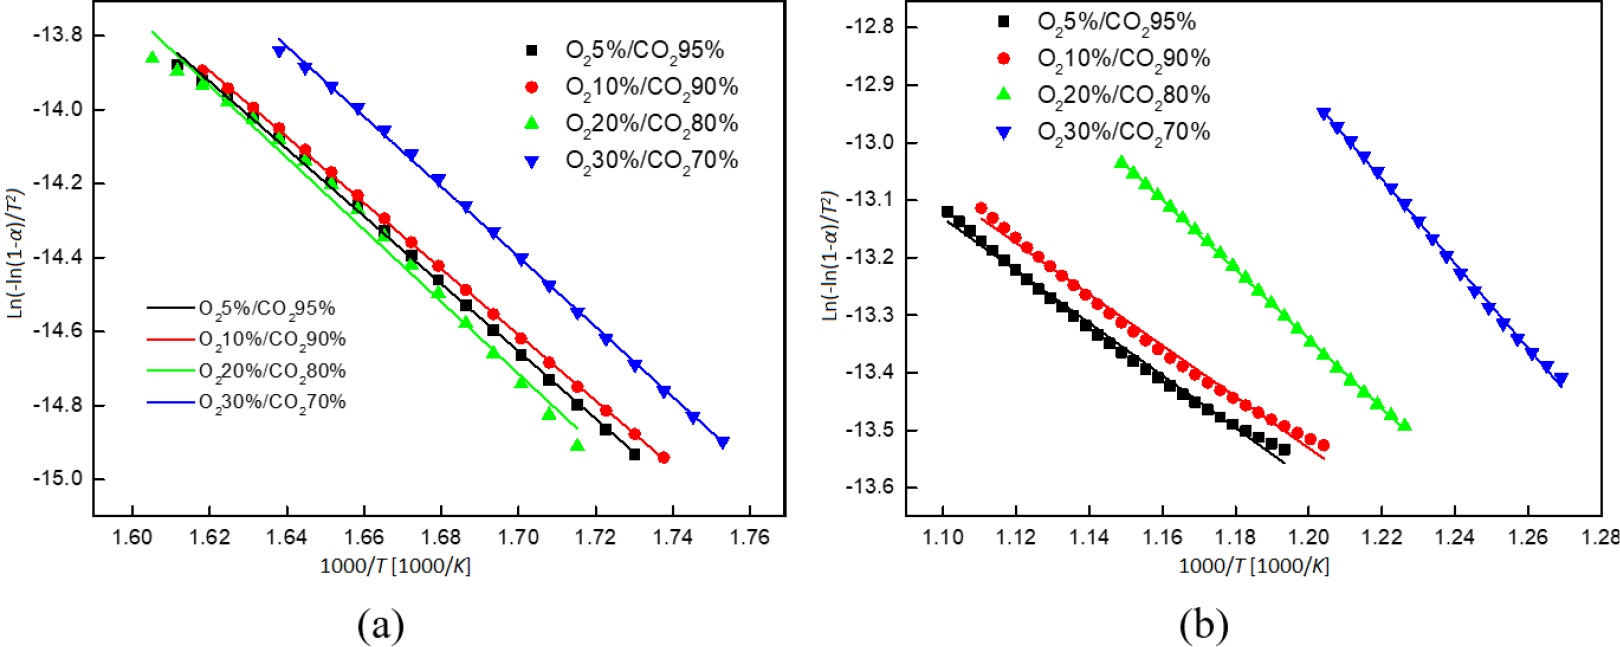
In Table 4, a constant value of activation energy in the first stage but an increasing value of that in the second stage is derived, with the increase of oxygen concentration. This result is constant with what obtained by former studies [29]-[31]. Accordingly, the decrease of activated molecule concentration, diffusion limitation and organic impurities are the influential factors of activation energy during the process of combustion of samples [32], while Chen et al. [31] reported that an increasing oxygen concentration might contributes to the increase of surface temperature and the expanded grain size of semi-coke, as well as the increase of ash content with the increase of final temperature.
Kinetic parameters for TGA of polyurethane under different atmosphere conditions
Atmosphere | Conversion | E [kJ mol−1] | A [s−1] | R2 |
|---|---|---|---|---|
O25%/CO295% |
α = 0.15-0.35 |
65.60794 |
803,244.2 |
0.98491 |
α = 0.6-0.8 |
37.10179 |
397.6939 |
0.99248 |
|
O210%/CO290% |
α = 0.15-0.35 | 66.96354 | 1,105,331 | 0.99046 |
| α = 0.6-0.8 | 38.31658 | 360.9528 | 0.99195 | |
O220%/CO280% |
α = 0.15-0.35 | 61.23135 | 309,934.7 | 0.96039 |
| α = 0.6-0.8 | 50.26218 | 4,579.982 | 0.99962 | |
O230%/CO270% |
α = 0.15-0.35 | 69.65218 | 2,436,423 | 0.98655 |
| α = 0.6-0.8 | 60.2375 | 35,329.11 | 0.99714 | |
O25%/N295% |
α = 0.15-0.35 | 67.31888 | 1,247,096 | 0.98646 |
| α = 0.6-0.8 | 42.57224 | 1,171.195 | 0.99289 | |
O220%/N280% |
α = 0.15-0.35 | 66.74333 | 1,250,585 | 0.98564 |
| α = 0.6-0.8 | 56.92697 | 18,117.38 | 0.99521 | |
N2100% |
α = 0.15-0.4 | 91.19688 | 1.37E+08 | 0.99928 |
| α = 0.55-0.65 | 10.70079 | 5.261967 | 0.98753 |
In spite of the complicated chemical behaviour of thermal degradation of polyurethane, previous studies have determined the composition of only a few global reactions [8]-[25], [26], [33], [34]. To summarize the kinetic parameters proposed by these authors, Table 5 was established with the characteristics of each study. It can be concluded that the general characteristics are basically similar, and the differences in the values of activation energy might be mainly explained by the differences in compositions of experiment materials, since the polyurethane used in this study was collected from solid wastes and thus resulted to a higher contents of impurities, which is indicated in the ash compositions in Table 2, while the different experiment conditions such as atmospheres and gas flow rates also contribute. Finally, selection of the chemical model can significantly influence investigations parameters, therefore results comparison between different chemical models should be done cautiously.
Optimised parameters for combustion of PU [6]
Reference | Scheme | Experiments | Pre-exponential factors [s−1] | Activation energy [kJ mol−1] | Reaction order | |||
|---|---|---|---|---|---|---|---|---|
Bilbao et al. [33] | 1 reaction | 1 dynamic run AIR (5 °C/min) (compared with isothermal data) | A1 | 4.60 × 10⁶ | E1 | 97.4 | n1 | 1 |
Branca et al. [26] | 3 consecutive reactions | 4 dynamic runs AIR (5, 10, 15 and 20 °C/min) | A1 | 2.25 × 10¹² | E1 | 133.6 | n1 | 1 |
A2 | 3.26 × 10⁴ | E2 | 81 | n2 | 1 | |||
A3 | 8.70 × 10⁸ | E3 | 180 | n3 | 1 | |||
Rein et al. [34] | 3 consecutive reactions | 1 dynamic run AIR (10 °C/min) | A1 | 5.00 × 10⁵ | E1 | 200 | n1 | 3 |
A2 | 2.00 × 10¹² | E2 | 155 | n2 | 1 | |||
A3 | 4.00 × 10¹³ | E3 | 185 | n3 | 1 | |||
Rein et al. [25] |
5 consecutive reactions (2 pyrolysis + 3 combustions) |
1 dynamic run AIR (20 °C/min) |
A1 |
2.00 × 10¹¹ |
E1 |
148 |
n1 |
0.21 |
A2 | 1.58 × 10⁸ | E2 | 124 | n2 | 1.14 | |||
A3 | 2.51 × 10¹⁵ | E3 | 194 | n3 | 0.52 | |||
A4 | 2.51 × 10¹⁵ | E4 | 195 | n4 | 0.52 | |||
A5 | 1.58 × 10¹⁵ | E5 | 201 | n5 | 1.23 | |||
Garrido and Font [9] | 3 consecutive reactions | 6 dynamic runs (5, 10 and 20 °C/min) + 6 dynamic + isothermal runs (5, 10 and 20 °C/min) 4:1 and 9:1 N2:O2 | A1 | 4.05 × 10²⁰ | E1 | 238 | n1 | 2.00 |
A2 | 5.09 × 10⁷ | E2 | 104 | n2 | 0.78 | |||
A3 | 6.66 × 10⁵ | E3 | 120 | n3 | 1.03 | |||
This study | 2 consecutive reactions | 4 dynamic runs (20 °C/min) 5:95, 10:90, 20:80 and 30:70 O2:CO2 | A1 | 3.10 × 10⁵-2.44 × 10⁶ | E1 | 61-69 | n1 | 1 |
A2 | 3.61 × 10²-3.53 × 10⁴ | E2 | 37-60 | n2 | 1 | |||
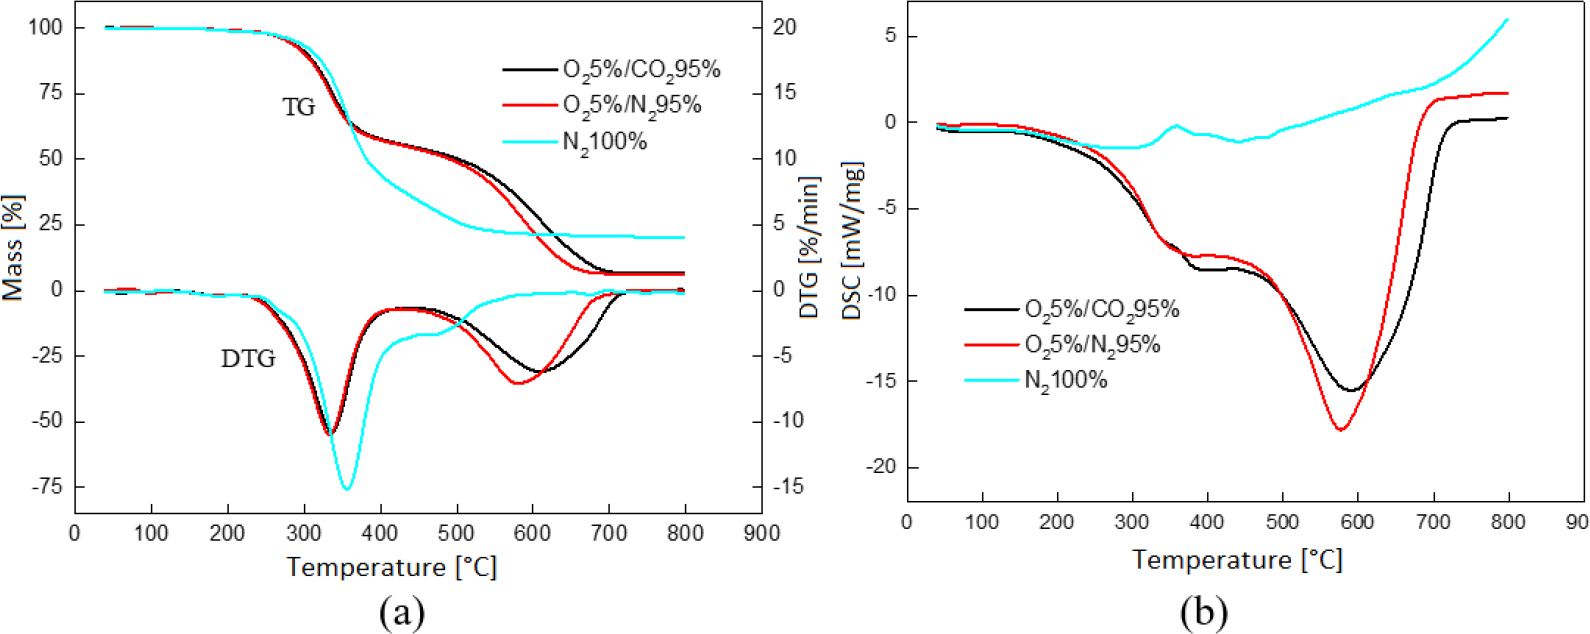
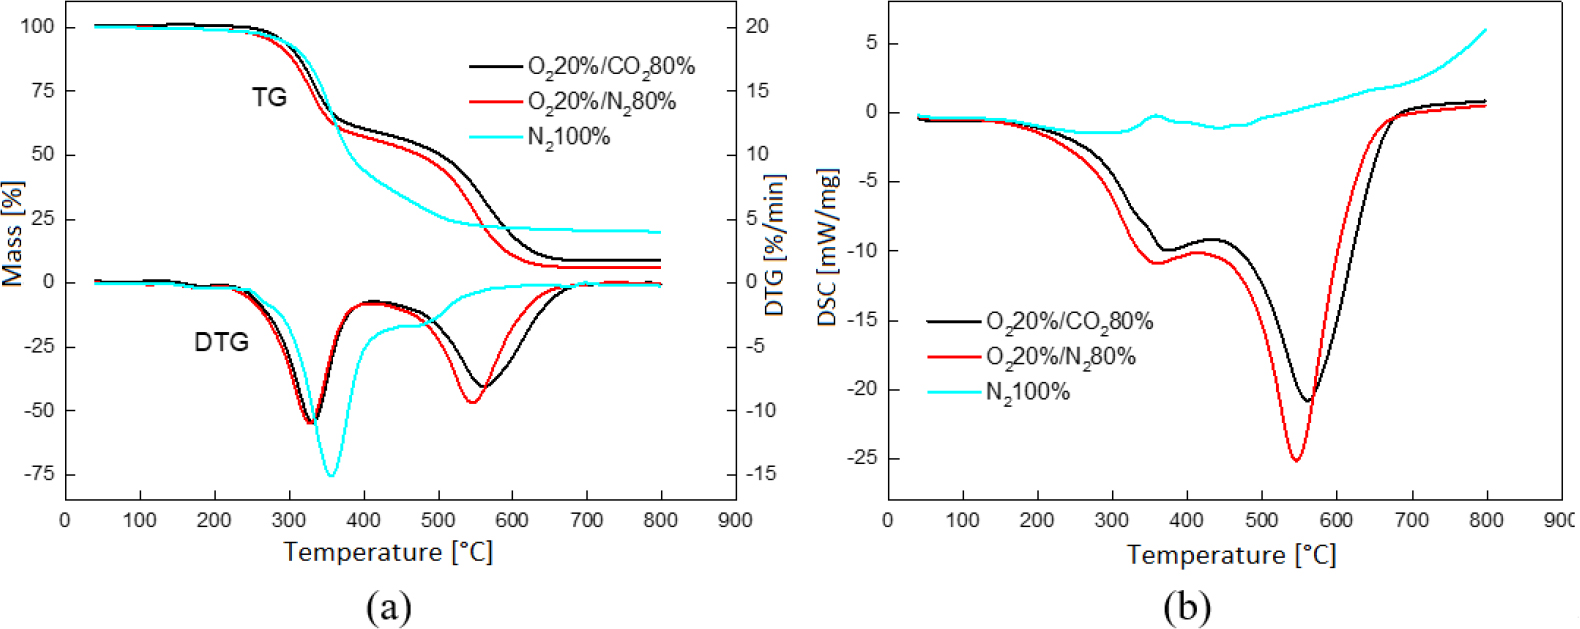
To further investigate the influence of different atmosphere conditions, TG as well as DTG curves and DSC curves are compared, respectively, under two different oxygen concentrations, as shown in Figures 5 and 6. Well matches are observed at the first stage of combustion under both oxygen concentrations in both O2/CO2 and O2/N2 atmospheres, indicating that nitrogen has a minor effect on reactions at the initial stage of combustion. However, the second stage of combustion seems appear earlier in O2/N2 atmospheres than in O2/CO2 atmospheres, exerting the effect of activating the second stage of combustion, leading to a shift of second peak to a lower temperature range as well as a higher peak value in DSC curves. From the comparison of thermal characteristics and kinetic parameters in Tables 3 and 4, respectively, the same conclusions are simultaneously drawn. Similar conclusions have been reported by Tang et al. [17] who have also stated less residue weights under O2/N2 atmospheres than under O2/CO2 ones in the combustion of microalgae and MSW cases, which is not observed in this study. The absence of this phenomenon might be mainly due to the simpler structures and lower ash contents of polyurethane than biomass, correspondingly leading to similar residue weights in both atmospheres. Overall, the CO2 atmosphere exhibits the reduction of reactivity in high temperature comparing to N2 atmosphere [17].
TG and DTG curves (a) and DSC curves (b) under 5% oxygen concentration in O2/CO2 and O2/N2 atmospheres
TG and DTG curves (a) and DSC curves (b) under 20% oxygen concentration in O2/CO2 and O2/N2 atmospheres
The decomposition process of polyurethane can be roughly divided into two stages, one of which represents the degradation of PU and devolatilization, while another represents the oxidation of residues. TGA results under different atmosphere conditions show that higher concentration of oxygen slightly influences the first stage but highly accelerates the second one, which therefore ascribes to a higher mean weight loss rate, and results to an increasing activation energy. Replacing CO2 with N2 slightly influences the first stage while positively influences the second stage, expressing in lower peak temperatures in DTG curves and higher peak values in DSC curves. Further investigation on oxygen-enriched combustion is strongly preferable. Of a special interest would be description of the decomposition process with an appropriate 3D-diffusion models, where oxygen diffusion plays a key role.
- ,
Recycling and Disposal Methods for Polyurethane Foam Wastes ,Procedia Environ. Sci. , Vol. 16 , :167-1752012, https://doi.org/10.1016/j.proenv.2012.10.023 - ,
Recycling of Polyurethanes from Laboratory to Industry, a Journey Towards the Sustainability ,Waste Manag. , Vol. 76 , :147-1712018, https://doi.org/10.1016/j.wasman.2018.03.041 - ,
Emissions and Furnace Gas Temperature for Electricity Generation via Co-Firing of Coal and Biomass , Vol. 3 (4), :344-3582015, https://doi.org/10.13044/j.sdewes.2015.03.0026, J. Sustain. Dev. Energy, Water Environ. Syst. - ,
Thermogravimetry as a Research Method in the Transformation Processes of Waste Rubber and Plastic Products for Energy Carriers (Wte and Wtl Processes) , Vol. 1 (2), :163-1712013, https://doi.org/10.13044/j.sdewes.2013.01.0012, J. Sustain. Dev. Energy, Water Environ. Syst. - ,
Comparative Study of Nitrogen Migration Among the Products from Catalytic Pyrolysis and Gasification of Waste Rigid Polyurethane Foam ,J. Anal. Appl. Pyrolysis , Vol. 120 , :144-1532016, https://doi.org/10.1016/j.jaap.2016.04.018 - ,
Nitrogenous Emissions from the Catalytic Pyrolysis of Waste Rigid Polyurethane Foam ,J. Anal. Appl. Pyrolysis , Vol. 108 , :143-1502014, https://doi.org/10.1016/j.jaap.2014.05.006 - ,
Kinetic Modeling of Polyurethane Pyrolysis Using Non-Isothermal Thermogravimetric Analysis ,Thermochim. Acta , Vol. 612 , :10-182015, https://doi.org/10.1016/j.tca.2015.05.009 - ,
Pollutant Emissions During the Pyrolysis and Combustion of Flexible Polyurethane Foam ,Waste Manag. , Vol. 52 , :138-1462016, https://doi.org/10.1016/j.wasman.2016.04.007 - ,
Pyrolysis and Combustion Study of Flexible Polyurethane Foam, ,J. Anal. Appl. Pyrolysis , Vol. 113 , :202-2152015, https://doi.org/10.1016/j.jaap.2014.12.017 - ,
Thermal Degradation Characteristics of Rigid Polyurethane Foam and the Volatile Products Analysis with Tg-Ftir-Ms ,Polym. Degrad. Stab. , Vol. 98 (12), :2687-26962013, https://doi.org/10.1016/j.polymdegradstab.2013.09.032 - ,
Investigation on the Thermal Degradation and Kinetic Parameters of Innovative Insulation Materials Using Tga-Ms ,Appl. Therm. Eng. , Vol. 81 , :177-1842015, https://doi.org/10.1016/j.applthermaleng.2015.02.037 - ,
The Effect of Moisture on the Release and Enrichment of Heavy Metals During Pyrolysis of Municipal Solid Waste ,Waste Manag. Res. , Vol. 33 (3), :267-2742015, https://doi.org/10.1177/0734242X14568609 - ,
Thermal Decomposition Kinetics of Rigid Polyurethane Foam and Ignition Risk by a Hot Particle ,J. Appl. Polym. Sci. , Vol. 131 (4), :1-92014, https://doi.org/10.1002/app.39359 - ,
Thermal Degradation Study of Pure Rigid Polyurethane in Oxidative and Non-Oxidative Atmospheres ,J. Anal. Appl. Pyrolysis , Vol. 120 , :269-2832016, https://doi.org/10.1016/j.jaap.2016.05.015 - ,
Studies on the Thermal Stability of Polyurethanes Containing Pyridine: Thermogravimetric Analysis ,Thermochim. Acta , Vol. 543 , :281-2872012, https://doi.org/10.1016/j.tca.2012.06.009 - ,
Thermogravimetric Analyses of Co-Combustion of Plastic ,Rubber, Leather in N2/O2 and CO2/O2 Atmospheres, Energy , Vol. 90 , :1066-10742015, https://doi.org/10.1016/j.energy.2015.08.015 - ,
Thermogravimetric Analysis of the Combustion of Microalgae and Microalgae Blended with Waste in N2/O2 and CO2/O2 Atmospheres ,Bioresour. Technol. , Vol. 102 (2), :1879-18852011, https://doi.org/10.1016/j.biortech.2010.07.088 - ,
Polymeric Cracking of Waste Polyethylene Terephthalate to Chemicals and Energy ,J. Air Waste Manag. Assoc. , Vol. 61 (7), :721-7312011, https://doi.org/10.3155/1047-3289.61.7.721 - ,
Thermogravimetric Analysis and Kinetic Study of Poplar Wood Pyrolysis ,Appl. Energy , Vol. 97 , :491-4972012, https://doi.org/10.1016/j.apenergy.2011.12.056 - ,
Thermogravimetric Analyses of Combustion of Lignocellulosic Materials in N2/O2 and CO2/O2 Atmospheres ,Bioresour. Technol. , Vol. 107 , :444-4502012, https://doi.org/10.1016/j.biortech.2011.12.039 - ,
Devolatilization Rate of Biomasses and Coal-Biomass Blends: An Experimental Investigation ,Fuel , Vol. 81 (8), :1041-10502002, https://doi.org/10.1016/S0016-2361(01)00204-6 - ,
Effect of Inorganic Matter on Reactivity and Kinetics of Coal Pyrolysis ,Fuel , Vol. 83 (6), :713-7182004, https://doi.org/10.1016/j.fuel.2003.08.017 - ,
Thermogravimetric Analysis and Kinetics of Coal/Plastic Blends During Co-Pyrolysis in Nitrogen Atmosphere ,Fuel Process. Technol. , Vol. 89 (1), :21-272008, https://doi.org/10.1016/j.fuproc.2007.06.006 - ,
Thermal Decomposition Kinetics of Natural Fibers: Activation Energy with Dynamic Thermogravimetric Analysis ,Polym. Degrad. Stab. , Vol. 93 (1), :90-982008, https://doi.org/10.1016/j.polymdegradstab.2007.10.012 - ,
Application of Genetic Algorithms and Thermogravimetry to Determine the Kinetics of Polyurethane Foam in Smoldering Combustion ,Combust. Flame , Vol. 146 (1-2), :95-1082006, https://doi.org/10.1016/j.combustflame.2006.04.013 - ,
Reaction Kinetics and Morphological Changes of a Rigid Polyurethane Foam During Combustion ,Thermochim. Acta , Vol. 399 (1-2), :127-1372003, https://doi.org/10.1016/S0040-6031(02)00455-0 - ,
Study on the Pyrolytic Behaviors and Kinetics of Rigid Polyurethane Foams ,Procedia Eng. , Vol. 52 , :377-3852013, https://doi.org/10.1016/j.proeng.2013.02.156 - ,
Kinetics and Volatile Products of Thermal Degradation of Building Insulation Materials ,Thermochim. Acta , Vol. 547 , :120-1252012, https://doi.org/10.1016/j.tca.2012.07.020 - ,
Experimental and Kinetic Modeling of Oxygen-Enriched Air Combustion of Municipal Solid Waste ,Waste Manag. , Vol. 29 (2), :792-7962009, https://doi.org/10.1016/j.wasman.2008.06.010 - ,
Thermal Analysis and Devolatilization Kinetics of Cotton Stalk, Sugar Cane Bagasse and Shea Meal Under Nitrogen and Air Atmospheres ,Bioresour. Technol. , Vol. 100 (3), :1413-14182009, https://doi.org/10.1016/j.biortech.2008.07.065 - ,
Thermogravimetric Analysis of Microalgae Combustion Under Different Oxygen Supply Concentrations ,Appl. Energy , Vol. 88 (9), :3189-31962011, https://doi.org/10.1016/j.apenergy.2011.03.003 - ,
Kinetic Study on Pyrolysis and Combustion of Wood Under Different Oxygen Concentrations by Using Tg-Ftir Analysis ,J. Anal. Appl. Pyrolysis , Vol. 77 (1), :22-272006, https://doi.org/10.1016/j.jaap.2005.12.010 - ,
Kinetics of the Thermal Decomposition of Polyurethane Foams in Nitrogen and Air Atmospheres ,J. Anal. Appl. Pyrolysis , Vol. 37 (1), :69-821996, https://doi.org/10.1016/0165-2370(96)00936-9 - ,
Modeling of One-Dimensional Smoldering of Polyurethane in Microgravity Conditions ,Proc. Combust. Inst. , Vol. 30 (2), :2327-23342005, https://doi.org/10.1016/j.proci.2004.08.150