


Large urban centres are currently experiencing significant transportation and quality of life issues. These problems stem from an increase in the number of motor vehicles in cities and touch diverse domains ranging from issues of spatial inequality to increasing chronic congestion and high rates of traffic accidents [1].
Discussions on mobility problems are no longer limited to big cities because these issues have extended to smaller municipalities and university campuses. The academic community has sensed the negative effects of spatial priorities attributed to automobiles,
which are demanding increasing space for motorised vehicle circulation to the detriment of other modes of transport [1].
Understanding the mobility characteristics and demand behaviours of transportation in a university city makes it possible to analyse the current performance of routes that promote student movement, involving spaces for cars and other means of transportation, such as cycling, public transportation, and walking. Additionally, understanding these characteristics makes it possible to perform more rational, sustainable, and equitable transport planning [2].
Therefore, it is essential to understand the reasons that lead university students to choose a particular mode of transport to their destinations because if these conditions change, there will be a corresponding change in choice. University campuses are travel-generating poles that attract a large numbers of people daily [2].
To overcome congestion issues, this paper focuses on university campuses in an attempt to understand which characteristics are relevant for encouraging users to change their mode of transport to reduce the number of trips made by motorised vehicles and encourage sustainable mobility based on actives modes of transport. According to Balsas [3], universities have organisational similarities with many municipalities, but their residents tend to have greater openness toward adopting new habits.
Grau [1] stated that journeys undertaken by the academic community to and from universities over the past decade have largely occurred through the use of automobiles. This trend has contributed to environmental and circulation problems on campuses, with various factors that highlight the importance of taking measures to encourage the use of actives modes of transport, such as bicycling and walking.
Active modes of transport, such as walking and cycling, are economically viable options for students traveling to and from universities, but a lack of adequate and efficient infrastructures both inside and outside of campuses tend to discourage the use of active modes of transport and encourage the adoption of motorised modes [1].
Páez and Whalen [4] noted that many cities that universities are becoming increasingly concerned about the harmful effects of automobiles and are striving to create sustainable transportation environments. Students tend to use a variety of modes of transport, including active modes, more often than other segments of the population [5]. In this sense, Balsas [3] stated that universities can act as laboratories for testing and implementing alternative transportation strategies to reduce infrastructure costs and minimise impacts on neighbouring areas.
Many students live near the campuses they attend and can use active modes of transportation. Schools are important travel-generating poles that cause traffic congestion on adjacent roads during peak student travel times [5]. If traffic congestion within the neighbourhood surrounding a university were reduced, there would be greater incentives for adopting active modes of transport [5].
Encouraging sustainable transport at universities can be viewed as a starting point for a change in society as a whole. Zhou [6] believes that by promoting sustainable development through the dissemination of knowledge and experience, universities can reshape the behaviour of their students and act as good examples for society as a whole.
The paper proceeds with a brief literature review, followed by a description of our methodological procedures. Model estimation results and discussion are then presented. Finally, the last section provides conclusions and recommendations.
In this study, we focused on the choice of active modes of transport. Thus, our literature review focused on the determinants that influence the choice to adopt walking or cycling. Several researchers have carried out studies on travel mode choice. Although such studies have different objectives and methodologies, they all investigate factors related to infrastructure, comfort, and safety of displacement. These factors are closely related to our study because they include elements that involve the promotion of sustainable mobility on university campuses.
The most-commonly investigated trip characteristics are travel distance and travel time [7]. These characteristics are highly correlated and often considered to be equivalent [7]. However, in cycling research, distance is the main factor in the decision to cycle, where longer distances are negatively associated with active mode usage [7], [8].
The use of a bicycle as a mode of transportation is also associated with the individual characteristics of users. Gender appears as a significant variable appears in many surveys. Stronegger et al. [9] concluded that men tend to use bicycles more often than women. Garrard [10] stated that this difference is more prominent in countries with low usage of bicycle lanes. Sousa [5] presented gender and age as variables that influence the use of bicycles and hypothesised that men and women may have different perceptions regarding the safety of cycling.
Income is often identified as a factor for active mode choice [7]. However, mixed results have been reported regarding positive or negative associations [7], [8]. According to Souza [5], in Brazil, income indicates whether or not a user can afford a vehicle, age limits the use of bicycles because cycling requires a certain physical capacity, and the activities performed by users can limit the use of bicycles because users may need to carry certain objects or be dressed in a manner that makes cycling difficult.
Bekkum et al. [11] analysed the perception of 18 potential barriers to cycling. Men and women agreed on three main barriers of danger on streets, climate, and lighting. However, women perceive other barriers as greater obstacles compared to men. For women, there is a greater concern regarding the physical exertion involved in cycling, terrain, and the need to wear casual clothing, which may be a result of various cultural factors. Delmelle and Delmelle [12] conducted a survey of university students and concluded that women are more likely to perceive topography as a barrier to active modes of transport compared to men. In another university study [13], it was indicated that the propensity to use the bike is higher for male users and older students.
In Brazil, students often begin their studies later in life after they are already married and have children. Many Brazilian students work and study simultaneously, so travel is often performed by including their workplaces along travel paths. According to [14], there are more female students enrolled at most campuses and night shifts have more students enrolled in undergraduate courses. Therefore, it is important to determine if these characteristics influence the choice of transport mode.
Professional activity is also an important factor. In Sousa [5], the authors argued that cycling requires appropriate athletic clothing that may be incompatible with certain professional settings. This problem is exacerbated by a lack of hygiene facilities upon arrival at work. Concerning working hours, Heinen et al. [8] suggested that having a part-time job is more positively associated with cycling compared to having a full-time job.
Regarding marital and family status, Heinen et al. [8] stated that having no children increases the probability of using cycling as a mode of transport. Nguyen-Phuoc et al. [15] have shown that students who live with their families tend to use motorized modes, while students who live on rent are more likely to walk or cycle to university. The authors justify this choice by the distance from rented student housing in order to reduce the time and cost of transportation for the student. For Whalen et al. [16] cycling can be the most attractive alternative for students not living with their families.
The choice of private or public schools may also play an important role in developing countries. Adom-Asamoah et al. [17] found that in Ghana, private schools rely on motorised transport modes much more than public schools.
Finally, road infrastructure is especially relevant to active modes of transport because users are more exposed to their surroundings compared to motorised vehicle users. The presence, density, and continuity of active mode infrastructure (e.g., bicycle paths) and lanes and sidewalks, is positively associated with active mode usage. Facilities, such as bicycle parking, are also relevant [7], [10]. Peer [13] concluded that factors such as having a proper bike, being safe from theft, segregated bicycle lanes, and a safe parking space, especially at the university, would attract more users to this mode of transportation, even for those who use the bicycle less.
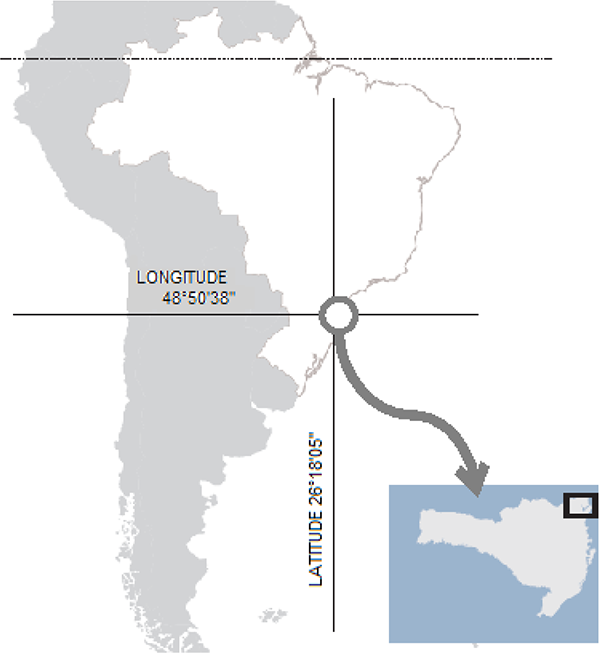
The case study of this work was conducted in the medium-sized city of Joinville in northern Santa Catarina (Figure 1), and applied at two universities, one private (A) and one public (B). University A has approximately 6,000 students and undergraduate programs in several fields (health, human and social sciences, design and architecture, computer science and engineering programs). University B has approximately 3,000 students in graduate and undergraduate engineering and teacher programs.
Location of Joinville Institute of Research and Planning for Sustainable Development of Joinville (IPPUJ) (2017) [18]
In this study, we use data obtained from a questionnaire designed for a broader research project. The two universities were selected as the questionnaire suggests that 59% of the city students were from these universities. This questionnaire helped collect information on students’ current mode of transport to-and-from the campus, including place of residence and socioeconomic data. The questionnaire also comprised questions that required students to rate the cycling and pedestrian infrastructure, asking the students the reasons of not choosing an active mode of transport.
After ethical clearance, the questionnaire was sent out to those on the mailing list of the universities during the second half of 2018. Only respondents currently living in Joinville were included in this study. After compensating for missing data, the final datasets included 284 respondents.
First exploratory analysis and bivariate associations with choice of mode (active or motorised) were tested using chi-square test for categorical variables and Wilcoxon test numerical variables (e.g., travel time and age) have a significant impact on the popularity of active transport modes. In this study, a Wilcoxon test was adopted because the available travel time and age data were not normally distributed. The variables significantly associated with the response variable (choice of transport mode) at level of 10% were included in our final model.
Binomial logistic regression was used to portray realistic responses to our questionnaire. Logistic regression is a predictive approach that is similar to linear regression. Using logistic regression, one can predict a dichotomous outcome. In our case, the dependent variable was (1) choosing an active mode of transportation to campus or (0) choosing any other mode of transportation [19].
Logistic formulas are stated in terms of the probability that Y = 1, which is referred to as π, where the probability that Y = 0 is 1 - π. The probability π can be computed using a regression equation [eq. (1)]. Therefore, if the regression equation is known, one can theoretically calculate the expected probability that Y = 1 for a given value of X [19]:
(1)
where β0 is the intercept and β1 the parameter for the explanatory variable X. An important interpretation of the logistic regression model uses the odds ratio. The odds ratio is equal to eβi [19]. For example, if β is 0.7, then the odds ratio is approximately 2.0. This means that the probability that Y = 1 doubles as the value of X increases by one unit. An odds ratio of 0.5 indicates that the probability that Y = 1 is reduced by half as the value of X increases by one unit. An odds ratio of 1.0 indicates that there is no association between X and Y, because the odds do not change as x changes [19].
Logistic regression can be used with more than one predictor [eq. (2)]. For example, multiple logistic regression can predict travel mode choice by considering both travel time and gender as explanatory variables:
(2)
Our estimation model uses maximum likelihood and model performance can be evaluated by considering four criteria: the final log-likelihood, adjusted rho-square, Bayesian information criterion, and Akaike Information Criterion (AIC). The goal is to maximise the former two criteria and minimise the latter two criteria.
For modelling, our dataset was split into two parts using repeated data splitting. A random portion of the sample (70%) was used for model training. The trained model was then applied to the remaining samples (30%) to assess its performance [20]. Repeated data splitting consists of repeating this process many times, where each iteration splits the original sample different. This procedure is more accurate than a simple single data split [21].
Regarding model quality, the Chi-Square statistic was used to determine if the model results were statistically significant. Additionally, the Receiver Operating Characteristic (ROC) curve was evaluated. An ROC curve represents the performance of logistic regression and visualises sensitivity and specificity as the output threshold moves over the range of all possible values. The sensitivity is the proportion of correctly classified positive observations (0), which represented passive modes in this study. Specificity is the proportion of correctly classified negative (1) observations, which represented active modes in this study. The area under the ROC curve (AUC) represents overall model performance. A greater AUC value, meaning a value closer to one, represents a better model [22].
To finish this step, a Hosmer-Lemeshow goodness-of-fit test was performed. The purpose of this test is to determine if a fitted model accurately describes observed outcomes. It can be concluded that a model fits accurately if the differences between observed and fitted values are small [23].
Descriptive statistics were used to represent the results of questions related to infrastructure and understand why students do not use active transport modes to travel to campus. All statistical analysis was performed using the R software [24], ‘caret’ package [25], and ROCR package [22].
Table 1 lists the characteristics of the students surveyed. The majority of students (62.7%) come from university A and are female (63.4%). Approximately 45% of students have a family income between three and five times the minimum wage. Finally, 85% of the students are unmarried and just over 50% work and study.
Characteristics of students in the dataset
| Frequency | Percentage [%] | ||
|---|---|---|---|
| University | A | 178 | 62.7 |
| B | 106 | 37.3 | |
| Gender | Male | 104 | 36.6 |
| Female | 180 | 63.4 | |
| Income | 0-2 | 74 | 26.1 |
| 3-5 | 130 | 45.8 | |
| 6-9 | 49 | 17.2 | |
| ≥ 10 | 31 | 10.9 | |
| Marital status | Unmarried | 241 | 84.6 |
| Married | 43 | 15.4 | |
| Program | Undergraduate | 256 | 90.1 |
| Graduate | 28 | 9.9 | |
| Employed | Yes | 160 | 56.3 |
| No | 124 | 43.7 |
The characteristics of the trips to campus are listed in Table 2. Most trips utilise motorised modes of transport (77.5%), with 25% utilising personal cars. A positive point is that 41.2% of trips are made using public transport (bus). The average travel time for active modes of transport is 19 min and that for motorised modes of transport is 38 min. It should be noted that with the average travel time for buses is approximately 50 minutes.
Characteristics of trips in the dataset
| Mode | Frequency | Percentage [%] | Travel time [min] Mean [s.d.] | |
|---|---|---|---|---|
| Active | Total | 64 | 22.5 | 19.84 (12.91) |
| Bicycle | 29 | 10.2 | 23.76 (12.15) | |
| On foot | 35 | 12.3 | 21.54 (12.78) | |
| Motorised | Total | 220 | 77.5 | 38.31 (24.85) |
| Car | 70 | 24.7 | 21.34 (9.64) | |
| Bus | 117 | 41.2 | 52.78 (25.21) | |
| Other | 33 | 11.6 | 20.91 (10.20) |
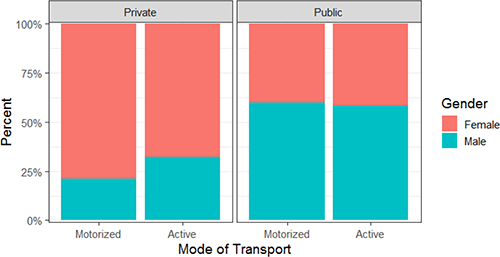
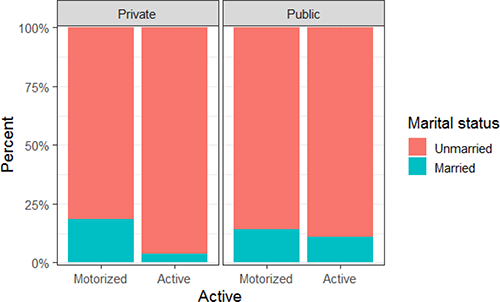
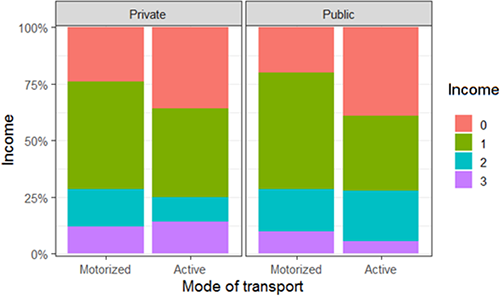
Bivariate analysis reveals that the following categorical variables are significant at the level of α = 10%: income (χ2 = 6.08, p-value = 0.10), gender (χ2 = 3.19, p-value = 0.08), category of university (χ2 = 11.63, p-value = 0.00), and marital status (χ2 = 1.76, p-value = 0.09). It is possible to visualise these associations using bar charts (Figures 2-4).
Comparative bar chart: modes of transport by university and gender
Comparative bar chart: modes of transport by university and marital status
Comparative bar chart: modes of transport by university and income
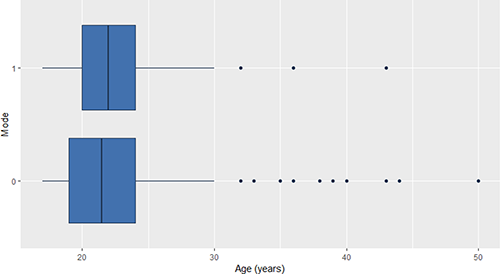
The ages of the students range from 18 to 50 years, but 75% of the students are less than 24 years of age (Figure 5). The mean age is approximately 22 years for both modes of transport and the standard deviations are 5.2 years and 4.3 years for motorised and active modes of transport, respectively. Unlike previous studies, we found that the age variable is not significant for predicting the mode of transport (Wilcoxon test p-value = 0.520). Therefore, this variable was not included in the final model.
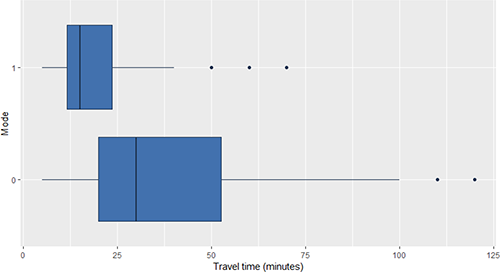
Regarding trips, the corresponding boxplots (Figure 6) reveal that active modes of transport are associated with shorter travel times (Wilcoxon test p-value < 0.001).
Our survey included both travel distance and travel time. According to Ton et al. [7], these two factors are highly correlated, meaning only one must be included in a predictive model. Regarding public transport, journey planners typically consider travel time, meaning it was expected that respondents would know the duration of a trip, but they may not have known the travel distance [7]. Therefore, in this study, travel time was selected over travel distance. The variables ‘work’ and ‘have children’ were excluded because they are strongly associated with the variables ‘category of university’ and ‘married’.
Boxplot of age versus transport mode: motorised (0) and active (1)
Boxplot of time travel versus transport mode: motorised (0) and active (1)
The logistic regression model was trained for the active transport choice (bicycle or foot travel) with motorised transport modes (car, bus, etc.) acting as the reference. Table 3 lists the estimated parameters, standard errors, p-values of corresponding coefficients, and odds ratios. The significant parameters were analysed based on the odds ratios to understand the determinants for the choice of active transport modes.
Binomial logistic model results for the associations between student, university, and trip characteristics in terms of choosing an active mode of transport
| Parameter | Coefficient | Standard error | p-value | Odds ratio | |
|---|---|---|---|---|---|
| Constant (β0) | 1.133 | 0.550 | 0.039 | ** | |
| Travel time (min) (β1) | -0.067 | 0.015 | 0.000 | *** | 0.935 |
| Gender (β2) | |||||
| Female (ref.) | |||||
| Male | -0.018 | 0.449 | 0.967 | 0.982 | |
| University (β3) | |||||
| A (ref.) | |||||
| B | 0.911 | 0.434 | 0.035 | ** | 2.488 |
| Marital status (β4) | |||||
| Unmarried (ref.) | |||||
| Married | -1.390 | 0.688 | 0.043 | ** | 0.415 |
| Income (β5) | |||||
| 0-2 (ref.) | |||||
| 3-5 | -1.251 | 0.487 | 0.010 | ** | 0.522 |
| 6-9 | -0.650 | 0.565 | 0.250 | 0.286 | |
| > 10 | -0.880 | 0.692 = 3 | 0.204 | 0.249 | |
Sample size: 284 AIC: 179.60 Log-likelihood: -81.80 Wald: χ2 53.96 Prob: > χ2 0.000*** |
|||||
* Coefficients are significant at a = 10% level
** Coefficients are significant at a = 5% level
*** Coefficients are significant at a = 1% level
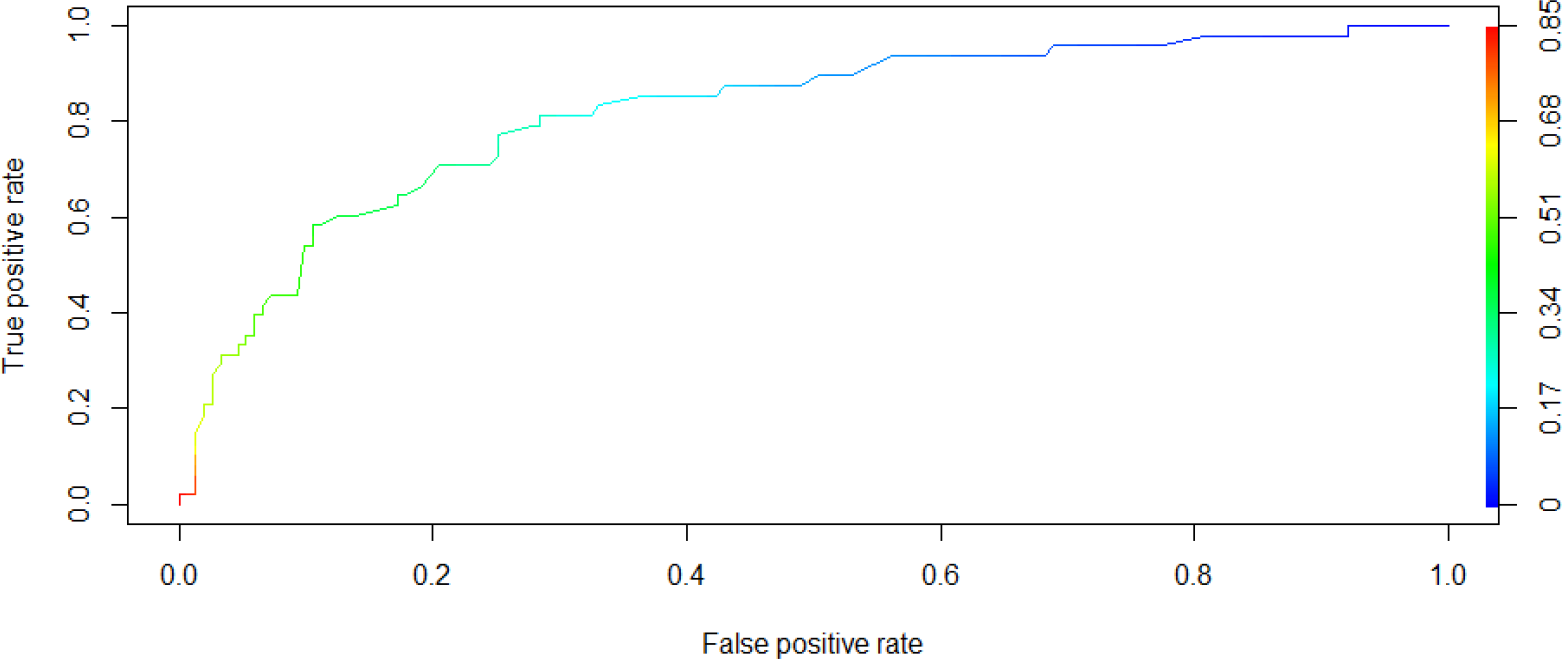
Regarding the quality of the model, the ROC test curve (Figure 7) indicates a good level of discrimination ability. The AUC is 0.8234 for the training data. This means that the model has an overall accuracy of 82.34%. Finally, the results of the goodness of fit Hosmer-Lemeshow test indicate that model fits the data closely (p-value = 0.120). For the validation data, the overall accuracy is 71.95%.
ROC curve of the proposed model
The alternative specific constant describes the preference of a student regarding active modes, where motorised modes are considered as the reference case. The constant is both positive and significative. This alternative (active mode) can be favoured by students in place of the reference case.
The results of the model imply that travel time, the category of the university (private or public), marital status and income are determinants for choosing actives modes of travel. Students who require longer travel times are more likely to choose other modes of transport, such as cars and buses. From the odds ratio column in Table 3, one can see that for every unit increase in travel time, the probability of using bicycles decreases by 6.50%.
The students of the public university (B) have a chance of choosing active modes of transport that is 2.45 greater compared to the students of the private university (A). This can be explained by the different characteristics of the universities. University A graduate programs are concentrated in the evening and many students require multiple trips because they work and study. These results partially agree with those presented in Heinen et al. [8], where the authors suggested that having a full-time job is negatively associated with active modes of transport. Married students are also associated with motorised mode selection because most married students have children. This result is consistent with those presented in Heinen et al. [8].
This study also agree with the results of Adom-Asamoah et al. [17], who revealed that students at private schools prefer to use motorised modes of transport. The relationship between income and active modes of transport is significant. However, there are various aspects to be analysed regarding the type of campus. Students who are already in the job market and have their own income may own their own car for locomotion. These students largely attend private universities. The greatest difference is visible between students with low incomes (up to two times minimum wage) and the subsequent category (between three and five times minimum wage). This salary category represents most workers in the city [18].
No differences were observed regarding the gender of students, which is inconsistent with the literature. This finding can be explained by the environment in which the target universities are located. Because students at these universities have a strong sense of belonging with regard to the university campus as a whole, they consider it safe to ride bicycles from the university to their homes when their destinations are near the campus boundaries. Additionally, the terrain in the target region is mild, which reduces the topography barrier that was stated to be a representative factor for women in the literature. Additionally, the universities tend to be relaxed environments regarding dress standards, meaning women are not limited by cultural stereotypes. These results agree with those presented in Ton et al. [7] and Swiers et al. [26], where gender was shown not relevant.
As mentioned previously, most active transport mode choice studies have investigated the impact of travel distance on active mode choice, while few studies have investigated travel time [7]. Generally, previous studies have shown negative associations between travel time and active mode choice [7], [8], similar to this study. In other words, the longer the trip, the more likely that motorised modes of transport are chosen [7]. However, Heinen et al. [8] mentioned that travel times should always be considered in relation to other transport modes. The share of active modes decreases with higher travel times and the share of motorised modes increases [7].
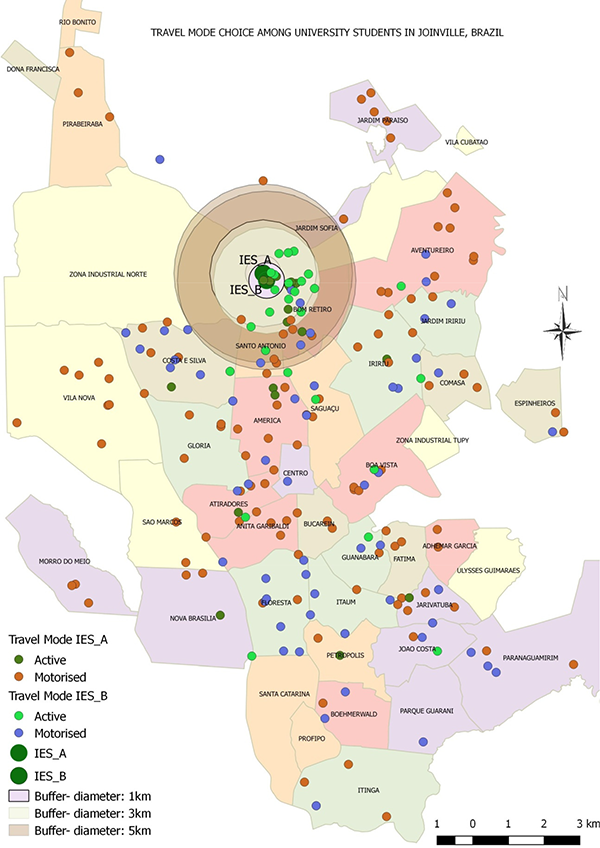
From Figure 8, one can see that students residing at a distance of up to one kilometre tend to use active modes of transport. At distances of three to five kilometres, many students in the sample begin to use motorised modes of transport. Among students living in more distant neighbourhoods beyond a five-kilometre circle, motorised modes of transport are dominant.
Geographic localization of respondents’ origin and choice of mode of transport
Further research is required to encourage transport mode switching. It would be crucial to determine which changes would encourage students living in nearby areas to opt for active transport modes. For students living in distant neighbourhoods, it is necessary to think about alternatives to reduce the use of the private vehicles. In this sense, the continuity of work suggests the application of models of stated preference.
The students that drive cars (70 students) to the universities were asked about their main reasons for not using active modes of transport. Regarding the infrastructure for bicycles, the main responses were travel time, traffic danger, absence of an exclusive bicycle path, and very large travel distance. The students also expressed their desire to go cycling to college (49%). Regarding walking, 52% of students consider it dangerous to walk to campus. Another question relating to environmental factors, such as understanding that cars contribute to pollution, concern regarding the pollution generated by vehicles, and perceptions of congestion, indicated that most drivers are aware of the impact of personal vehicles on society. However, 45% responded that their car is absolutely necessary for their routine and 55% responded that they like to drive.
Regarding the reasons that lead students to avoid cycling, the previous results reveal several interesting factors, including climatic conditions. The city of Joinville has a subtropical climate and experiences heavy rain. However, according to Pucher and Buehler [27], climate is not necessarily a serious obstacle to cycling. Portland and Vancouver, which have rainy climates, have exhibited high rates of cycling. However, these cities have implemented coordinated measures and policies to encourage cycling and make it safer. These success stories demonstrate how public policies play an important role in determining the number of bike riders.
With respect to insecurity on roads, the resolution of this problem depends heavily on local authorities. Joinville has a reasonable cycle structure compared to other cities in the country in terms of the number and length of cycling paths, but it is necessary to assess their overall quality. As stated by Pucher and Buehler [27], the role of public policies is crucial in encouraging bicycle riding. These policies should include specific appropriate infrastructure measures and incentive programs.
Therefore, our survey results indicate that it is necessary to invest in the maintenance and improvement of bicycle paths to maintain the use of bicycles by students living in neighbourhoods near campus and attract those living far from campus. The same can be said for sidewalks.
One positive result of our survey is that approximately 41% of students use public transportation (buses) for commuting. It is important to the city that this proportion does not decline. It is desirable to encourage students living far from campus to use public transportation in place of personal vehicles.
Based on these findings, it is necessary to emphasise that all measures aimed at discouraging the use of cars, and encouraging non-motorised transport modes and the use of public transport, should be applied and accompanied by a permanent group responsible for campus planning. Balsas [3] reaffirmed that universities have a responsibility to set a good example and encourage the rest of society to adopt more rational and sustainable urban development strategies.
Discrete choice models are widely used to analyse the influence of variables on the choice of transport modes. In this study, we evaluated the significance of several variables and developed a model to represent the reality of commuting to a university.
The model revealed that travel time, travel distance, income, and the category of university are factors associated with the choice of bicycles as a mode of transport. The closer to the university campus a student lives, the greater the chances of that student choosing to use actives modes of transport. Improving the infrastructure of cycling routes and sidewalks can contribute to increasing the proportion of students using active modes of transport, even among students who live relatively far from campus.
- , , MS.c. Thesis, 2015
- , Characterization and Analysis of Transportation Demand in a University Campus: The Case of UFRJ (in Portuguese), MS.c. Thesis, 2016
- ,
Sustainable Transportation Planning on College Campuses ,Transport Policy , Vol. 10 (1),pp 35-49 , 2003, https://doi.org/https://doi.org/10.1016/S0967-070X(02)00028-8 - ,
Enjoyment of Commute: A Comparison of Different Transportation Modes ,Transportation Research Part A: Policy and Practice , Vol. 44 (7),pp 537-549 , 2010, https://doi.org/https://doi.org/10.1016/j.tra.2010.04.003 - , Analysis of Factors that Influence the Use of the Bicycle for Cycling Infrastructure Planning (in Portuguese, Ph.D. Thesis, 2012
- ,
Sustainable Commute in a Car-Dominant City: Factors Affecting Alternative Mode Choice Among University Students ,Transportation Research Part A: Policy and Practice , Vol. 46 (7),pp 1013-1029 , 2012, https://doi.org/https://doi.org/10.1016/j.tra.2012.04.001 - ,
Cycling or Walking? Determinants of Mode Choice in the Netherlands ,Transportation Research Part A: Policy and Practice , Vol. 123 ,pp 7-23 , 2019, https://doi.org/https://doi.org/10.1016/j.tra.2018.08.023 - ,
Commuting by Bicycle: An Overview of the Literature ,Transport Reviews , Vol. 30 (1),pp 59-96 , 2010, https://doi.org/https://doi.org/10.1080/01441640903187001 - ,
Perceived Characteristics of the Neighborhood and its Association with Physical Activity Behavior and Selfrated Health ,Health & Place , Vol. 16 (4),pp 736-743 , 2010, https://doi.org/https://doi.org/10.1016/j.healthplace.2010.03.005 - ,
Healthy Revolutions: Promoting Cycling Among Women ,Health Promotion Journal of Australia , Vol. 14 (3),pp 213-215 , 2003, https://doi.org/https://doi.org/10.1071/HE03213 - ,
Cycle Commuting and Perceptions of Barriers: Stages of Change, Gender and Occupation ,Health Education , Vol. 111 (6),pp 476-497 , 2011, https://doi.org/https://doi.org/10.1108/09654281111180472 - ,
Exploring Spatio-Temporal Commuting Patterns in a University Environment ,Transport Policy , Vol. 21 ,pp 1-9 , 2012, https://doi.org/https://doi.org/10.1016/j.tranpol.2011.12.007 - ,
To Bike or Not to Bike? – Evidence from a University Relocation ,Transportation Research Part D: Transport and Environment , Vol. 70 ,pp 49-69 , 2019, https://doi.org/https://doi.org/10.1016/j.trd.2019.03.003 - , 2017, http://download.inep.gov.br/educacao_superior/censo_superior/documentos/2018/censo_da_educacao_superior_2017-notas_estatisticas2.pdf
- ,
Mode Choice Among University Students to School in Danang, Vietnam ,Travel Behaviour and Society , Vol. 13 ,pp 1-10 , 2018, https://doi.org/https://doi.org/10.1016/j.tbs.2018.05.003 - ,
Mode Choice of University Students Commuting to School and the Role of Active Travel ,Journal of Transport Geography , Vol. 31 ,pp 132-142 , 2013, https://doi.org/https://doi.org/10.1016/j.jtrangeo.2013.06.008 - ,
Factors Influencing School Travel Mode Choice in Kumasi, Ghana ,International Journal of Development and Sustainability , Vol. 4 (1),pp 1-17 , 2015 - , , Joinville City in Data (in Portuguese), 2017
- , , An Introduction to Categorical Data Analysis, 2007
- ,
Multivariable Prognostic Models: Issues in Developing Models, Evaluating Assumptions and Adequacy, and Measuring and Reducing Errors ,Statistics in Medicine , Vol. 15 (4),pp 361-387 , 1996, https://doi.org/https://doi.org/10.1002/(SICI)1097-0258(19960229)15:4<361::AID-SIM168>3.0.CO;2-4 - ,
Model Performance Analysis and Model Validation in Logistic Regression ,Statistica , Vol. 63 (2),pp 375-396 , 2007, https://doi.org/https://doi.org/10.6092/issn.1973-2201/358 - ,
ROCR: Visualizing Classifier Performance in R ,Bioinformatics , Vol. 21 (20),pp 78-81 , 2005, https://doi.org/https://doi.org/10.1093/bioinformatics/bti623 - ,
Goodness-Of-Fit Test for a Logistic Regression Model Fitted Using Survey Sample Data ,The Stata Journal , Vol. 6 (1),pp 97-105 , 2006, https://doi.org/https://doi.org/10.1177/1536867X0600600106 - , 2018, https://www.R-project.org
- , 2019, https://CRAN.R-project.org/package=caret
- ,
A Cross Sectional Survey of Attitudes, Behaviours, Barriers and Motivators to Cycling in University Students ,Journal of Transport & Health , Vol. 6 ,pp 379-385 , 2017, https://doi.org/https://doi.org/10.1016/j.jth.2017.07.005 - ,
Analysis of Bicycling Trends and Policies in Large North American Cities: Lessons for New York, Final Report , 2011