


Urban areas are generally characterized by dark surfaces; asphalt coated roads, excess storage of solar radiation, minimal green spaces and cool sinks, and increased human activities as compared to rural areas, and an increase in the formation of ozone with associated health implications [1]. These factors has effects on climate, energy consumption and habitability in urban areas and cities, attribute to the rise in temperature of urban areas and as indoor microclimate of buildings are primarily dependent on the external temperature and weather conditions of the surrounding environment, the progressive increase in ambient temperature raises cooling demands within buildings [2].
Studies by Humphreys show a strong linear relationship between the people’s comfort temperature in free-running buildings and the average outdoor temperature. This proposes that there is a relationship between what people expect and know about indoor climate resulting the context of outdoor conditions [3]. In the climate change context, this means that the gap becomes more significant for people in sealed buildings as their knowledge of outdoor conditions becomes further disconnected. In the design of passive, low-energy buildings we can draw upon more accurate modeling of predicted comfort when the relationship of indoor climate is linked to outdoor conditions [4]. The warmer climate a building is situated in will affect the indoor temperature of building. When the outdoor air temperature increases, building will experience indoor discomfort. High temperatures significantly influences electricity consumption in infrastructure, increasing the cumulative power demand [5]. Heat gain is a major parameter that affects the consumption of energy [6]. Lower heat gains will reduce cooling [1]. Also, approximately 40 million metric tons of carbon emission is attributed to energy used in air conditioning buildings in cities classified as heat-islands. Active cooling such as Heating Ventilation and Air Conditioning (HVAC) systems for mitigating the impacts of Urban Heat Island (UHI) are mostly energy intensive [7]. An increase in active cooling will result in an increase of energy needed, which will eventually cause an increment in energy bills [8].
Passive cooling design works to reduce the heating of the building, which in turn increases the occupant comfort, health and productivity of building users while reducing energy usage in buildings by utilizes its environment by factoring the local climate characteristics such as wind direction, solar radiation, and relative humidity into fundamental design and operation of the building to create energy conservative buildings [9]. In other to reduce the heat gain in indoor spaces, passive cooling design considers the selection of building materials, the orientation of the building, the ventilation and natural light designs, the installation of solar powered systems, the integration of flora, and green systems to house deigns and with the advancement in science, more passive cooling strategies are gradually being discovered [10]. In a high temperature regions the heat gain from roofs is significantly higher than the walls combined, and the right passive cooling measure can improve the heat reflective performance of the roof and even serve as a heat sink withdrawing the heat from the building envelope [11]. Cool roofs built from materials with high solar reflectance or albedo and high thermal emittance may attain temperatures significantly lower than their low-reflectance counterparts. If this technology is not used, high roof temperatures will accelerate the deterioration of roof materials. In buildings with poor roof insulation, they will also contribute to an increased demand for cooling energy and a decrease in thermal comfort on upper floors. [12] large surfaces with vegetation, they contribute to the improvement of thermal performance of building. [13]. According to Nahar, 50% of the heat load in the building is from the roof [14]. Also, urban surfaces light in colour tend to reflect incoming light back into space and in so doing tend to have cooler surfaces with less need for air conditioning [15]. In a study by [16] hows that the surface temperature of non-insulated building without green roof are vary from 42 to 48 °C while the surface temperatures of the green roof upon non-insulated building are lower and ranging from 28 to 40 °C.
In a study on cool paints, Costanzo discussed that cool paints applied on roofs significantly increased the thermal comfort of occupants, as a reduction in the Intensity of Thermal Discomfort (ITD) of up to 63% was recorded in his study, and further stated that the application of cool paints caused a noticeable decrease in the energy of the building [17]. In a study by Bellia on shading devices concluded that an shading system allows up to 14% energy saving for an uninsulated building and a 24% saving for a highly insulated building in warm climates [18]. New passive cooling technologies are being discovered everyday but undeniably, the internal thermal comfort of buildings cannot be attained utilizing only one passive cooling method. Thus, the need to combination of two or more strategies is only a matter of time [19]. This study seeks to overcome the greatest hindrance to the application of passive cooling strategies, that is spatial restriction; implementing passive cooling methods wherever they are required in buildings. Therefore, overcoming the reluctance to introduce passive cooling methods into new schemes is a big challenge. The three passive cooling methods incorporated in this study where carefully selected after extensive considerations of various factors such as; the climate and geography of the region, typical buildings materials and designs prevalent in the area, the cost of the installation in new constructions and existing buildings, financial capabilities of residents, and the sustainability of the strategies.
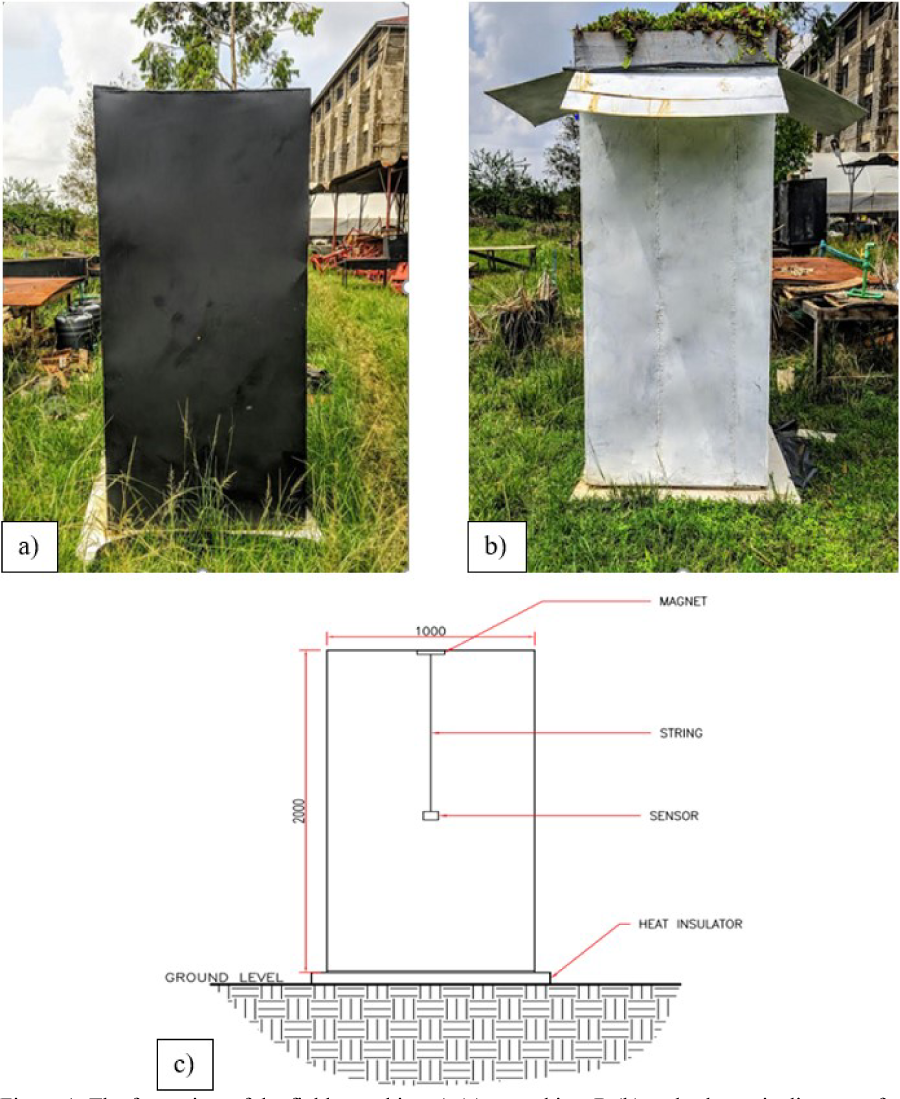
Two boxes were designed, both test objects had the same physical dimensions and measure of 1 m by 1 m at the base with a 2 m height respectively. Test object A served as the test experiment with three passive cooling technologies incorporated in its design, The walls of Test object A were painted with Redusol, a near infrared reflecting paint, the mixing ratio of near infrared reflecting paint (NIR) to water was 1:2. [20]. The top of the roof is provided with a vegetative cover, (Gulma, 2014) and the roof is fitted with eaves inclined at 30 degrees which serve as a form of solar shading [22]. The second boxes, Test object B was the with no passive cooling technology, and order to consider a worst-case scenario, the test object B was painted black which is one the highest heat absorbing colour used in construction.
To create boundary conditions, heat transfer between the test objects and the earth was restricted using Polystyrene of 75 mm thickness underneath the base of each model. Both models were airtight and without any form of ventilation.
The aims of the study are:
To develop and predict a computer model predicting the effect of passive cooling on cooling loads of urban buildings;
To validate the predicted temperatures of the computer model using experimental data.
Nowadays, building cooling loads can be predicted using specialized software that predicts the behaviour of the energy system according to various parameters and conditions such as weather, time of the year and geographical location. In this study the Design Builder V.6, EnergyPlus, and Element software are employed to design and predict the indoor microclimatic conditions. Design Builder is used to define the characteristics of the space, materials and dimensions, thermal zones, activity, weather and every other requirement for the study. Element is used to create the weather data of the experiment location, and EnergyPlus, a simulation engine in the Design Builder software calculates the thermal and energy performance. The computer model is further validated through field experiments that replicate the computer model.
The thermal comfort, energy consumption and overall sustainability of a building is contingent on the indoor microclimate of the building. The indoor thermal characteristics of a building depends on heat transfer in the building.
Heat transfer between a building and its surrounding environment provides a foundation for thermal modelling and occurs in primarily three ways, conduction, convection and radiation.
Conduction occurs when heat transfers from one part of a body at a higher temperature to another at a lower temperature. [23] Conduction is calculated by Fourier’s law which states that heat flux is proportional to the temperature gradient in the direction of the outward normal:
(1)
where are: Qcd - quantity of heat flow/heat flux due to conduction in W; k - thermal conductivity of the material in W/m/K; A - surface area in m2; Δ T-temperature difference of the two media in K; D-thickness of the material in m.
Radiation is heat transfer mechanism that does not require any medium of propagation. In this study, we consider thermal radiation is as it is required to calculate solar gains and heat
Input into buildings from the sun. According to [24], the radiation exchange between two large parallel plane surfaces (of equal area A) at uniform temperatures T1 and T2 respectively, can be written as:
(2)
(3)
where are: Q12 – net radiative exchange between surfaces in W; σ- Stefan-Boltzmann constant (5.67×10⁻⁸ W/m2K4); A- area of surface in m2; T1 - temperature of surface 1 in K; T2 - temperature of surface 2 in K; ε1 and ε2 - emissivities of surfaces 1 and 2 respectively.
Heat transfer by convection, takes place at the surfaces of walls, floors and roofs. According to Newton’s law, convection can be given as:
(4)
where are: Qcv - convective heat transfer (heat flux due to convection) in W and hc - heat transfer coefficient in W/m2K.
The energy balance in the building is established which is the summation all the heat gains and losses associated with the building through the convection radiation and conduction can be expressed as:
Cooling Load = ∑Internal Gains + ∑Solar gains + ∑Lightening gains - ∑Fabric losses - ∑Ventilation losses
According to [21] in his study on creating a thermal model called GRUBCLIM, explained that heat is transmitted through heat conduction through materials and through radiation and convection from surfaces and mediums. These can be categorized into the following: Q̇W - energy loss through the walls in W; Q̇F - energy loss into the in W; Q̇G - energy loss hrough the glazing (window) in W; Q̇R - energy loss through the roof in W, and Q̇D - energy loss through the door in W. Therefore, the energy balance for the urban building can be generalized as:
(5)
For this study, ventilation was restricted and no windows were created in order to establish boundary conditions. Therefore, energy balance for this model can be expressed as:
(6)
The heat gain/loss primarily occurs through conduction as energy is transferred from the more energetic particles of a substance to adjacent particles that are less energetic due to interactions between particles [21]. Conduction is quantified by Fourier’s law that says heat flux is proportional to the temperature gradient in the direction of the outward normal.
Considering the transfer through, the basic equation of heat conduction is given by equation (1).
For this study, EnergyPlus, a simulated engine designed to work seamlessly in the Design Builder performs all required analysis pertaining to the building energy model (BEM) and generates the results within the Design building interface. Design Builder offers a range of functions including energy designs in buildings, ventilation, carbon and comfort measurement and regulation in buildings. It compares alternative building designs by using function and performance-based method of assessment in a speedy and economic style. The design builder interface is divided into nine sections, namely; layout, activity, construction, opening, lightening, HVAC, generation, output. In order to restrict boundary conditions for this computer model only the layout, construction was mostly utilized. No opening was constructed in the geometry of the boxes and the activity within the model was set to zero which implicates that there was no human interaction within the boxes during the simulation process. Lightening, HVAC systems, and power generations was disabled in each individual tab for the test objects.
The outdoor temperature and relative humidity readings of Jomo Kenyatta University of Agriculture and Technology (JKUAT), the location of the experiment were taken between May 7, 2019 to May 28, 2019, and utilizing Elements, a software by Big ladder used for editing and creating weather files, and obtaining secondary data of other weather parameters from the EnergyPlus website, a weather file of the test location was created and stored in the design builder software.
To predict the behaviour of the boxes, design began from the layout interface where the design conditions and zones were set, and the weather data created with Elements was selected for the as the site metrological conditions. The 3D physical geometry and dimensions of the boxes is specified in the layout section using component blocks and zones. In the construction tab of design builder, most widely used construction materials are available for selection, and for this study, the material, characteristics, and thickness, of each component of the boxes is specified also. The designed material characteristics and their corresponding U-values are provided in Table 1.
Attributes and thermal properties of the computer model
Box Type |
Components |
Composite Materials for Boxes |
Thickness, m |
U, W/m2K |
|---|---|---|---|---|
Test object A (Passively cooled) |
Wall |
Mild steel (Grade 18) |
0.005 |
5.552 |
Wall coating |
Shading agent |
0.002 |
|
|
Roof |
Mild steel (Grade 18) |
0.005 |
3.067 |
|
Roof coating |
Shading agent |
0.002 |
|
|
Green roof |
Vegetation (mesenbryan themum specie) |
0.02 |
|
|
Water proof |
Polyethylene (High density) |
0.001 |
|
|
Floor |
Mild steel (Grade 18) |
0.005 |
1.465 |
|
Floor coating |
Shading agent |
0.002 |
|
|
Ground insulation |
Polystyrene |
0.075 |
|
|
Test object B (No cooling) |
Wall |
Mild steel (Grade 18) |
0.005 |
5.744 |
Wall coating |
Dark coloured paint |
0.002 |
|
|
Roof |
Mild steel (Grade 18) |
0.005 |
5.744 |
|
Roof coating |
Dark coloured paint |
0.002 |
|
|
Floor |
Mild steel (Grade 18) |
0.005 |
1.556 |
|
Floor coating |
Shading agent |
0.002 |
|
|
Ground insulation |
Polystyrene |
0.075 |
|
After specifying the conditions required to run the simulation including time step for simulation, the EnergyPlus simulation engine integrated into the Design builder software was run. In EnergyPlus, the heat balance model considers a scenario where the room as a uniform temperature and the air is distributed evenly. throughout and also operates on the assumptions that room surfaces have a uniform surface temperature and short and long-wave radiation, internal heat conduction, and diffuse radiating and reflecting surfaces [25]. In the Design Builder modelling environment, green roofs are calculated using the simple moisture calculation method. The principle is founded on a constant moisture osmosis into the soil. For every soil property updated, it analyses the more saturated layer and transfers moisture to the less saturated layer and distributes the moisture at a steady rate.
This study focuses mostly on the comfort level data, which includes, the envelope’s internal temperature, the outside dry-bulb temperature, and relative humidity. The comfort data is calculated for blocks using floor area weighted averages of the zones in the block. For example block average air temperature:
(7)
where are: An - floor area of zone nand Taz,n - the air temperature of zone n.
Preference for comfort temperature data was ticked while specifying the computer model parameters.
The predicted result is conferred in the results and discussions section.
To validate the predicted thermal behaviour of the boxes developed in design Builder, two exact replicas of the boxes designed in Design Builder were fabricated. The boxes measured 1m by 1m by 2m in length, width and height respectively.The experiment was carried out in Jomo Kenyatta University of Agriculture and Technology, Juja campus, Kenya, an urban area, characterized by a dense population of staff and students, with paved areas, concrete buildings and high vehicular activities. Juja is located in Kiambu county, Central Kenya, the highlands characterized by altitudes between 1,400 m and 1,800 m above the mean sea level. The county is situated between latitude 0°75' and 1°20' south of the equator and longitudes 36°54' and 36°85' east. It experiences bimodal rainfall from March to May and in October and November with annual rainfall above 1,500 mm. [26]. The test objects are fabricated with mild steel sheets, and are located in an open field away from existing buildings that could cast a shadow on or shade them.
The temperature of the indoor space was recorded using a temperature and relative humidity sensor, the HOBO MX1101 sensors. The Onset’s HOBO MX1101 data logger is powered by two AAA 1.5 V alkaline batteries, user replaceable battery, and measures and transmits temperature and relative humidity data wirelessly to mobile devices via Bluetooth Low Energy (BLE) technology. The self-contained wireless data logger, which works with Onset’s free HOBOmobile app for logger setup and data management, enables you to access data anytime from mobile device for iOS or Android over a 100-foot range, and it requires no dedicated equipment beyond a mobile device for configuring the logger or reading out data. The sensors was suspended within the test objects by a string and magnet attached to the inner surface of the boxes at the top. This was done to ensure the uniform temperature within the test objects were recorded. The outdoor temperature and relative humidity were measured with a temperature and relative humidity sensor, the HOBO MX2302 Affixed to pole 5 meters away from the experiment setup with other weather data. Each test object had a single HOBO MX1101 sensor affixed to its roof by a string, and a single HOBO MX2302 was used to collect external temperature and relative humidity data. The Onset MX2302A HOBO Weatherproof External Temperature and Relative Humidity (RH) Data Logger has external temperature and relative humidity sensors. Leveraging Bluetooth Low Energy, the logger enables easy, fast set up and data download directly from your mobile device, and provides high accuracy measurements in harsh outdoor environments.HOBO sensors have been used in predicting the envelope performance in various studies (Gulma, 2014). All measured data was saved in the logger, and once within range of the configured smart phone, uploaded the data into the smart phone. The sensors implemented measure temperature of between -20 to 70 °C accurately to +/-0.21 °C from 0 to 50 °C. The loggers have a radio power of 1mW, a logging rate of 1 second to 18 hours, and a time accuracy of ±1 minute per month at 25 °C. Measurements were taken every 30 minutes. The experimental set-up is shown in Figure 1 below.
The front view of the field test object A (a), test object B (b) and schematic diagram of experimental setup (c)
Temperatures inside the test objects were recorded throughout May, 2019. The computer model was validated using data measured from the experimental set-up with exact dimensions and specifications as used in the computer model. The validated data was recorded between 8 May and 28 May, 2019.
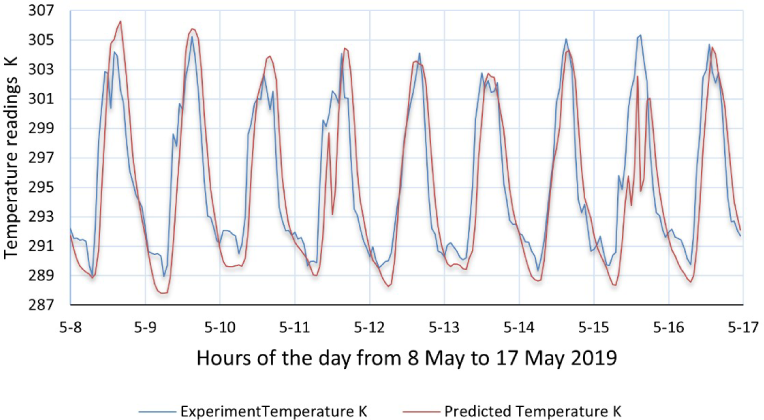
Variations in predicted indoor temperature and the recorded temperatures in the field experiment are shown in Figure 2. Figure 2 shows a generally favourable correspondence between the recorded and predicted values. The graph has a correlation coefficient of 0.85. The peak temperature recorded was 305.15 K compared to the predicted indoor temperature with its peak temperature at 306.1K. Also, coldest temperature value recorded was 288.11K as compared to a 287.12 K temperature value of the predicted indoor temperature.
A two-sample z-test was calculated to establish the relationship between both set of values. The test solved a p-value of 0.1952 against the significance level of 5%. There is a difference between both set of values as shown in the table 2 below.
z-test between predicted temperatures and the recorded temperatures.
|
Variable 1 |
Variable 2 |
|
Variable 3 |
Variable 4 |
|---|---|---|---|---|---|
Mean |
22.28261 |
21.85253 |
Mean |
21.42245 |
20.99237 |
Known Variance |
23.99462 |
30.17643 |
Known Variance |
36.35824 |
42.54005 |
Observations |
216 |
216 |
Observations |
216 |
216 |
Hypothesized Mean Difference |
0 |
|
Hypothesized Mean Difference |
0 |
|
Z |
0.858797 |
|
Z |
0.858797 |
|
P(Z<=z) one-tail |
0.195226 |
|
P(Z<=z) one-tail |
0.195226 |
|
z Critical one-tail |
1.644854 |
|
z Critical one-tail |
1.644854 |
|
P(Z<=z) two-tail |
0.390453 |
|
P(Z<=z) two-tail |
0.390453 |
|
z Critical two-tail |
1.959964 |
|
z Critical two-tail |
1.959964 |
|
Graph showing the predicted air temperature from the Design Builder software, the recorded temperature
The results depicted Figure 3 shows the Comparison of the ambient temperature and indoor air temperature in test object A incorporated with passive cooling and test object B without any modification over the 20 days experiment period. The amount of temperature reduction achieved through the combination of three passive cooling methods showed a 14% reduction in temperature with a mean temperature difference of 277.03 K. The highest difference measured during the day was 290.15 K at 3.00 pm on 21st May, 2019. The significant difference in indoor temperature readings in test object A (passive cooling) and test object B represents a potential for reducing the operating time of air conditioners for cooling purposes indoors. Less cooling demand means a shorter operating time to bring temperatures down to acceptable room temperature of 297.15 K, and less energy consumed. Other important temperature values are displayed in Table 2.
Comparison of the external ambient indoor air temperatures in Test object A (passive cooling) and Test object B
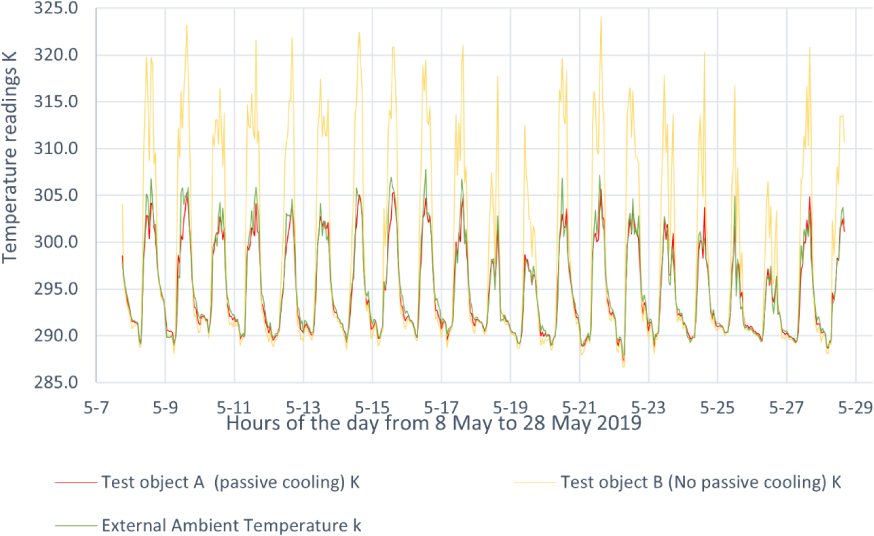
This result shows passive cooling effectively provides a reduction in thermal gains and less erratic temperature fluctuations. This can be attributed to; reduced heat gain by the green roof and walls coated with cool paints compared to bare roof and walls due to incident radiations hindered by the vegetation, soil mass, and incident radiations reflected outwards by the cool paint due to its low solar absorptance. Reduction in internal temperature can also be associated with the evaporative cooling due to irrigation and the increase in heat resistivity caused by lower thermal conductivity in the plants in comparison to the bare metal substituting for an insulation to solar gains by the roof due to the watering of the plants and heat resistance caused by the low thermal conductivity of the plants in comparison to bare metal acting as heat insulators to the heat gain by the roof. In addition, increase in thermal insulation due to the green roof indirectly reduces the energy consumed in heating as heat loss will be reduced too. Moreover, in the test objects, there was no provision for ventilation systems, thus the internal temperature was more stable and less heat was lost.
Notable temperature values in field experiment Test object A (passive cooling) and Test object B, and external ambient temperatures and in the computer model
Period |
Test object A(passive cooling) K |
Test object B (No passive cooling) K |
Ambient Outdoor Conditions K |
Predicted temperature Values K |
|---|---|---|---|---|
Peak Temperature |
305.00 |
321.79 |
307.77 |
306.1 |
Lowest Temperature |
288.11 |
287.27 |
287.9 |
287.12 |
Mean night time temperature |
291.85 |
291.79 |
291.92 |
292.75 |
Mean daytime Temperature |
297.88 |
306.31 |
298.53 |
297.65 |
Standard deviation |
4.6 |
10.1 |
4.9 |
5.01 |
Standard error |
0.2 |
0.5 |
0.2 |
0.36 |
In this paper, the effect of passive cooling technologies on indoor thermal environment is studied. A test objects was erected in Kiambu, Kenya to observe real-time changes in indoor microclimates when passive cooling is incorporated.
The outcome of the recorded experimental values and predicted values were analysed of the predicted indoor air temperature were compared with the recorded values of test object A. A correlation value of 0.85 was calculated between the recorded experimental values and the predicted values.
An average of 294.65 K and 298.55 K was measured in test object A (passive cooling) and test object B respectively. There was a maximum temperature difference of 277.03 K between test object A (passive cooling) and test object B. The average mean temperature difference between. The lower temperature value existing in test object A depicts the effect of the passive cooling in heat insulation which subsequently reduces the cooling load requirement in model. Moving forward, incorporating ventilation and better judgment in material selection in order to lower the U-values in building components could improve the effect of the passive cooling methods.
The applications of passive cooling measures such as green roofs, shading and cool paints are recommended in sub-Saharan regions. The use of passive cooling technique will be pivotal in creating pleasant indoor environment and reduce dependency on air conditioners and other mechanical cooling systems and an overall reduction in energy consumption.
The first author thanks the Civil and Environmental Engineering Department, Jomo Kenyatta University of Agriculture and Technology for providing instrumentation and technical support staff. Special thanks to the African Union for funding the research and for providing a scholarship in pursuit of a Master’s degree.
- ,
London’s urban heat island: Impact on current and future energy consumption in office buildings ,Energy Build. , Vol. 47 ,pp 302–311 , 2012, https://doi.org/https://doi.org/10.1016/j.enbuild.2011.12.019 - ,
Energy Saving Potentials and Air Quality Benefits of Urban Heat Island Mitigation ,Sol. Energy , Vol. LBNL-5 ,pp 1–19 , 2005 - ,
Adaptive thermal comfort and sustainable thermal standards for buildings , Vol. 34 ,pp 563–572 , 2002, https://doi.org/https://doi.org/10.1016/S0378-7788(02)00006-3 - ,
Addressing climate change in comfort standards ,Build. Environ. , Vol. 45 (1),pp 18–22 , 2010, https://doi.org/https://doi.org/10.1016/j.buildenv.2009.02.005 - ,
On the impact of urban heat island and global warming on the power demand and electricity consumption of buildings—A review ,Energy Build. , Vol. 98 ,pp 119–124 , 2015, https://doi.org/https://doi.org/10.1016/j.enbuild.2014.09.052 - ,
Influence of urban geometry on outdoor thermal comfort in a hot dry climate: A study in Fez, Morocco ,Build. Environ. , Vol. 41 (10),pp 1326–1338 , 2006, https://doi.org/https://doi.org/10.1016/j.buildenv.2005.05.022 - ,
Modelling and simulation of the effects of passive cooling technologies on energy savings for building systems in subtropical climate ,Hte’07 Proc. 5th Iasme / Wseas Int. Conf. Heat Transf. Therm. Eng. Environ. ,pp 72–77 , 2007, no. February 2015 - ,
An Overview of Passive Cooling Techniques in Buildings: Design Concepts and Architectural Interventions ,Civ. Eng. Archit. , Vol. 55 (1),pp 84–97 , 2012 - ,
Using passive cooling strategies to improve thermal performance and reduce energy consumption of residential buildings in U.A.E. buildings ,Front. Archit. Res. , Vol. 3 (2),pp 154–165 , 2014, https://doi.org/https://doi.org/10.1016/j.foar.2014.01.002 - ,
Application of Passive Cooling Techniques in Residential Buildings: A Case Study of Northern Nigeria ,Int. J. Eng. Res. Appl. , Vol. 07 (01),pp 24–30 , 2017, https://doi.org/https://doi.org/10.9790/9622-0701012430 - ,
Effect of Roof Pond on the Energy and Exergy Performance of a Single Space Building ,J. Therm. Eng. , Vol. 3 (3),pp 1275–1275 , 2017, https://doi.org/https://doi.org/10.18186/journal-of-thermal-engineering.323394 - ,
Effects of climate change on the built environment $ , Vol. 36 (2008),pp 4552–4557 , 2016, https://doi.org/https://doi.org/10.1016/j.enpol.2008.09.012 - ,
The contribution of a planted roof to the thermal protection of buildings in Greece ,Contrib. a Plant. roof to Therm. Prot. Build. Greece. Energy Build. , Vol. 27 (27(1)),pp 29-36. , 1998, https://doi.org/https://doi.org/10.1016/S0378-7788(97)00023-6 - ,
Studies on solar passive cooling techniques for arid areas ,Energy Convers. Manag. , Vol. 40 (1),pp 89–95 , 1999, https://doi.org/https://doi.org/10.1016/S0196-8904(98)00039-9 - ,
Cool Surfaces and Shade Trees To Reduce Energy Use And Improve Air Quality In Urban Areas ,Sol. Energy , Vol. 70 (3),pp 295–310 , 2001, https://doi.org/https://doi.org/10.1016/S0038-092X(00)00089-X - ,
Analysis of the green roof thermal properties and investigation of its energy performance , Vol. 33 ,pp 719–729 , 2001, https://doi.org/https://doi.org/10.1016/S0378-7788(01)00062-7 - ,
Study on the application of cool paintings for the passive cooling of existing buildings in mediterranean climates ,Adv. Mech. Eng. , Vol. 2013 , 2013, https://doi.org/https://doi.org/10.1155/2013/413675 - ,
Effects of solar shading devices on energy requirements of standalone of fi ce buildings for Italian climates ,Appl. Therm. Eng. , Vol. 54 (1),pp 190–201 , 2013, https://doi.org/https://doi.org/10.1016/j.applthermaleng.2013.01.039 - ,
Integrating passive cooling techniques for sustainable building performance in hot climates with reference to the UAE ,WIT Trans. Ecol. Environ. , Vol. 150 ,pp 201–212 , 2011, https://doi.org/https://doi.org/10.2495/SDP110181 - ,
Development of a computer model simulation for predicting the performance of a near infrared reflecting charcoal cooler for on farm storage of mangoes , Vol. 5 ,pp 7–10 , 2014, no. May - , Predicting the Effects of Green Roofed Urban Buildings on Cooling Loads, 2014
- , Strategy Guideline: Accurate Heating and Cooling Load Calculations, 2011
- ,
Validation and adjustment of the mathematical prediction model for human rectal temperature responses to outdoor environmental conditions ,Ergonomics , Vol. 38 (5),pp 1011–1018 , 1995, https://doi.org/https://doi.org/10.1080/00140139508925167 - ,
A disc to air heat flux error and uncertainty analysis applied to a turbomachinery test rig design ,Proc. Inst. Mech. Eng. Part C J. Mech. Eng. Sci. , Vol. 223 (3),pp 659–674 , 2009, https://doi.org/https://doi.org/10.1243/09544062JMES1158 - , A S H RA E EnergyPlus :, 2000
- ,
Factors Influencing Sustainability Of Community Service Order Projects In Kiambu County, Kenya ,J. Manag. Bus. Stud. , Vol. 1 (1),pp 29–34 , 2013