


Malawi has been experiencing droughts which are increasing in frequency, duration and severity. Over the past 20 years, dry spells and seasonal droughts have been so common [1]. The World Bank report [2] emphasized that natural disasters especially droughts and flash floods have been so recurrent in Malawi and Mozambique. These have caused different havoc in agriculture production, water resources and the economy of the country [3].
Precipitation in Malawi is the commonly available data in most districts [4]. Most farmers in Malawi depend on rainfed agriculture. However, the spatial-temporal climate variability has had a substantial impact on the amount, timing and frequency of rainfall resulting in recurring droughts [5]. These variations normally have negative impacts on agriculture production. Kasungu Agricultural Development Division (ADD) lies on the Kasungu-Lilongwe plain which is an agro-based region in Malawi.
Although significant research has been done on impacts of droughts in Malawi, research on drought characterization is still limited for most regions in Malawi. Despite most areas being vulnerable to drought conditions, no study has ever been done to characterize droughts in Malawi. Droughts are categorized based on their duration and frequency [6]. Hayes et al. [7] further observed that meteorological droughts arise from rainfall deficits both in temporal and spatial resolutions. Though droughts may be meteorological, agricultural or hydrological, they all root from rainfall variations [8]. Temporal rainfall deviations from the normal results in rainfall variations resulting in droughts [9]. All droughts are as a result of deviations from normal conditions be it precipitation, soil moisture, stream flow or groundwater or aquifer recharge [10]. Rainfall, stream flow, and soil moisture datasets are necessary to understand drought variations in a region [11]. Of these parameters, rainfall is a key parameter for monitoring meteorological droughts [12]. Long term monthly time series data is important in calculating the SPI for drought monitoring [13]. Rainfall patterns and variations are best determined when long term time series data is used [14]. Forsythe et al. [15] further recommended that long term rainfall data is required for drought climate vulnerability studies. The study undertaken by Szalai [16] compared two drought indices in Hungary and concluded that the SPI is a powerful drought index to be used in drought monitoring studies and Bordi [17] added to the discussion and agreed that the SPI is the mostly accepted index used in drought studies. The SPI is a comprehensive and an influential rain-based index in monitoring droughts [18]. The SPI can be used at different timescales making it the most used and most powerful drought monitoring index [19]. The major advantage of this index is that it requires rainfall as the only input. The World Meteorological Organization [20] recommends this index for meteorological drought analysis. However, the major disadvantage of this index is that it does not factor in other parameters that influence drought characteristics especially severity such as temperature and evapotranspiration [21]. This index to be effective for different time scales, long-term data which fits a parametric distribution is a need. The SPI analyses droughts at various temporal scales to enhance drought classification [22]. This extends the finding of [23] that drought analysis at various spatio-temporal scenarios aids in proper drought classification and development of relevant drought mitigation measures. The ability of the SPI to evaluate drought scenarios at different timescales augments its robustness [24]. This index is best used for meteorological drought analysis [25]. The principle of SPI is to convert long term rainfall data to a gamma probability density function which is then transformed to a normal distribution with a mean of 0 and a standard deviation of 1.
Being first of its kind, this study therefore does not depart from this line and sought to characterize and assess the impact of spatial and temporal drought regimes in Kasungu ADD in Central Malawi using the SPI 3-months (SPI-3) and 6-months (SPI-6) time scales. This study further sought to determine drought properties at the specified timescales which can be used as a basis for planning water resources projects such as calculating crop water requirements and crop diversification for irrigation in the region to combat the effects of droughts at different timescales.
In this study, meteorological (rainfall and temperature) monthly data for 40 years (1977-2017) was collected from the Department of Meteorological Services. This data was used to calculate drought indices. The Digital Elevation Model (DEM) was downloaded from
Mathematically, SPI is calculated as in eq. (1):
(1)
where Xij is the seasonal rainfall at the i-th station and j-th observation, Xim is its longterm seasonal mean and σ is its standard deviation. However, rainfall data is normally fitted by a Gamma distribution when considering SPI. Taking this probability density function of the Gamma distribution, SPI is calculated as:
(2)
where Γ(α) is the Gamma function; x is the rainfall (mm); α is the shape parameter (α>0) and β is the scale parameter (β>0) and:
(3)
(4)
(5)
(6)
where is the mean of rainfall.
The SPI values are classified as shown in Table 1 below.
SPI Classification
SPI Value |
Drought/Wetness condition |
|---|---|
≥𝟐 |
Extremely wet |
1.5 to 1.99 |
Very wet |
1.0 to 1.49 |
Moderately wet |
-0.99 to 0.99 |
Near normal |
-1.0 to -1.49 |
Moderately dry |
-1.5 to -1.99 |
Severely dry |
≤𝟐 |
Extremely dry |
When a drought has been determined, the runs theory as shown in Figure 1 was used to identify four drought properties namely duration, severity, intensity, and frequency.
Drought characteristics using the run theory for a given threshold level
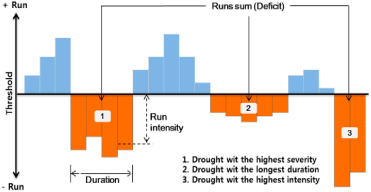
Duration of a drought event defines the number of months in drought conditions. Severity defines the definite value of the sum of the index during a drought event. In other words, it is the sum of the integral area below zero of each drought event.
The intensity of drought is given by:
(7)
Frequency of a drought defines the number of drought events the occurred within a given period. Mathematically,
(8)
Figure 2 shows the Digital Elevation Model (DEM) of Kasungu ADD. Highlands within the range of 1500-1700 metres above mean sea level lie on the south western part (Mchinji Mountains) and south eastern part (Dowa Hills). Some parts of Mchinji district, some parts of Dowa district and some parts of Ntchisi are at higher elevations such that they receive better amount of rainfall enough for crop production. Notably, these areas are less vulnerable to drought risks. This notion agrees with [27] who stated that areas at lower elevations are more prone to drought risks.
Digital Elevation Model of Kasungu ADD
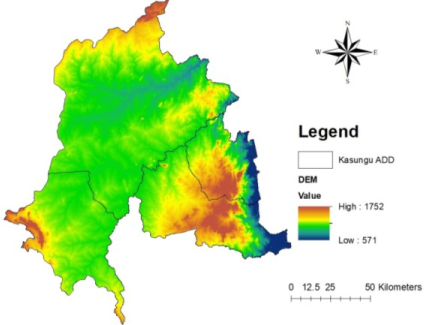
Table 2 shows the summary statistical analysis of rainfall data in Kasungu ADD. The mean annual rainfall varies from 781.1mm for Kasungu to 1093 mm for Ntchisi. The higher rainfall values recorded in Ntchisi, and Mchinji could be attributed to the geographical nature of the areas which are mountainous as determined from the DEM, are coupled with forest reserves and are connected with a rich network of tributaries of rivers which supply a significant amount of atmospheric moisture for rainfall. The lower rainfall values could be due to extensive land use changes in the western part of the ADD. Farming is a core economic activity in the area such that most people have opened up more lands through the cutting down of trees and vegetation, leading to higher levels of deforestation. This reduces evapotranspiration rate resulting into low rainfall regimes. The coefficient of variation in all the districts shows that the annual rainfall in the region is not dependable and is highly variable (CV > 0.5). This agrees with [28] who noted that the higher the CV value of a distribution, the higher the variability of that distribution. The high values of standard deviation also suggest annual rainfall fluctuations and high variability of rainfall in the region. This agrees with [29] who found out that rainfall with a high standard deviation is considered more unpredictable than rainfall with a low figure.
Descriptive Statistics of rainfall in Kasungu ADD
Station |
Mean annual rainfall (mm) |
Maximumrainfall (mm) |
Minimum rainfall (mm) |
Standard deviation |
Coefficient of variation (CV) |
|---|---|---|---|---|---|
Dowa |
852.1 |
469.9 |
0 |
103.7 |
1.47 |
Kasungu |
781.1 |
513.2 |
0 |
97.3 |
1.51 |
Mchinji |
1071.9 |
552.9 |
0 |
116.5 |
1.32 |
Ntchisi |
1093 |
878.5 |
0 |
130 |
1.43 |
The knowledge and utilization of temporal and spatial pattern of rainfall trends analysed in this study is a simple yet essential requirement for agricultural planning and management of water resources. Figure 3 exhibits the spatial rainfall variability in Kasungu ADD. It was observed that the mean and annual rainfall patterns in the ADD vary a lot, especially the central area where most people cultivate. The rainfall is less variable in furthest western and eastern parts due to their geographical dimensions as these areas are mountainous and receive orographic rainfall.
Mean annual rainfall variability in Kasungu ADD
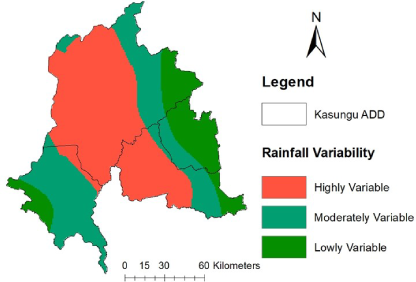
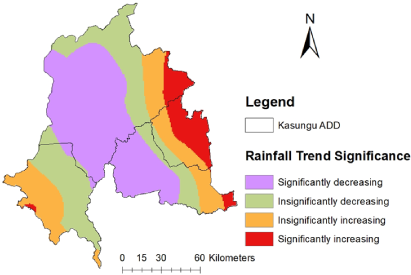
Figure 4 highlights the rainfall trend significance in the ADD. The trend patterns indicated that the rainfall is decreasing significantly (p < 0.05) in the central low lying areas of Kasungu ADD. This suggests that the area is prone to droughts. The eastern part however indicated significant increasing trends (p < 0.05). The areas that indicated moderate rainfall variability had insignificant increasing and decreasing trends. The knowledge of rainfall variability and trend significance in the ADD would enable farmers to plant crop varieties which are resistant to weather shocks and crops which have low water requirements. This knowledge would also help water planners in the agriculture sector and water supply to develop systematic disaster risk management strategies.
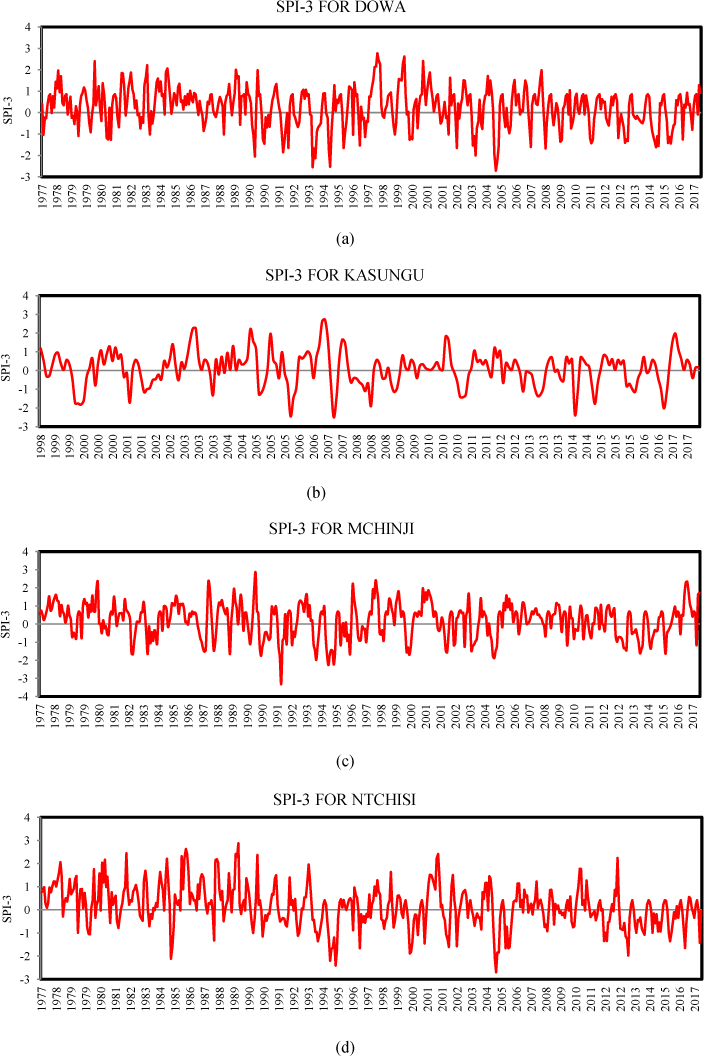
Figures 5a-d and Figures 6a-d highlight respective temporal variations of SPI-3 and SPI-6 drought indices which indicated similar trends with differences in their characteristics in terms of severity and duration.
Mean annual rainfall trend significance in Kasungu ADD
Temporal Variations of SPI-3 for Stations in Kasungu ADD: (a) Dowa; (b) Kasungu; (c) Mchinji; (d) Ntchisi
Temporal Variations of SPI-6 for Stations in Kasungu ADD: (a) Dowa; (b) Kasungu; (c) Mchinji; (d) Ntchisi
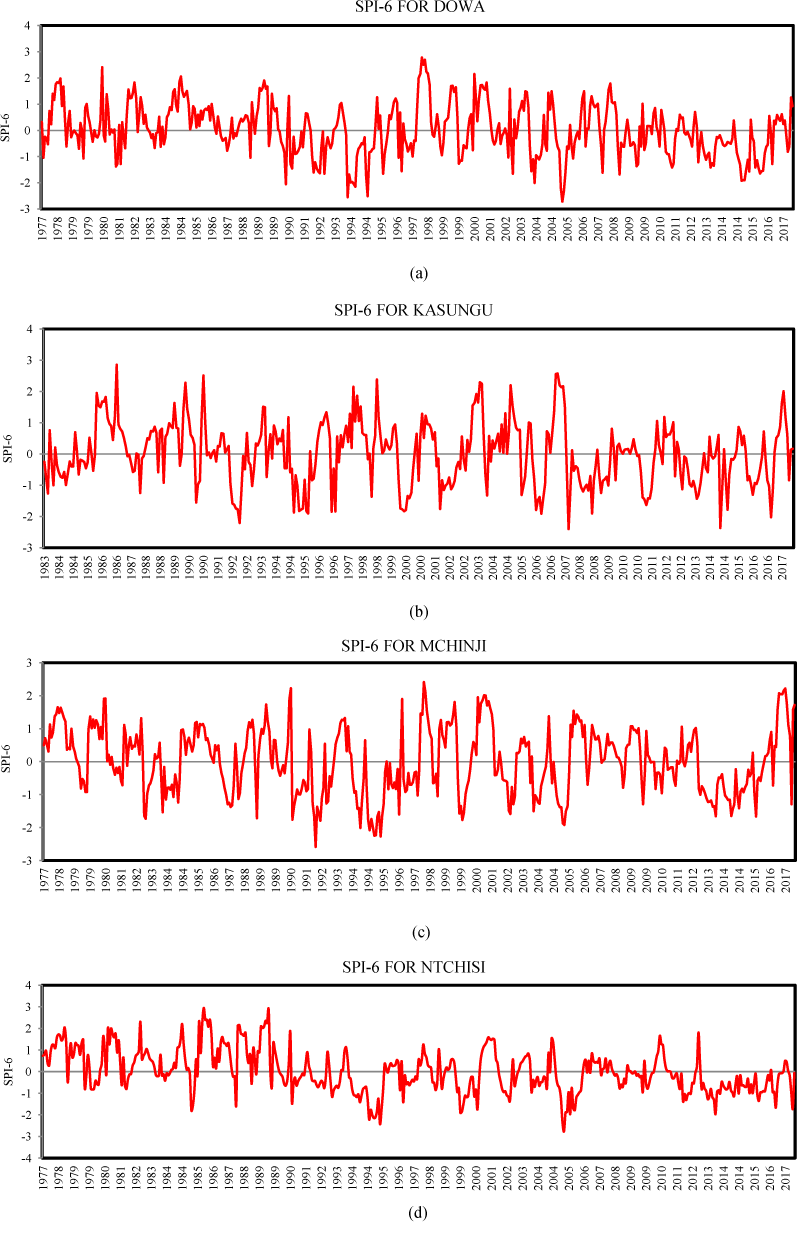
In Kasungu district, SPI-3 detected one extreme drought in November 1999 (with duration of 121 days and a severity of 2.946). The most severe drought was noted in February 1992 (with duration of 90 days and severity of 1.99), and the least severe drought was observed in May 2014 (with duration of 61 days and severity of 1.506). Intense moderate droughts were identified in March 1990 (with duration of 61 days and severity of 1.357). Mild dry conditions were experienced in 1983, 1993, 1994, 1996, 2001, 2008, 2012, and 2014, especially in January, February, March, April and May. SPI-6 identified five extreme droughts in 1992, 1995, 1999, 2006, and 2011. The most extreme drought was in 1999 which started in November and had duration of 213 days with severity of 4.209. The least extreme drought was in 1995, commenced in February and had duration of 120 days with severity of 2.414. Three severe droughts in SPI-6 were noted in 1995, 2007, and 2014; one moderate drought was observed in 2016. SPI-12 identified five extreme droughts in 1992, 1995, 2000, 2005, and 2008. SPI-12 did not observe any severe and moderate droughts, but mild droughts were noted in 1990, 2002, 2009, 2013 and 2016.
In Dowa district, SPI-3 detected three extreme drought events in 1993, 1994, and 2005. The most extreme drought started in March 2005 with duration of 122 days and severity of 4.681. Severe drought conditions as detected by SPI-3 occurred in 2003 and 2015. The drought in January 2015 was more severe than the one in November 2003. The 2015 severe drought prolonged for 151 days with severity of 1.772 whereas that of 2003 extended over a period of 92 days with severity of 1.673. The rest of the seasons indicated mild drought conditions. SPI-6 depicted five extreme droughts in 1992, 1993, 1994, 2005 and 2015. The 1992 extreme drought started in February an extended over a period of 151 days with severity of 2.545. The 1993 drought spanned for 182 days starting from December and had severity of 6.445. The December 1994 drought extended over a period of 62 days with severity of 2.289. In 2005, the extreme drought started in June and spanned over a period of 122 days with severity of 4.948. The longest extreme drought started in January 2015 over a period of 243 days and had severity of 4.368. The severe drought started in November 2003 and hovered over a period of 92 days with severity of 1.688. The rest of the season was observed to have mild drought conditions. SPI-12 noted four extreme droughts in the district in 1992, 1994, 2005 and 2015.
In Mchinji district, SPI-3 detected extreme droughts in 1991, 1994 and 2005. The 1991 drought started in December, had duration of 91 days and severity of 3.383. The 1994 drought had duration of 212 days, severity of 5.372 and started in December. The 2005 drought had severity of 2.378, duration of 122 days and started in March. This showed that the most extreme drought was the 1994 drought in terms of onset and intensity. Severe droughts were noted in February 1994 and November 2011. The 1999 drought as noted by SPI-3 was more severe that the 1994 drought with regards to duration and severity. The 1999 drought had duration of 121 days and severity of 1.89 while that of 1994 had duration of 120 days and severity of 1.759. Moderate droughts were depicted in 1982, 1987, 1990, 2002, 2013 and 2014. SPI-6 observed four extreme droughts in 1991, 1994, 2005 and 2013. The 2013 was the most extreme with duration of 214 days staring from March and severity of 2.192. Severe drought was notable in 2014. This severe drought started in March, had duration of 214 days and severity of 1.883. Four moderate droughts were noted in 1987, 1990, 2002, and 2003. SPI-12 identified three extreme droughts in 1991, 2005, and 2013. The 1994 drought which started in November was the most extreme with severity of 16.275. There were no remarkable severe droughts under SPI-12 and moderate droughts were noted in 1987. The rest of the seasons indicated mild droughts.
In Ntchisi district, SPI-3 detected three extreme droughts in 1994, 1999 and 2005. The 1994 drought started in December, had duration of 212 days and severity of 5.245. The 1999 extreme drought also started in December, had duration of 91 days and severity of 2.126. The 2005 extreme drought started in March, had duration of 122 days and severity of 4.52. The SPI time scale of three months further noted only one severe drought in 1985. The severe drought started in March, duration of 61 days and severity of 1.715. SPI-3 further two moderate droughts in 2006 and 2013. The 2006 moderate drought started in January, had duration of 59 days and severity of 1.291; 2013 drought started in April and lasted for 91 days with severity of 1.395. SPI-6 marked three extreme droughts in 1994, 1999 and 2005. The 1994 extreme drought started in December, lasted for 304 days and severity of 8.921. The 1999 extreme drought also commenced in December, had duration of 183 days and severity of 2.747. The 2005 extreme drought started in May, had duration of 153 days and severity of 5.1. One severe drought which lasted for 120 days and severity of 1.799 was identified in 2006. Two moderate droughts were also noted in 1994 and 2013. The 1994 started in March, lasted for 184 days and ad severity of 1.003 whilst the 2013 moderate drought started in July, had duration of 92 days and severity of 1.496.
From these observations, it showed that meteorological droughts are frequently experienced in Kasungu and Dowa district and less frequent in Mchinji and Ntchisi districts. This could be due to the topography of the districts in that Mchinji and Ntchisi mostly receive a considerably higher amount of rainfall which provides enough moisture for crop growth. The droughts which were observed could be due to the temporal and spatial variation of rainfall within the pre-stated time scales.
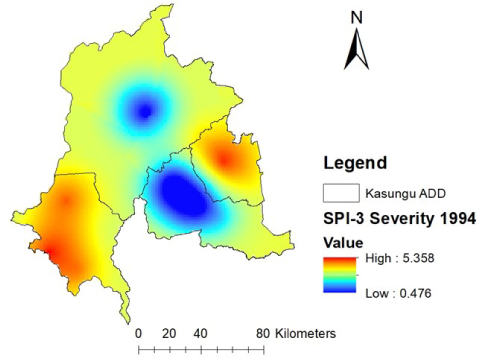
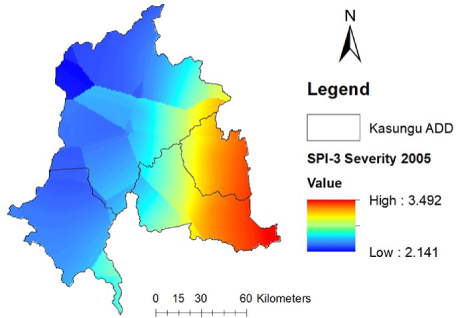
The spatial distribution of drought severity conditions was assessed using the Kriging interpolation technique using the point data. Using Kriging interpolation method in ArcGIS 10.5, drought severities for Kasungu ADD were mapped for the driest years namely 1994, 1999, 2005 and 2015. Figures 7-10 exhibit spatial variations of SPI-3 in the driest years in Kasungu ADD.
SPI-3 Severity for Kasungu ADD in 1994
SPI-3 Severity for Kasungu ADD in 1999
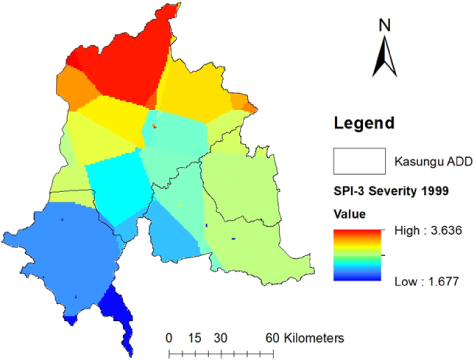
Figure 7 indicated that the largest part of Kasungu district showed higher severities with an average of 3.85 in 1994. Highest drought severities were noted in Mchinji and parts of Ntchisi in 1994 with an average of 4.76. In 1999, Figure 8 shows that most parts of Kasungu district exhibited higher drought severities with an average of 3.01. Lower drought severity was noted in Mchinji district. The higher levels of drought severities noticed were highly correlated to the rainfall variations in the corresponding districts. These droughts with high severities resulting from temporal and spatial rainfall variations affect agriculture yields in the ADD where most smallholder farmers depend on the rainfall for their production. This substantiates the study of [30] that noted that droughts reduce crop yields in agro-based economies.
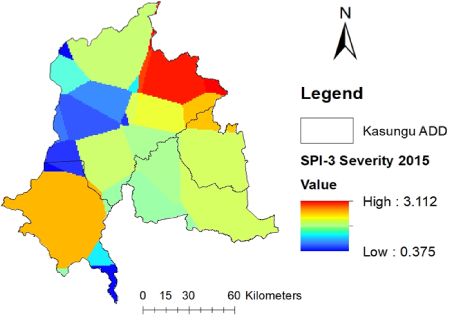
Figure 9 highlighted that in 2005, most parts in Dowa district and Ntchisi experienced drought events with higher severities than Mchinji and Kasungu district. Most part of Ntchisi registered higher severities with an average of 3.333 (3.174-3.492). Mchinji and Kasungu districts had average severities of 2.256 (2.142-2.369) and 2.465 (2.369-2.560). Figure 10 indicated that in 2015, Kasungu experienced highest drought severities whereas Mchinji displayed lower severities.
SPI-3 Severity for Kasungu ADD in 2005
SPI-3 Severity for Kasungu ADD in 2015
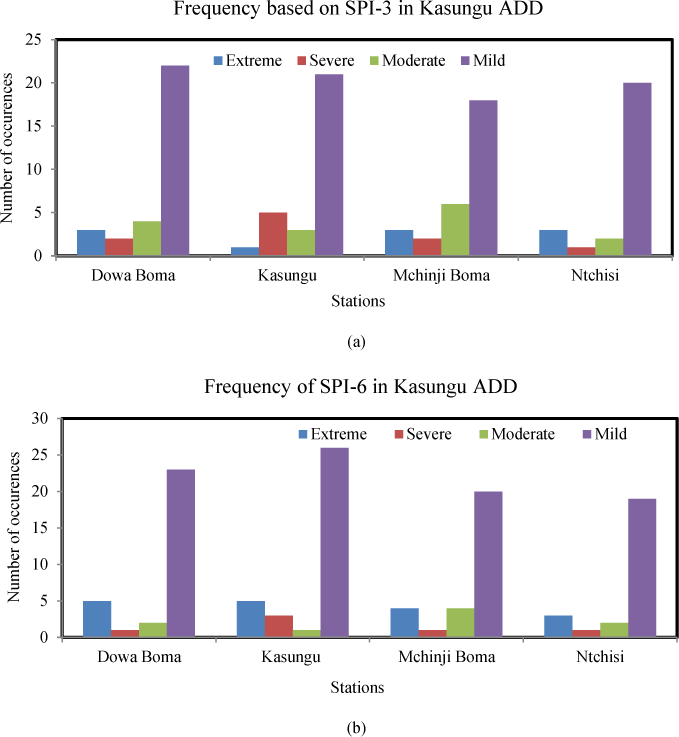
Figures 11a and 11b show drought frequencies within Kasungu ADD based on SPI-3 and SPI-6 respectively. Figure 11a illustrated that Kasungu experienced the highest number of severe droughts (5) while Ntchisi had the least (1). Mchinji had more moderate droughts with a frequency of 6 with Ntchisi recording the least (2). Mild drought conditions were frequent in all the four districts. Figure 11b displayed similar patterns based on SPI-6. This could be due to high rainfall variations which reduced the contribution of water in the water balance of the ADD. Both timescales indicated that the region is prone to droughts calling for extensive water management strategies in the region. This could include irrigation water management and rainwater harvesting.
Drought frequencies for (a) SPI-3 (b) SPI-6 in Kasungu ADD
The study was aimed at characterizing and assessing droughts in the spatiotemporal regimes in Central Malawi using SPI-3 and SPI-6. With the help of DMAP software, the SPI-3 and SPI-6 drought indices revealed that Kasungu ADD has experienced more of moderate and mild droughts (meteorological). This suggested a higher impact on agricultural production and hydrology of the ADD. Kasungu district experienced more droughts followed by Dowa, Ntchisi and Mchinji. The DEM showed that Mchinji, Dowa and some parts of Ntchisi have highlands which contribute to rainfall in the region. However, these regions contribute less amount of soil water content as most of the rainfall in such area is converted to runoff and not infiltration. The results indicated that areas which are at lower elevation and receive less rainfall are more vulnerable to meteorological droughts. This study therefore, recommends that SPI-3 and SPI-6 drought indices should be used to aid drought monitoring in areas where rainfall data is the only data collected. However, in areas with a lot of observed data sets, a combination of drought indices should be utilized to increase the dependability of the results.
- , National Adaptation Strategy to Climate Change Impacts: A Case Study of Malawi: Human Development Report, 2008
- , World Bank, Economic vulnerability and Disaster Risk Assessment in Malawiand Mozambique: Measuring Economic Risks of droughts and Floods Washington DC: World Bank, 2011
- , National Adaptation Programmes of Action (NAPA), 2006
- , Sustainability of Water Resources Development for Malawi with Particular Emphasis on North and Central Malawi, hD Thesis, Department of Civil Engineering, 2010
- , Drought Conditions andManagement Strategies in Malawi, 2014
- , Understanding the Drought Phenomenon : The Role of Definitions Understanding the Drought Phenomenon : The Role of Definitions, 1985
- ,
Monitoring the 1996 drought using the standardized precipitation index ,Bulletin of the American Meteorological Society , Vol. 80 ,pp 429-438 , 1999 - , Drought quantification by multivariate indices and their validation against various environmental data, 2018
- , The relationship of drought frequency and duration to time scales in proceedings of 8th conference on applied climatology, 1993
- , Probabilistic analysis of drought spatiotemporal characteristics in Thessaly region, 2004
- ,
Characteristics of global and regional drought, 1950 – 2000 : Analysis of soil moisture data from off-line simulation of the terrestrial hydrologic cycle , Vol. 112 ,pp 1–21 , 2007, https://doi.org/https://doi.org/10.1029/2006JD008288 - ,
An Evaluation Of The Standardized Precipitation Index, The China-Z Index And The Statistical Z-Score , Vol. 758 ,pp 745–758 , 2001 - ,
Patterns of monthly rainfall shortage and excess in terms of the standardized precipitation index for Catalonia (NE Spain) ,Int. J Climatol , Vol. 21 ,pp 1669–1691 , 2001 - ,
Visualization of lake mead surface area changes from 1972 to 2009 ,ISPRS Int. J. Geo-Inf. , Vol. 1 ,pp 108–119 , 2012 - ,
Data integration for climate vulnerability mapping in West Africa ,ISPRS Int. J. Geo-Inf , Vol. 4 ,pp 2561–2582 , 2015 - , Comparison of two drought indices for drought monitoring in Hungary—a case study, Vogt JV, Somma F (eds) Drought and drought mitigation in Europe, 2000
- ,
Fifty years of precipitation: some spatially remote teleconnections ,Water Resour Manag , Vol. 15 ,pp 247–280 , 2001 - ,
Estimationof meteorologicaldroughtindicesbasedon AgMERRAprecipitationdataandstation-observedprecipitationdata ,Journal of Arid Land , Vol. 9 (6),pp 797–809 , 2017, https://doi.org/https://doi.org/10.1007/s40333-017-0070-y - ,
Application of the Standardized Precipitation Index (SPI) in Greece , Vol. 3 ,pp 787-805 , 2011, https://doi.org/https://doi.org/10.3390/w3030787 - , World Meteorological Organization (WMO) and Global Water Partnership (GWP), Handbook of Drought Indicators and Indices (M. Svoboda and B.A. Fuchs). Integrated Drought Management Programme (IDMP), Integrated Drought Management Tools and Guidelines Series 2, 2016
- , Characterization of Droughts in Humid Subtropical Region, Upper Kafue River Basin (Southern Africa), Journal of Water, 2017
- , Spatio-Temporal Drought Characterization in Kenya from 1987 to 2016, 2018
- ,
Mapping Drought Hazard Using SPI index And GIS (A Case study: Fars province, Iran) ,International Journal of Environment and Geoinformatics , Vol. 3 (1),pp 22-28 , 2016, https://doi.org/https://doi.org/10.30897/ijegeo.304419 - , Standardized Precipitation-Evapotranspiration Index (SPEI): sensitivity to potential evapotranspiration model and parameters. Hydrology in a Changing World: Environmental and Human Dimensions, In Proceedings of FRIEND-Water 2014
- , Standardized Precipitation Index User Guide; World Meteorological Organization, 2012
- Drought Monitor And Prediction (Version 1.0) [Computer software], 2018, https://agrimetsoft.com/Drought Monitoring And Prediction.aspx
- ,
Spatio-temporal Drought Characterization for the Upper Tana River Basin ,Kenya Using Standardized Precipitation Index ( SPI ) , Vol. 3 (4),pp 111–120 , 2015, https://doi.org/https://doi.org/10.12691/wjee-3-4-2 - , Statistical Procedures for Agricultural Research, 1984
- , Statistical Analysis of Rainfall Trend for Volta Region in Ghana, International Journal of Atmospheric Sciences, 2014
- , Government of Malawi, Socio-economic profile for Kasungu district, 2006