


The increasing urbanisation, paucity of land and technological advancement have prompted designers and administrators to look for an alternate solution for housing people. Cities today can be seen dotted with high-rise buildings, especially in the central business districts, to accommodate a higher number of people within a relatively smaller building footprint. High-rise buildings are a consequent reaction of economic prosperity and the need for high-density living [1], [2]. They also serve as a statement of power and development, as their construction is fraught with challenges and requires detail planning and financial outlay [3]. These buildings are often artificially conditioned with intensive use of mechanical systems to create a conducive indoor environment, raising questions of sustainability. In recent years, designers have explored means to reduce this energy demand in buildings. Amongst the various available strategies, building applied vegetation provides an efficient means to reduce the energy demand by modifying the microclimate. Gao [4] suggests that urban structures can have a high impact on the thermal quality of an urban green area. Yang et al. [5] and Moss et al. [6] performed numerical simulation to demonstrate that vegetation can reduce the outdoor temperatures across densely built-up urban areas. Similarly, vegetation included inside the building in the form of a skycourt or skygarden, can also modify the microclimate. These are interstitial open spaces in a building that serves as a transitional space, allowing for recreational, social and environmental functions [7], [8].
Pomeroy [9] presents various case studies and theories behind the creation of skycourts on buildings to tackle multiple urban challenges, one of them being to create a conducive environment for its inhabitants. Skycourts are essentially the vertical equivalent of courtyards and open areas on the ground. Many designers have also included trees and plants in them to take the benefit of their environmental and psychophysical benefits. Such landscaped skycourts are often referred to as skygardens. Landmark buildings like the 20 Fenchurch Street, Park Royal Pickering, Bosco Verticale, Commerzbank, Genzyme Center, etc., have integrated skygardens in them to add socio-economic benefits. While many are enclosed skygardens, there are various instances of open skygardens exposed to the natural environment. They invite light and air into the building adding another layer of a design element.
Whereas much focus has been laid on the social, economic, environmental and psychological benefits of having open green spaces in buildings, few researches exist to analyse the aerodynamic performance of such spaces. Many studies have analysed the thermal and energetic benefits of such spaces [3], [10], [11], but have not included the wind flow study and comfort characterises related to wind speeds. Studies such as Blocken and Carmeliet [12] attempts to understand the outdoor wind condition on platforms. However, they have considered a relatively low height building in their study. The work of Zheng et al. [13] have performed wind comfort studies on a super tall building, but their work did not include attempts to modify the wind flow or parametrically analyse the factors impacting the wind flow.
This study will build on the previous works by Tien and Calautit [14] and Mohammadi and Calautit [15] to understand the impact of vegetation on the aero-thermal comfort characteristics of a skygarden. In the earlier work, a parametric study of skygarden design on the aero-thermal characteristics at the pedestrians' height was conducted. The present study uses one of the cases, identified previously, to analyse the attenuation effect of vegetation in skygardens. A benchmark high-rise building model was developed and validated with the experimental data of Melbourne [16]. The benchmark model is used by many researchers, analysing the wind flow around tall buildings [17], [18]. Various vegetation configurations will be incorporated onto the high-rise building model with a skygarden. The conditions within the skygarden will be evaluated based on wind and thermal comfort criteria.
As cities around the globe continuously grow and expand [19], there is a substantial need for novel concepts and approaches for planning and designing urban spaces [20]. Many advancements have aided the development and design of high-rise buildings, including the optimisation of geometrical form, structural systems, sophisticated damping systems and enhancement of energy efficiency [21]. There is an increasing interest in the application of low carbon strategies, including advanced building façades with renewables and greenery [21].
As urban areas develop, common issues related to urbanisation such as the Urban Heat Island (UHI) effect becomes increasingly serious and impacts the energy demand of buildings, especially those located within the most densely populated regions such as Kuala Lumpur, Singapore, and Hong Kong [22]. To alleviate the UHI effect, many high-rise buildings have incorporated green aspects into the building design. This includes the applications of green roofs, green facades, skygardens and vertical greeneries [23]. Aflaki et al. [22] highlighted the benefits of urban vegetation in mitigating the UHI effect. Through both direct and indirect process, global air temperatures and mean radiant temperature can be decreased up to 4.5 °C by incorporating urban vegetation. Also, Imran et al. [24] recognised the effectiveness of outdoor vegetation in reducing the UHI effect intensity during heatwave seasons. Furthermore, Hirano et al. [25] and Gomes et al. [26], highlighted that urban vegetation and vertical greenery can also reduce carbon dioxide (CO2) emissions.
Skygardens or greened courtyards are increasingly being utilised in densely populated areas. They are outdoor spaces located within the intermediate levels of a building [27]. The increasing number of buildings with skygardens have been built, for example, the Bosco Verticale in Milan [28] and the Park Royal Collection Pickering in Singapore [29]. Skygardens are designed to provide a transitional and social space for occupants [30] at a proximity to the main building area [31]. Distinct ecological features are integrated with the skygarden design to facilitate occupant's interaction. This includes the provision of adequate natural daylighting for internal and external regions, sufficient natural ventilation across the building and avoiding undesirable direct and indirect solar gains [3]. Skygardens serves as buffer zones which mediate the conditions between internal and external environment [3]. This could assist buildings located in areas with large variation between the indoor and outdoor conditions in providing adequate thermal while minimising building energy demands.
Skygardens can also provide social and economic benefits [3], [32]. As detailed in previous research, urban greenery and vegetation may reduce air pollution and cooling energy demand of surrounding buildings, due to the lower ambient air temperature and shading provided by the vegetation [33]-[35]. Furthermore, it can also provide noise reduction and enhance cultural and recreational values which are important for the wellbeing of the inhabitants. Hence, skygardens can be an effective solution to the UHI effect in densely built urban areas which have limited space for private and public greenspaces [36], while also providing cultural, economic, environmental, and spatial benefits for the urban inhabitants [30].
Studies including [33], [34], [37] analysed the cooling effect of vegetation as an essential part of UHI mitigation strategy. Manickathan et al. [33] analysed the cooling effect of trees using Computational Fluid Dynamics (CFD). The work analysed the influence of tree properties and the impact of various environmental factors on the cooling effect. The study highlighted the effectiveness of the vegetation-based solution in providing adequate cooling and shading. However, no analysis was made based on the configuration of a cluster of trees along with other vegetation types to replicate more realistic outdoor green areas.
Further analysis is required for typical outdoor urban areas with large green spatial areas such as parks and playing fields where great amounts of vegetation are present. Such analysis should be made towards occupancy needs and their thermal and wind comfort satisfaction as urban greening has a significant effect on the behaviour of occupants to remain outdoors for longer periods of time.
These studies also relate to the assessment of wind conditions at pedestrian levels by Blocken et al. [12], [38] and Zheng et al. [13]. The study [38] highlighted the importance of assessing the wind speeds around the pedestrian areas of high-rise building which can lead to uncomfortable or even dangerous conditions which can be harmful to the success of new buildings. Although the study [39] focused on the ground level and did not evaluate the conditions at higher levels, previous works [14], [15] have shown that high wind speeds can be experienced within skygardens depending on the height and the shape. The study [39] discussed different techniques and criteria which can be used to assess wind comfort.
Kang et al. [40] also used CFD modelling to evaluate the wind flow around trees and its effect on the pedestrian's wind comfort in urban areas. The work used wind comfort criteria to evaluate the sensory level for human activities. The study suggested that unpleasant conditions occur when occupants are sat down for a long period of time at areas where no trees are present and more significantly if it is an area where there are narrow spaces between the buildings. Also, when trees are present, the pedestrian wind comfort was improved due to the decrease in Beaufort Wind-force Scale (BWS) values by one to three grades.
While Lin et al. [41] performed thermal comfort assessment of urban parks under various climatic conditions using field tests and observations. The study showed the influence of thermal conditions on the thermal perception of visitors in outdoor urban space. Additionally, Toparlar et al. [42] reviewed the CFD techniques for urban microclimate analysis. The study highlighted that CFD is essential to aid the transfer of urban climate knowledge into engineering and design practice as a greater number of studies focus on urban scale adaptation measures. The present work will use the CFD techniques, and thermal comfort assessments methods suggested in the literature for the analysis of skygarden with various designs, vegetation properties and configurations.
To enable extensive occupancy interaction and usage of the skygardens along with high occupancy satisfaction, the following analysis of skygardens are necessary:
Wind flow around skygarden buildings;
Evaluation of suitable vegetation conditions and configuration in the garden areas;
An assessment of wind and thermal comfort of occupants.
Together this would enable the provision of more informative guidelines to aid future developments of skygarden buildings.
The present work will employ numerical modelling to assess the effect of vegetation configurations on the wind and thermal conditions within a skygarden. The evapotranspiration cooling effect of the vegetation will be considered for the assessment of the thermal conditions. The numerical investigation will use the CFD software FLUENT. As acknowledged in Section 2, its use has been very well established in previous works.
In the present study, the Reynolds Averaged Navier-Stokes equation (RANS) approach and the k-Ɛ equations are applied which are common and well established in the field of urban flow simulations, as detailed in Section 2. The simulation was conducted at steady-state and with a three-dimensional computational domain. The semi-implicit method for pressure-linked equations segregated pressure-based algorithm solver was employed [43]. RANS equations are implemented using the standard k-Ɛ turbulence model. For the variations in air density and buoyancy forces, the Boussinesq approximation is employed. The governing equations for continuity, mean strain rate tensor, turbulence kinetic energy, dissipation rate, turbulent viscosity and energy are used (not shown here, but fully available in the FLUENT theory guide). Although this closure model is not very accurate when there is separation occurring in the flow field, it is however preferred, and widely used, in studies of the built environment, ventilation and wind comfort [44]. This is due to its lower computational time and robustness. It is also reported that the standard k-Ɛ model provides better temperature prediction than the realisable k-Ɛ [43]. Therefore, in the present study, wherein the aim was to investigate occupants' comfort, k-Ɛ model provides a good approximation of the conditions in the skygarden.
To predict the conditions in the skygarden, the vegetation must be modelled correctly to simulate the airflow behaviour in the wake of the vegetation. Many studies used estimated drag coefficient of trees from scaled wind tunnel tests to model the tree in CFD [45]-[47]. The trees are then modelled as a porous zone, representing a momentum sink. The trees in the study are modelled after Bitog et al. [48] using a simplified approach where a momentum source terms are added to the fluid flow equations. Inputs for the porous media including the viscous resistance factor (1/α) and the inertial resistance factor was derived using the Ergun equation:
(1)
(2)
where d is the particle diameter and Ø is the void fraction, set to 0.02 m and 0.96 in the present work.
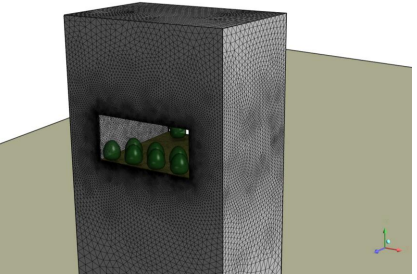
To account for the vegetation cooling effect, the present study adopted a simplified approach based on the works of Rahman et al. [47] and Gromke et al. [49], and a volumetric cooling potential of 350 W/m³ per LAD was assigned, as source term in the energy equation. Leaf Area Density (LAD) is defined as the leaf area per unit volume of the vegetation. While the actual shape of the vegetation can vary from species to species, and can be quite complex in shape and dimensions, it was decided to model a simple geometry representing medium-sized (approximately 5 m in height) with a constant LAD of 2.3 m²/m³. Only the crown is modelled in the numerical simulation, which is set at a height of 0.5 m above the plane of the skygarden as shown in Figure 1.
Computational domain and boundary conditions
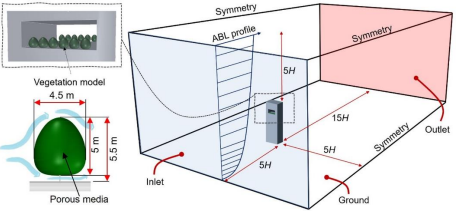
For pre-processing, the solid geometry is modelled in Computer-Aided Design (CAD) and imported into ANSYS for meshing and flow analysis. The present study requires the modelling of separate components that are assembled into an integrated model which can be done in the CAD software. The CAD geometry is imported to ANSYS Design Modeler which requires further modification to define the computational fluid domain required for the CFD simulations as shown in Figure 1. The present work adopts a domain size based on [50], [51]. The upstream is 3 times the height of the building (3H). The side lengths are 5B, 228.5 m and the downstream domain length is 15B, 685.5 m. The building has a height, width and depth of 184 m, 45.7 m and 30.8 m, respectively. The validation model consists of a rectangular building, without a skygarden, with a volume of 38,880 m3.
The present work adopts the hollowed-out of a configuration of the skygarden, as shown in Figure 2, characterised by a void going through the depths of the building [30]. The skygarden acts as a connection between the windward and the leeward side, drawing air inside the space due to pressure differences. Buildings, such a Abeno Harukas (Osaka) and Post Tower (Bonn) have integrated such skygarden designs. The modelled high-rise building is 46 storeys high, with each storey of 4 m. In total, the height reaches 184 m and the skygarden covers 3 storeys, i.e., 12 m. The skygarden is placed at 148 m above the ground as shown in Figure 2.
The trees are situated in the zones of high wind speeds, as observed in previous works [14], [15], to function as attenuators or wind barriers. Figure 2 shows an example of the arrangement of trees in the skygarden. An oval-shaped tree with max. 4.5 m diameter is used to represent a generic tree shape and is placed 0.5 m above the floor, following the study by Bitog et al. [47]. To account for structural and architectural reasons, the trees are placed 1 m from the edge and equally spaced out.
Skygarden model and schematic showing tree arrangement and dimensions
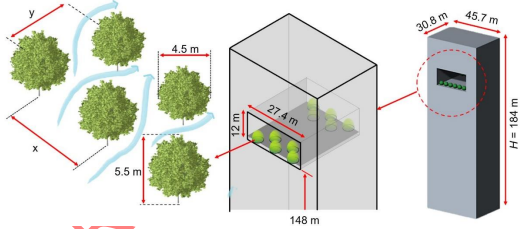
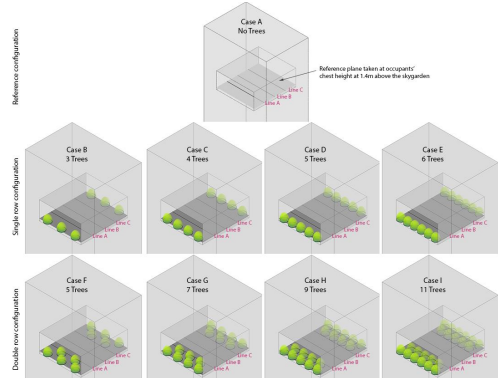
Figure 3 shows the nine skygarden models simulated in the present study. Three main configurations were simulated, no trees (reference), single row configurations which had three to six trees and double row configurations which had five to eleven trees. Table 1 summarises the specification of each configuration and the relevant dimensions. From previous works [14], [15], it was observed that wind speeds are higher near the edges of the skygarden, and consequently the trees are placed along the edges for an effective wind break. Moreover, in practice, each skygarden is uniquely designed considering the contextual nature of the site, making it difficult to simulate any particular type. Both the windward and leeward edges are lined with trees to account for the dynamic nature of wind direction. Cases are named as per the number of trees on each side. The lines marked A, B and C indicate the three areas of the skygardens for comparison. Whereas line B is located in the centre of the skygarden, lines A and C are placed behind the tree cover at a distance of 1/4th of the depth of the skygarden (7.7 m). Line A is towards the windward edge, while C is towards the leeward edge.
Vegetation arrangements within the skygarden model, with the analysis line marked on the reference plane
Vegetation arrangement key specifications
| Configuration | X [m] | Y [m] | Floor area [%] | Blockage ratio [%] |
|---|---|---|---|---|
| A | - | - | 0 | 0 |
| B | 0.91 | - | 8.60 | 16.30 |
| C | 0.69 | - | 11.50 | 21.80 |
| D | 0.55 | - | 14.40 | 27.20 |
| E | 0.46 | - | 17.30 | 32.60 |
| F | 0.91 | 0.45 | 16.10 | 27.20 |
| G | 0.69 | 0.45 | 22.60 | 33.60 |
| H | 0.55 | 0.45 | 29.20 | 36.70 |
| I | 0.46 | 0.45 | 35.80 | 38.70 |
The domain was created as an enclosure which allows the simulation of airflow around the high-rise building model as shown in Figure 2. A velocity flow field is generated by setting one side of the enclosure as velocity inlet and the other side as pressure outlet.
Wind distribution is an essential factor in defining comfort [52]. Existing wind profile in previous CFD simulations used by Dagnew et al. [17] was used to create a suitable wind velocity profile (Figure 4). Given as eq. (3), the atmospheric boundary layer velocity profile based on the power-law was used [31]:
(3)
where u(z) [m/s] is the calculated wind velocity at the desired height z, u(z1) is the reference wind speed at the height z1 of 184 m and α is the power-law exponent being 0.33 for towns and cities.
The pressure outlet was set as 0 Pa. The air temperature for the inlet is kept constant at 303 K (30 °C). The boundary condition for the outlet is set to pressure outlet with 0 Pa. The gravity of -9.8 m/s² was set for the simulation domain to account for buoyancy. Symmetry for top and side walls and no-slip condition for ground implemented as a standard roughness model.
Atmospheric boundary layer wind velocity profile [35]
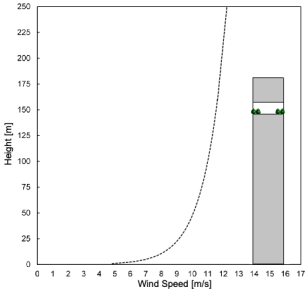
Figure 5 shows the generated computational mesh around the surfaces of the 3D model of the high-rise building, skygarden and vegetation. The mesh is refined around areas of interests in the simulation, such as the skygarden space and the tree model. Grid sensitivity analysis was also carried out to assess the independence of the CFD solution from the mesh size. Various mesh sizes ranging from ~2 million to 15 million elements are generated and simulated with similar boundary conditions (detailed in the next section).
Computational mesh around the surfaces of the skygarden model highlighting refined areas
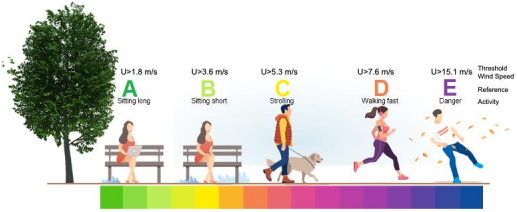
Lawson (1978) [53] criteria (given in Figure 6) was selected as the wind comfort requirement for this investigation. It enables the identification of wind velocity achieved across the skygarden in relation to occupancy activities.
The Lawson wind comfort criteria [53] (graphics adapted from Simscale)
The following section presents the verification of the CFD method and the results of the various vegetation configurations across the skygarden building.
To verify the benchmark high-rise building model, a grid sensitivity analysis was carried out, and the results were validated with experimental and numerical data from previous studies.
A sensitivity analysis was performed to determine the most suitable mesh size and configuration. Table 2 presents the details of the various forms of mesh applied to the base building model. All mesh configuration of the based high-rise building was simulated to verify the benchmark model and select the mesh setup that provided a balance between the mesh size, computational time, rate of convergence, solution quality and grid independence [54].
Mesh setup for verification
| Mesh config. | Mesh setting | Number of | |
|---|---|---|---|
| Building face sizing [m] | Nodes | Elements | |
| A | 1 | 341,813 | 1,959,707 |
| B | 0.5 | 1,023,505 | 5,886,302 |
| C | 0.2 | 2,857,683 | 15,382,760 |
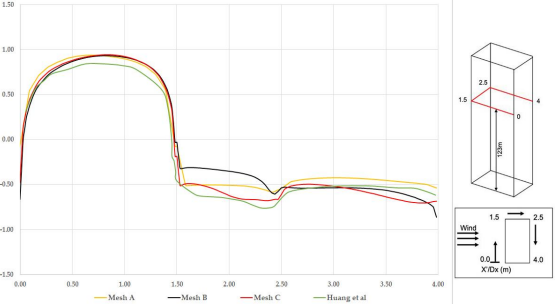
Simulations of the base high-rise building with the k-Ɛ turbulence model were performed using the mesh configurations detailed Table 3. Using the assigned wind velocity profile (Figure 4) and the initial CFD set up conditions, pressure coefficient along the windward, side and leeward surfaces at two-thirds (2/3H) of the building height (123 m above ground) were evaluated. The simulation was considered converged when the point of interest (skygarden centroid) recorded a constant value. Results (Figure 7) suggest the CFD simulation were able to model the patterns of pressure coefficient around the building. The pressure coefficients were comparable as it showed that mesh configuration and sizes (based on the overall number of nodes and elements) had a high impact on the results of the pressure coefficient. Even though higher mesh would result in greater computational time, to provide an accurate result of the conditions within the high-rise building it led to the selection of mesh types with a minimum of over 2.0 million number of elements as the results indicated that lower resolution meshes would result in higher variations. It should be noted that the number of elements would be dependent on the skygarden design and the vegetation configuration and the mesh size ranged from 2 to 15 million elements. The simulations using the k-Ɛ turbulence model provided pressure coefficient curves that followed the pattern by Huang et al. [18] with good agreement. The validated high-rise model was then used to incorporate the skygarden model.
Percentage of acceptable area for each case with wind Quality Class C and temperature of 29.6 °C or below
| Case | Number of trees on each side | Percentage of an acceptable area [%] | |
|---|---|---|---|
| Wind Quality Class of C and below | The temperature of 29.6 °C and below | ||
| A | 0 | 30.81 | 0.00 |
| B | 3 | 47.20 | 36.63 |
| C | 4 | 68.63 | 54.58 |
| D | 5 | 78.57 | 74.09 |
| E | 6 | 86.33 | 94.42 |
| F | 5 | 65.35 | 76.66 |
| G | 7 | 82.69 | 83.71 |
| H | 9 | 83.13 | 89.65 |
| I | 11 | 89.35 | 98.43 |
Mesh sensitivity results in terms of pressure coefficient around the windward, side and leeward surfaces of the benchmark building model at a height of 2/3H, 123 m above ground using various meshing configurations indicated in Table 4 and compared with the study by Huang et al. [18]
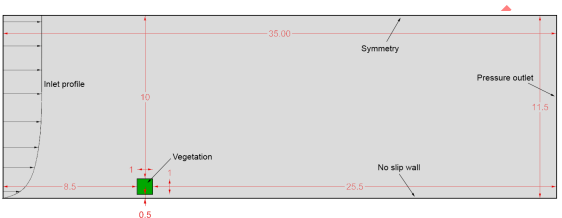
Validation of vegetation and trees. The vegetation model was validated against the study by Dagnew et al. [17], where the domain size of the reference case was 35 m in length and 11.5 m in height (Figure 8). Within the 2D domain, vegetation was represented by a 1 m square placed 8.5 m from the inlet and 0.5 m above the ground. Inlet velocity is modelled after Richards and Norris [55], where the von Karman number and z0 are set to 0.41 and 0.0217 m, respectively. Inlet air temperature is set to 32 °C.
Simulation domain of the validation model, with the porous vegetation indicated by the green square and centred along the x-axis
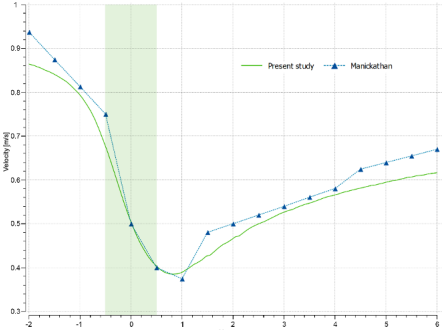
The velocity and temperature distribution of the area around the vegetation is shown in Figure 9. The vegetation zone offers resistance to the flow of air, with reduced speeds in the wake of the zone. The velocity distribution is in good agreement with the reference study [33]. A plot of velocity along the analysis line (marked in the figure), which runs through the centre of the vegetation patch, is shown in Figure 10. Vegetation is represented by the green patch, extending from -0.5 to 0.5 on the x-axis. The trend closely follows the numerical model of Manickathan et al. [33], with slight underprediction towards the back of the vegetation patch. A deviation of about 0.04 m/s² is observed towards the far end. The model performs well given the low modelling complexity of the vegetation zone. A temperature drop of about 1 °C is observed in the wake of the vegetation, similar to the decrease estimated by the reference case.
Velocity and temperature distribution around the vegetation patch (represented by the square)
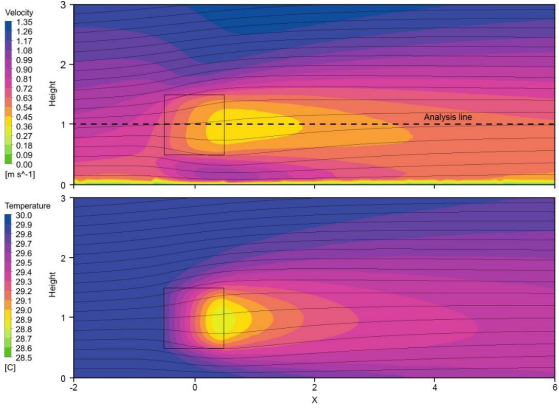
Comparison of wind speed along the analysis line, with the vegetation zone indicated by the green patch from -0.5 to 0.5 on the x-axis
The slight variations in temperature and velocity could be due to different governing equations adopted in the study. Whereas the present study utilised the standard k-Ɛ model, Manickathan et al. [33] adopted the realizable k-Ɛ turbulence model. Further, the numerical simulation was carried out in ANSYS, as opposed to OpenFOAM which was utilised for the reference case. Given the objective of the present study to determine the attenuation effect of vegetation in skygarden and the observed wind pattern on the building platform, the deviations were considered quite small and the observed contour were sufficiently accurate for further analysis.
Wind flow across the skygarden building is highly dependent on two main factors. This includes the distance of the skygarden level above ground level and its corresponding configuration and design. Using the wind velocity factor for skygarden designs [14], it is suggested that the wind flow speed to decrease as the height of the skygarden level increased. Given by Mohammadi and Calautit [15], the results for a central skygarden configuration indicates the highest variation in terms of wind velocity at skygarden levels. At the top skygarden level, a minimum velocity of 0 m/s at the central part of the skygarden and a maximum of 15 m/s at the windward side was achieved. Consequently, the present study focuses on the analysis for a high-rise building with a single central skygarden configuration at 148 m above ground level. This is selected to enable the identification of the conditions within skygardens under more realistic conditions with the presence of vegetation. Additionally, it was selected to observe whether vegetation can aid the diversity of wind flow across skygarden buildings.
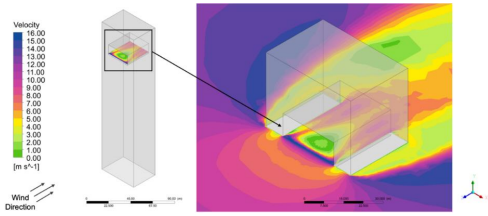
All results achieved were based on the influence of the selected wind velocity profile (Figure 4) assigned to the inlet side of the microclimate. Figure 11 presents the high-rise building model with a central skygarden design and no vegetation. The results of velocity magnitude and its wind flow direction around the building at 149.4 m above ground level followed a similar pattern correlated to the typical results that would be shown for a high-rise building with no skygarden design. Wind flow around the skygarden building followed the same patterns as to typical results that would be achieved for a general high-rise building. Wind velocity was the highest at the windward side, reaching a maximum of 16 m/s. The wind direction with high velocity caused air to become displaced upwards and around the sides of the building and pushed downwind onto the leeward side, which left areas on the leeward side with velocities less than 4 m/s. This reflected on the wind velocity achieved within the skygarden. Similarly, high velocities were present across the windward side of the skygarden and wind flow gradually decreased across the inner sides, parallel to the building wall surfaces which reached an average velocity of 7 m/s. Centre regions of the skygarden achieved the lowest velocity with velocities being as low as 0 m/s.
Wind flow across skygarden building with no vegetation
To achieve comfortable conditions within the skygarden environments, near consistent wind velocity with minimal variation should be achieved within the skygarden areas, or at least in the areas where occupants would mostly be present. Therefore, the large variations in wind flow distribution and speed across the skygarden suggest the need for a solution to reduce velocity at the windward side and also at the sides of the skygardent next to the building.
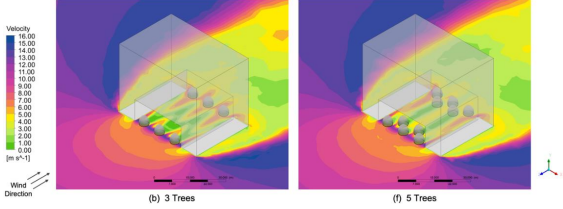
Majority of skygarden buildings consists of some form of vegetation, this was introduced by trees being modelled on the skygarden building. Figure 12 presents the wind velocity across the skygarden region with: Case B (3 trees) and Case F (5 trees) located at both the windward and leeward sides. Generally, the presence of trees provided a form of wind speed attenuation. It significantly reduced the wind velocity across the skygardens as greater parts achieved a wind velocity of 5 m/s or below. Specifically, trees along the windward side served as a barrier for direct wind flow and trees within the leeward side reduced the velocity of reverse eddies and fluctuations within the wind flow. This suggests the importance of having trees within skygardens for controlling the wind conditions. Further analysis of the results of wind flow across skygardens with various tree configurations in relation to comfort levels is given in the following section.
Wind flow across skygarden building with vegetation: Case B (3 trees) (b) and Case F (5 trees) (f)
Aero-thermal comfort assessment can help demonstrate whether the skygarden areas would have extensive occupancy usage and high occupancy interaction performed at these elevated open spaces within a high-rise building. The average occupants' chest height of 1.4 m was used as the height for the following cross-sectional contours above each skygarden level. The velocity magnitude was measured and correlated with the Quality Class (QC) criteria given in Table 2. This enabled the analysis of the skygarden performance with occupants' comfort.
The following provides the result of wind velocity distribution across the central skygarden design with the different vegetation configurations positioned across the windward and leeward sides. QC range following the Lawson criteria [53] (Table 2) was used to analyse the wind comfort at occupant's height, identifying the impact of trees and identifying the conditions within skygarden regions in relation to the suitability for the performance of specific occupant's activities.
For a skygarden with no vegetation, Figure 13 indicates the majority of the central regions, at approximately 7.5 m from the sides of the building wall and 2 m distance from the windward had wind flow speed of 5.3 m/s or below. QC of C was achieved. It indicated the suitability for activities such as sitting and strolling. However, this region only covers 30.81% of the total skygarden area. This suggests an overall poor performance due to the majority of the space consisting of a higher QC, and would be inappropriate for occupants to spend long periods of time.
Wind velocity magnitude across a central designed skygarden building with no vegetation correlated with the Lawson Quality Class Criteria
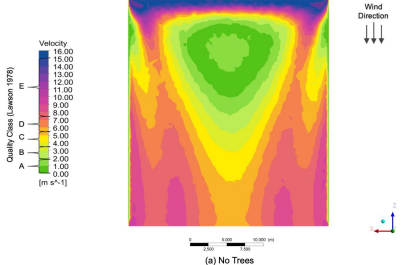
Figure 14 shows the results across the skygarden with vegetation configurations in a single row across both leeward and windward side of the area. The greater number of trees at the skygarden would result in a greater reduction of wind velocity, indicating better comfort levels for occupants. For all cases, it shows that the trees along the windward side reduced the velocity of direct flow towards the skygarden area. The trees provided a form of wind barrier as it directly reduced wind velocities at the areas behind the trees, achieving the most ideal QC of A and B. However, due to the shape of the trees, greater wind flow acceleration reaching QC D and E occurred around the corners of trees. It resulted in higher wind velocity at the spaces between each of the trees. In a comparison of the results for Case B and E, it suggests it could be prevented by the increase in the number of trees and a reduction of the distances between them. Similarly, the trees along the leeward side provided a barrier to reduce the velocity of reverse flow at the back of the building onto the skygarden. Given the results for Case B, it suggests trees along the windward side is more important than the ones located across the leeward side. This is shown by the QC of C was achieved at the upper central region. Effectively, Case B-E can provide up to 47.20%, 68.63%, 78.57% and 86.33% of acceptable areas that meet the QC of C and below.
Wind velocity magnitude across a central designed skygarden building with vegetation of Cases: 3 trees (b); 4 trees (c); 5 trees (d) and 6 trees (e), which was correlated with the Lawson Quality Class Criteria
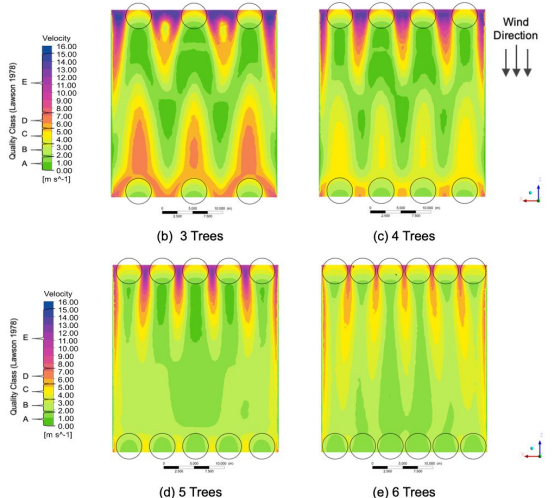
Figure 15 presents the wind velocity magnitude at occupancy chest height across the skygarden with the second row of trees placed in between the trees along the first row as a staggered layout. From the comparison of Case B (Figure 14) and Case F (Figure 15) results, it identifies the significance of this vegetation layout as the second row of trees indicated as a barrier to prevent the wind flow acceleration that occurred around the corners of the first row of trees. Similarly, the layout of the trees on the leeward side enabled wind flow to reduce and diverge towards the inner walls of the building. In comparison with Case B where large sections at the lower central part of the skygarden were considered as Class D, Case F indicates the same regions can achieve a QC of A-C. This suggests the second row of trees can benefit towards the achievement of the QC of C and below for up to 65.35% of the area. Therefore, this vegetation layout resolves the limitations which were suggested within the analysis of the single row of vegetation configuration.
Wind velocity magnitude across a central designed skygarden building with vegetation of Cases: 5 trees (f); 7 trees (g); 9 trees (h) and 11 trees (i), which was correlated with the Lawson Quality Class Criteria
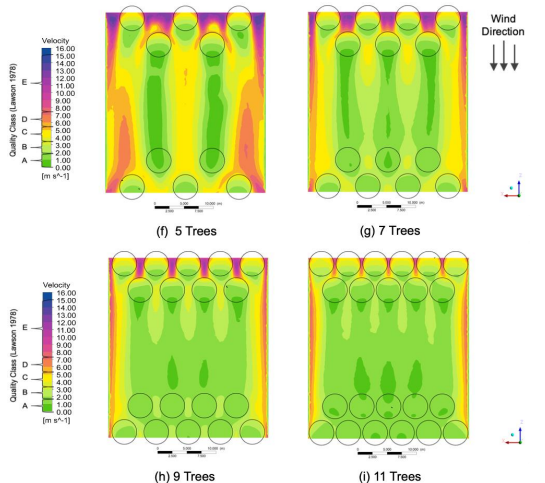
Since more trees were present (Cases G-I), the overall wind velocities across the skygarden were reduced. It also suggested the possibility of the QC of C and below could be achieved at up to 82.69%, 83.13%, and 89.35% of the skygarden. Accordingly, the difference between the results for Cases G-I indicates the impact of trees being is less significant towards the changes in velocity, as the reduction of wind velocity to a plateau of accomplishing the QC of B and C. Regions behind the trees were still improved, and a greater number of areas reached the QC of A and B. Hence, this indicates that minimal amounts of occupancy discomfort due to the wind conditions could be reached.
The effectiveness of wind attenuation by trees can be quantified in terms of the wind reduction factor (R) defined here as the ratio of wind speed at a point in the skygarden with vegetation, to the wind speed at the reference case (without vegetation). Figure 16a shows R over various skygarden configuration as a percentage of tree blockage area. This is the projected area of the trees onto the opening of the skygarden. Figure 16b is a plot of R for various cases as a percentage of the projected ground area of vegetation, while Figure 16c is a plot of R at the centre line of the skygarden.
R over various tree blockage ratio (a); R over various tree ground cover ratio (b) and R along the centre of the skygarden (Line B) for all cases (c)
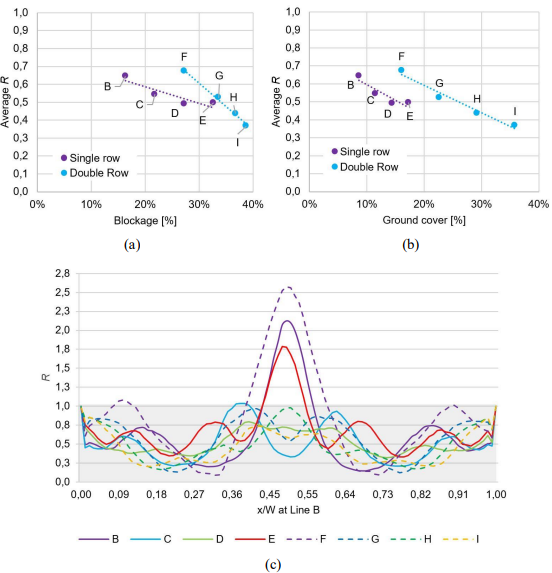
In general, the average wind speeds in the skygarden decreases with higher ground cover and blockage ratio of vegetation, indicated by lower R. However, with a single row of trees, the reduction is more significant for the same ground cover or blockage ratio. It can be visualised that a single row of trees provides better wind speed reductions with the same number of trees, as compared with the double row configuration. A closer look at the conditions at the centre of the skygarden (Line B) shows that most configuration has attenuated the wind speeds, indicated by R less than 1 (shown by the grey patch in Figure 16c). While case F offers the maximum reduction in some areas, it also amplifies the wind speed near the middle of the line. On average it offers the least attenuation with the average value of R being the highest amongst all 8 cases, i.e., 0.67. Cases B and E also create regions of amplified wind speeds near the middle of the skygarden. Other configurations offer varying levels of attenuation but never creates zones of amplified wind speeds.
Based on the limited configurations assessed, it was noted that single row trees can offer larger wind speed reductions for a given ground area or blockage ratio of vegetation. This is also dependent on the arrangement and volume of the tree and requires a study of multiple parameters to ascertain the relationship. However, R is independent of the wind QC, and it just serves to analyse the relative effectiveness of the tree arrangement. For a given number of trees, arranging them in a single row can greatly attenuate wind speeds and can be a preferred tree arrangement.
In addition to wind flow conditions across the skygarden, thermal conditions are equally as important. The following presents the results of the temperature distribution across the skygarden with the different vegetation configurations. Similarly, results were achieved for occupancy chest height of 1.4 m above the skygarden level.
Previous studies have shown wind flow across the skygarden with no vegetation had negligible effects on temperature [14]. It provided temperature values which were near equivalent to the assigned inlet temperature.
For this present study, a temperature of 30 °C was assigned to the inlet regions of the microclimate. Figure 17 and Figure 18 shows the temperature distribution across a central designed skygarden with various vegetation configurations. The temperature achieved along with the windward areas at 0.8 m before reaching the trees were 30 °C. With the temperature being the same as the assigned inlet temperature, it verified the certainty of temperature would remain unchanged when no vegetation is present within the skygarden.
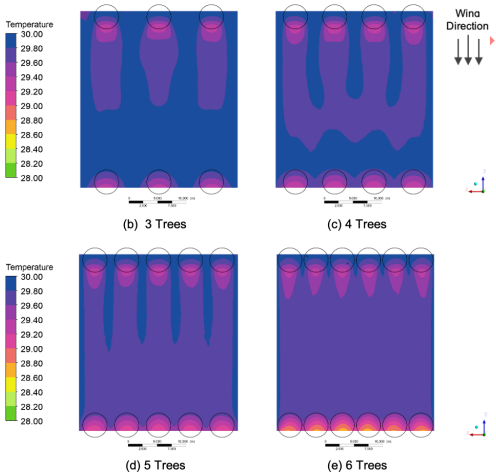
Temperature distribution across a central designed skygarden building with vegetation of Cases: 3 trees (b); 4 trees (c); 5 trees (d) and 6 trees (e)
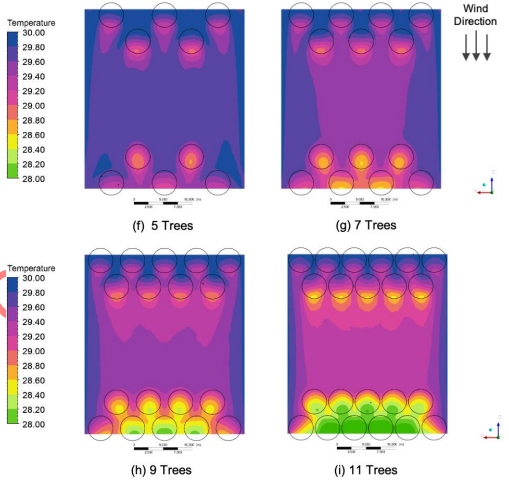
Temperature distribution across a central designed skygarden building with vegetation of Cases: 5 trees (f); 7 trees (g); 9 trees (h) and 11 trees (i)
The trees across the skygarden acted as a heat sink which therefore influenced the overall temperature distribution pattern. Indicated by Case B results (Figure 17), the temperature was significantly reduced within proximity to the trees, achieving a minimum temperature of 29.3 °C. The temperature at the skygarden was also affected by the wind flow direction, velocity and also the tree configuration. This was shown by the temperature achieved within the gaps between the trees along the windward side. The wind flow at these regions remained high and resulted in the temperature to be kept at 30 °C. The trees enabled the temperature across the skygarden to be only reduced in certain areas. Areas directly behind each of the trees across the windward side gave a temperature of between 29.60-29.80 °C, with a reduction of 0.4-0.6 °C. Based on the conditions of wind velocity, direction and the impact of the trees, the reduced temperature was projected for approximately 14 m towards the centre of the skygarden. Lower wind velocity was achieved at the leeward side of the skygarden suggested and less variation in temperature was given for these regions behind the leeward trees. However, when more trees were present, it suggests greater regions of the skygarden would achieve a temperature of 29.6-29.8 °C. Given by the patterns achieved between Cases C, D and E, it suggests the direction of wind flow with the trees along present along the windward side has a greater impact to give the reduced temperature across larger parts of the central area of the skygarden.
Figure 18 presents the temperature distribution across the skygarden with two rows of trees placed in a staggered layout. With the trees given in this configuration, besides acting as a barrier to prevent wind flow acceleration that occurred around the corners of the first row of trees, it also assisted the reduction of temperature. Greater significance was shown in cases with more trees present across the windward side which led to greater temperature reduction within the central part of the skygarden. Trees along the leeward side enabled the temperature to decrease more significantly. However, given by the wind flow direction and the velocity achieved from reverse flow, the reduced temperature cannot be distributed across larger regions of the centre of the skygarden. Suggested by Case H and I (Figure 18), the lower temperature remained around the tree at the leeward side. Therefore, to help reduce temperature at the main central skygarden where most occupants would be present, a large number of trees across the leeward side may not be as beneficial in comparison to the trees present on the windward side.
Overall, vegetation can reduce the temperature across the main skygarden area by up to 1 °C, this can aid occupant thermal comfort by achieving a lowered outdoor temperature to minimise the temperature difference between the indoors and outdoors for such given transitional space being relatively close to the main building. With trees being present at skygarden, it suggests a direct correlation between temperature and velocity. Regions with higher wind velocity indicate more discomfort for occupants but can effectively reduce the outdoor temperature. To achieve the best conditions for occupants, a balance between both the wind velocity and temperature should be acquired.
Based the above analysis of both wind and thermal on wind comfort for all skygarden cases, Table 4 provides a summary of the percentage of skygarden areas which achieved the wind comfort QC of A-C, along with a temperature of 29.6 °C and below. QC of C and below was selected as this was the range in which wind conditions would be most suitable for the performance of any types of occupancy activities for long periods of time. The temperature range of 29.6 °C and below was achieved across most of the skygarden configurations which influenced the selection of the criteria for Table 3.
Conditions assumed within the skygarden for thermal comfort analysis
| Parameters | Values | Reference |
|---|---|---|
| Humidity | 78% | [57] |
| Metabolic rate | 1 met | Seated, quiet |
| Clothing level | 0.5 clo | Typical summer indoor |
Case I presented the condition with the largest area achieving a wind QC of C and below, along with a temperature at the regions at 29.6 °C or below. This shows that the greater the number of vegetation present within the skygarden area can effectivity reduce both wind and thermal parameters to enhance occupants' thermal comfort within the skygarden. In terms of performance, Case I would be the best. However, this may not be an ideal solution for skygarden designs, as large amounts of trees were presented within both sides of the skygarden. This can largely affect occupant's visual perception and can ultimately affect their satisfaction that would impact on the skygarden operational performances. Therefore, the best design would require the largest percentage of an acceptable condition in terms of both wind flow and temperature, but also incorporate the impact of the amount of vegetation added to the area.
In addition to the R analysis, it indicated Case D to provide the best aero-thermal results. Its design configuration was similar to Case F with a similar number of trees but in a single row configuration, but it attained the highest percentage of area with QC of C and a low R-value. It can create conducive environment while contributing to a lower number of vegetation to indicate the elimination of any form of visual discomfort. For the given skygarden configurations further analysis based on occupants' thermal comfort at the skygarden was performed.
The CBE Thermal Comfort Tool for ASHRAE-55 [56] was used to further assess the thermal comfort within the skygarden. Based on the Predicted Mean Vote (PMV) method, the tool enabled the indication of whether the predicted conditions within the skygarden (wind velocities and outdoor temperatures) would achieve results that met with the desired comfort zones given by the ASHRAE Standard 55-2017. For the thermal comfort analysis, the following conditions given in Table 4 were assumed.
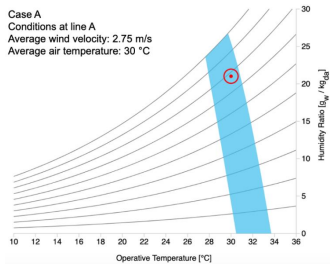
For Case A with no vegetation, Figure 19 indicates the predicted conditions attained across Line A (front line) of the skygarden. It suggests the conditions are within the thermal comfort zone (highlighted in blue) but did not comply with the ASHRAE Standard 55-2017 because the airspeed value is outside the range defined by the standard when local airspeed is not controlled. Regions including Line B (centre) and C (rear) of the skygarden did not meet with the thermal comfort requirements as the conditions consisted of average wind velocity of 4.83 m/s and 6.70 m/s. This is above the standard limit of 4 m/s, which suggests the conditions at these areas of the skygarden cannot provide a thermally comfortable environment for occupants. Hence, results such as Figure 19 cannot be produced for these locations. Along with the aero-thermal analysis, skygardens with no vegetation cannot achieve high occupant thermal comfort satisfaction, with even worse conditions achieved towards the centre and back of the skygarden.
Temperature-humidity ratio chart showing the predicted PMV thermal comfort for Case A (no vegetation skygarden, based on the conditions of average wind velocity and air temperature achieved at line A)
Thermal comfort analysis was also performed for Case B-I. All cases met the thermal comfort zone with a neutral sensation. Limited variations between the results were achieved. It all lies within the range between the cases given in Table 5, with Case A achieving the worst possible thermal comfort performance and Case I being the best.
Summary of the predicted thermal comfort results for Cases A, D and I
| Parameter | Results | ||
|---|---|---|---|
| Case A | Case D | Case I | |
| At line A | Average across the entire area | ||
| PMV with elevated airspeed | 0.20 | 0.07 | 0.11 |
| PPD (Percentage of Dissatisfaction) with elevated airspeed [%] | 6 | 5 | 5 |
| Sensation | Neutral | ||
| SET [°C] | 26.0 | 25.5 | 25.7 |
| Dry bulb temperature at still air [°C] | 26.0 | 25.6 | 25.7 |
| Colling effect [°C] | 4.0 | 4.1 | 3.6 |
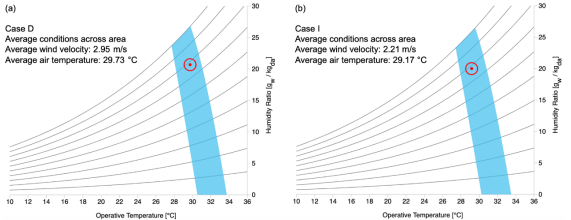
Within the analysis of wind and thermal comfort across the skygarden, Case D provided the best all-rounded aero-thermal results and Case I achieved the with the highest wind comfort levels and the greatest reduction in temperature. Figure 20 presents the predicted conditions across the skygarden with the corresponding results given in Table 5. Both cases indicate the benefits of vegetation which enabled the conditions to reach the thermal comfort zone. The Case I achieved a PMV of 0.11 and a 5% occupancy dissatisfaction. This suggests that a greater number of trees can help to provide a higher thermal satisfactory area. However, Case I was previously suggested with limitations due to the presence of extended amounts of vegetation which would impact occupant's visual aspect. In comparison, Case D would be favoured. A PMV of 0.07 with 5% occupancy dissatisfaction and the highest cooling effect of 4.1 °C suggests the prediction of a more comfortable skygarden would be accomplished.
Temperature-humidity ratio chart showing the predicted PMV thermal comfort for: Case D 5 trees (a) and Case I 11 trees (b), based on the conditions of average wind velocity and air temperature achieved across the entire skygarden
The aim of this study was to analyse the impact of vegetation on the aero-thermal conditions within the skygarden region of a high-rise building. Aero-thermal comfort in the skygarden plays an important role in the indication of the performance of a skygarden design. The Lawson comfort criteria was used to assess the wind comfort conditions across the skygarden, with QC of C being the upper limit of the preferred comfort level. This corresponds to a wind speed limit of 5.3 m/s for occupants' satisfaction.
A numerical model was developed and simulated using Fluent (ANSYS). The results indicate that up to 31% of the central skygarden area (base model without vegetation) would achieve a wind QC of C and below. With the addition of trees, however, higher percentage of skygarden area achieves QC of C and below. The reduction is more prominent for higher ground cover of trees. Thus, the addition of trees as buffer elements helps to achieve better comfort level for occupants. Between the single row and the double row configuration of trees, speed reduction was more pronounced for the single row with the same number of trees. For most cases, results at the centre of the skygarden achieved a R of less than 1. Figure 21 in Appendix provides a brief compilation of wind speeds at various locations for all vegetation configurations. Furthermore, adding more trees to a skygarden can become a potential way to improve the conditions at these regions. However, skygardens are usually limited in size and area which restricts the number of trees that can be planted. Therefore, proper arrangement of vegetation is crucial for skygarden performance.
Regions with higher wind velocity indicated higher discomfort for occupants, but it can greatly decrease the temperature. To achieve the best conditions for occupants, a balance between both the wind velocity and temperature should be acquired. Trees within the skygarden acted as a heat sink, which reduced the temperature by up to 1 °C. Based on both wind and temperature analysis, Case D with 5 trees placed along a single row provided an optimal scenario. It attained the largest impact on the enhancement of the wind and thermal comfort conditions within the skygarden while ensuring the use of fewer trees. A lower number of trees also eliminates visual obstruction for occupants wanting to experience a bird's eye view of the surrounding.
Comparing the results analysed using the wind comfort criteria and temperature distribution, the thermal comfort analysis based on the PMV model suggests all vegetation cases can meet the thermal comfort zone with a neutral sensation. Case I achieved the highest wind comfort levels and the greatest reduction in temperature. Effectively, Case D provided optimal aero-thermal results. A PMV of 0.07 with 5% occupancy dissatisfaction and the highest cooling effect of 4.1 °C suggests the prediction of a more comfortable skygarden would be accomplished.
The present model adopted a simplified vegetation model to determine the wind quality in skygarden. It also did not account for solar radiation and the benefits of vegetation in providing shading. This could significantly improve the skygarden performance. Future studies could aim to implement a detailed thermal model of the trees and account other environmental parameters to determine the occupants' experience in the skygarden.
Further analysis of the impact of vegetation in skygardens is needed, taking into consideration various tree shapes and sizes as well more diverse arrangements and additional architectural features such as planters and railings. This includes the considerations towards the ideal number of trees present and whether trees should be placed on both windward and leeward sides of the skygarden. Since skygardens appears in different shapes and form, assessment of vegetation configurations towards different skygarden building designs and the consideration of other vegetation types such as grass could be a potential pathway for exploration. Research is also needed in building physics and hygrothermal performance of such semi-enclosed space in buildings which are covered with vegetation.
The authors would like to thank the support of The University of Nottingham Department of Architecture and Built Environment for providing the facility for carrying out the modelling and simulations. The authors would also like to thank the Faculty of Engineering for the scholarship and the PhD studentship from EPSRC, Project References: 2100822 (EP/R513283/1).
- ,
Trends in the Air Temperature of Transitional Spaces of a High-Rise Office Building: The Effects of Season and Location ,Indoor and Built Environment , Vol. 23 (8),pp 1117-1128 , , https://doi.org/https://doi.org/10.1177/1420326X13499361 - , , The Environmental Performance of Tall Buildings, 2010
- , , Ph.D. Thesis, 2018
- ,
Thermal Effects of Open Space with a Green Area on Urban Environment: Part I: A Theoretical Analysis and its Application ,Journal of Architecture, Planning and Environmental Engineering (Transactions of AIJ) , Vol. 448 ,pp 15-27 , 1993, https://doi.org/https://doi.org/10.3130/aijax.448.0_15 - ,
Numerical Simulation of Cooling Effect of Vegetation Enhancement in a Subtropical Urban Park ,Applied Energy , Vol. 192 ,pp 178-200 , 2017, https://doi.org/https://doi.org/10.1016/j.apenergy.2017.01.079 - ,
Influence of Evaporative Cooling by Urban Forests on Cooling Demand in Cities ,Urban Forestry and Urban Greening , Vol. 37 ,pp 65-73 , 2019, https://doi.org/https://doi.org/10.1016/j.ufug.2018.07.023 - ,
Lowering the Outdoor Temperature in High-Rise High-Density Residential Developments of Coastal Hong Kong: The Vegetation Influence ,Building and Environment , Vol. 43 (10),pp 1583-1595 , 2008, https://doi.org/https://doi.org/10.1016/j.buildenv.2007.10.003 - , , Proceedings of the CTBUH 2008 8th World Congress, 2008
- , , The Skycourt and Skygarden: An Historical Overview
- ,
Green Plot Ratio: An Ecological Measure for Architecture and Urban Planning ,Landscape and Urban Planning , Vol. 63 (4),pp 197-211 , 2003, https://doi.org/https://doi.org/10.1016/S0169-2046(02)00191-3 - ,
Challenges and Strategies for Greening the Compact City of Hong Kong ,Journal of Urban Planning and Development , Vol. 138 (2),pp 101-109 , 2012, https://doi.org/https://doi.org/10.1061/(ASCE)UP.1943-5444.0000076 - ,
Pedestrian Wind Conditions at Outdoor Platforms in a High-Rise Apartment Building: Generic Sub-Configuration Validation, Wind Comfort Assessment and Uncertainty Issues ,Wind and Structures , Vol. 11 (1),pp 51-70 , 2008, https://doi.org/https://doi.org/10.12989/was.2008.11.1.051 - ,
Pedestrian Wind Conditions at Outdoor Platforms in a High-Rise Apartment Building: Generic Sub-Configuration Validation, Wind Comfort Assessment and Uncertainty Issues ,Building and Environment , Vol. 106 ,pp 313-326 , 2016, https://doi.org/https://doi.org/10.1016/j.buildenv.2016.07.004 - ,
Numerical Analysis of the Wind and Thermal Comfort in Courtyards Skycourts in High Rise Buildings ,Journal of Building Engineering , Vol. 24 ,pp 100735 , 2019, https://doi.org/https://doi.org/10.1016/j.jobe.2019.100735 - ,
Numerical Investigation of the Wind and Thermal Conditions in Sky Gardens in High-Rise Buildings ,Energies , Vol. 12 (7),pp 1380 , 2019, https://doi.org/https://doi.org/10.3390/en12071380 - ,
Comparison of Measurements on the CAARC Standard Tall Building Model in Simulated Model Wind Flows ,Journal of Wind Engineering and Industrial Aerodynamics , Vol. 6 (1-2),pp 73-88 , 1980, https://doi.org/https://doi.org/10.1016/0167-6105(80)90023-9 - , , Proceedings of the 11th Americas Conference on Wind Engineering, 2009
- ,
Numerical Evaluation of Wind Effects on a Tall Steel Building by CFD ,Journal of Constructional Steel Research , Vol. 63 (5),pp 612-627 , 2007, https://doi.org/https://doi.org/10.1016/j.jcsr.2006.06.033 - ,
Generating a Vision for Smart Sustainable Cities of the Future: A Scholarly Backcasting Approach ,European Journal of Futures Research , Vol. 7 (5), 2019, https://doi.org/https://doi.org/10.1186/s40309-019-0157-0 - ,
Vertical Cities ‒ The New Form of High-Rise Construction Evolution ,E3S Web of Conferences , Vol. 33 ,pp 01041 , 2018, https://doi.org/https://doi.org/10.1051/e3sconf/20183301041 - ,
Technological Advances and Trends in Modern High-Rise Buildings ,Buildings , Vol. 9 (9),pp 193 , 2019, https://doi.org/https://doi.org/10.3390/buildings9090193 - ,
Urban Heat Island Mitigation Strategies: A State-Of-The-Art Review on Kuala Lumpur, Singapore and Hong Kong ,Cities , Vol. 62 ,pp 131-145 , 2017, https://doi.org/https://doi.org/10.1016/j.cities.2016.09.003 - ,
Green Roofs and Facades: A Comprehensive Review ,Renewable and Sustainable Energy Reviews , Vol. 82 (Part 1),pp 915-939 , 2018, https://doi.org/https://doi.org/10.1016/j.rser.2017.09.106 - ,
Effectiveness of Vegetated Patches as Green Infrastructure in Mitigating Urban Heat Island Effects During a Heatwave Event in the City of Melbourne ,Weather and Climate Extremes , Vol. 25 ,pp 100217 , 2019, https://doi.org/https://doi.org/10.1016/j.wace.2019.100217 - ,
Simulation-Based Evaluation of the Effect of Green Roofs in Office Building Districts on Mitigating the Urban Heat Island Effect and Reducing CO2 Emissions ,Sustainability , Vol. 11 (7),pp 2055 , , https://doi.org/https://doi.org/10.3390/su11072055 - ,
Impact of Vegetation, Substrate, and Irrigation on the Energy Performance of Green Roofs in a Mediterranean Climate ,Water , Vol. 11 (10), 2016, https://doi.org/https://doi.org/10.3390/w11102016 - ,
Factors Influencing the Spatial Pattern of Sky Gardens in the Compact City of Hong Kong ,Landscape and Urban Planning , Vol. 101 (4),pp 299-309 , 2011, https://doi.org/https://doi.org/10.1016/j.landurbplan.2011.02.035 - Chicago, Illinois, USA, 2015, https://store.ctbuh.org/index.php?controller=attachment&id_attachment=32
- New York, USA, 2017, https://www.terrapinbrightgreen.com/wp-content/uploads/2015/11/Parkroyal_Case-Study.pdf
- , , The Skycourt and Skygarden, Greening the Urban Habitat 1st ed., 2014
- The Sky Neighborhood Layout, 2014, https://global.ctbuh.org/resources/papers/download/1633-the-sky-neighborhood-layout.pdf
- , , Approaches to Skycourt Design and Performance in High-Rise Office Buildings in a Temperate Climate, 2018
- ,
Parametric Study of the Influence of Environmental Factors and Tree Properties on the Transpirative Cooling Effect of Trees ,Agricultural and Forest Meteorology , Vol. 248 ,pp 259-274 , 2018, https://doi.org/https://doi.org/10.1016/j.agrformet.2017.10.014 - ,
Influence of Evaporative Cooling by Urban Forests on Cooling Demand in Cities ,Urban Forestry and Urban Greening , Vol. 37 ,pp 65-73 , 2019, https://doi.org/https://doi.org/10.1016/j.ufug.2018.07.023 - ,
Growth of Samanea Saman: Estimated Cooling Potential of This Tree in an Urban Environment ,Urban Forestry and Urban Greening , Vol. 41 ,pp 264-271 , 2019, https://doi.org/https://doi.org/10.1016/j.ufug.2019.03.021 - Geneva, Switzerland, 2017, https://www.euro.who.int/__data/assets/pdf_file/0010/342289/Urban-Green-Spaces_EN_WHO_web3.pdf%3Fua=1
- ,
Comparing the Transpirational and Shading Effects of Two Contrasting Urban Tree Species ,Urban Ecosystems , Vol. 22 ,pp 683-697 , 2019, https://doi.org/https://doi.org/10.1007/s11252-019-00853-x - ,
Pedestrian-Level Wind Conditions Around Buildings: Review of Wind-Tunnel and CFD Techniques and Their Accuracy for Wind Comfort Assessment ,Building and Environment , Vol. 100 ,pp 50-81 , 2016, https://doi.org/https://doi.org/10.1016/j.buildenv.2016.02.004 - ,
Pedestrian Wind Comfort Around Buildings: Comparison of Wind Comfort Criteria Based on Whole-Flow Field Data for a Complex Case Study ,Building and Environment , Vol. 59 ,pp 547-562 , 2013, https://doi.org/https://doi.org/10.1016/j.buildenv.2012.10.012 - ,
Development of a Computational Fluid Dynamics Model with Tree Drag Parameterizations: Application to Pedestrian Wind Comfort in an Urban Area ,Building and Environment , Vol. 124 ,pp 209-218 , 2017, https://doi.org/https://doi.org/10.1016/j.buildenv.2017.08.008 - ,
Thermal Comfort for Urban Parks in Subtropics: Understanding Visitors Perceptions, Behavior and Attendance ,Advances in Meteorology , Vol. 2013 , 2013, https://doi.org/https://doi.org/10.1155/2013/640473 - ,
A Review on the CFD Analysis of Urban Microclimate ,Renewable and Sustainable Energy Reviews , Vol. 80 ,pp 1613-1640 , 2017, https://doi.org/https://doi.org/10.1016/j.rser.2017.05.248 - ,
Measurement and CFD Simulation of Microclimate Characteristics and Transpiration of an Impatiens Pot Plant Crop in a Greenhouse ,Biosystems Engineering , Vol. 112 (1),pp 22-34 , 2012, https://doi.org/https://doi.org/10.1016/j.biosystemseng.2012.01.012 - , , Aerodynamic Optimisation of Sports Stadiums Towards Wind Comfort, 2017
- ,
Pollutant Concentrations in Street Canyons of Different Aspect Ratio with Avenues of Trees for Various Wind Directions ,Boundary-Layer Meteorology , Vol. 144 ,pp 41-64 , 2012, https://doi.org/https://doi.org/10.1007/s10546-012-9703-z - ,
Numerical Simulation of Atmospheric Pollutant Dispersion in Tree-lined Street Canyons: Comparison between RANS and LES ,Building and Environment , Vol. 46 (9),pp 1735-1746 , 2011, https://doi.org/https://doi.org/10.1016/j.buildenv.2011.01.032 - ,
Effect of Rooting Conditions on the Growth and Cooling Ability of Pyrus Calleryana ,Urban Forestry & Urban Greening , Vol. 10 (3),pp 185-192 , 2011, https://doi.org/https://doi.org/10.1016/j.ufug.2011.05.003 - ,
A Wind Tunnel Study on Aerodynamic Porosity and Windbreak Drag ,Forest Science and Technology , Vol. 7 (1),pp 8-16 , 2011, https://doi.org/https://doi.org/10.1080/21580103.2011.559939 - ,
CFD Analysis of Transpirational Cooling by Vegetation: Case Study for Specific Meteorological Conditions During a Heat Wave in Arnhem, Netherlands ,Building and Environment , Vol. 83 ,pp 11-26 , 2015, https://doi.org/https://doi.org/10.1016/j.buildenv.2014.04.022 - ,
Comparison of Various Revised k-ε Models and LES Applied to Flow Around a High-Rise Building Model with 1:1:2 Shape Placed Within the Surface Boundary Layer ,Journal of Wind Engineering and Industrial Aerodynamics , Vol. 96 (4),pp 389-411 , 2008, https://doi.org/https://doi.org/10.1016/j.jweia.2008.01.004 - , , Proceedings of the 11th Americas Conference on Wind Engineering, 2009
- , , Proceedings of the Fourth International Symposium on Computational Wind Engineering (CWE2006), 2006
- ,
The Wind Content of the Built Environment ,Journal of Wind Engineering and Industrial Aerodynamics , Vol. 3 (2-3),pp 93-105 , 1978, https://doi.org/https://doi.org/10.1016/0167-6105(78)90002-8 - , , Proceedings of the 6th European and African Wind Engineering Conference (EACWE2013), 2013
- ,
Appropriate Boundary Conditions for Computational Wind Engineering Models Revisited ,Journal of Wind Engineering and Industrial Aerodynamics , Vol. 99 (4),pp 257-266 , 2011, https://doi.org/https://doi.org/10.1016/j.jweia.2010.12.008 - , , CBE Thermal Comfort Tool, Center for the Built Environment, 2017
- , 2020, https://www.travelchinaguide.com/climate/hongkong.htm