


The transformation of the German energy system (also known as “Energiewende”) is of high importance. Innovative energy technologies are able to make a considerable contribution to this transformation process. However, in order to analyse greenhouse gas reduction potentials without losing track of other associated effects, a comprehensive sustainability assessment is necessary. Beside other environmental impacts, this should also include economic as well as social implications [3]. Soares et al. [4] gave a comprehensive overview of important issues for sustainability in future energy systems. Their main conclusion for future research is that an “understanding of the whole supply chain – from energy provision to end-use consumption – as well as the technical, economic, environmental and governance factors needed to manage and transition current energy systems towards sustainable energy systems” [4] is crucial. For waste-to-energy systems, Chong et al. [5] suggested a sustainability metric highlighting the importance of assessing the three dimensions of sustainability simultaneously. Generally, each technology has specific techno-economic and environmental characteristics, challenges and constraints. For their further improvement and decision regarding their implementation, a comprehensive (i.e. respecting all dimensions of sustainability) and prospective impact analysis of these technologies is needed. However, there is no agreed-upon method to assess the prospective sustainability of energy technologies contributing to the objective of European and national climate neutrality by 2050 in a holistic and systematic way, neither on technology nor on systems level [6]. Based on these thoughts, the joint Helmholtz Initiative “Energy System 2050” (ES 2050) [7] is developing an interdisciplinary approach for sustainability assessment of future-oriented technologies and applies it across different innovative energy technologies, i.e. production of fuels, electricity and heat from residual lignocellulose biomass, battery energy storage and hydrogen for cross-sectoral applications. The backbone of this approach are life-cycle oriented methodologies, i.e. Life Cycle Assessment (LCA) and Life Cycle Costing (LCC). These enable to take not only direct impacts into account but also upstream processes and possible burden shifting from greenhouse gas emissions to other environmental impacts or costs. The social dimension is assessed with a focus on more direct effects; here three aspects are picked as examples, which include social acceptance of technologies, patent analysis and added value due to new production routes.
Hydrogen is such an innovative energy technology. This energy carrier has the potential to serve as a fuel for mobility applications, as a storage medium for generated electricity to balance out the electricity grid, for heat and electricity production in households as well as businesses and as feedstock for industry, e.g. steel production or refineries [8]. The cornerstone for these applications is hydrogen production that is low in emissions. This has often been assessed from a techno-economic and environmental perspective. However, the additional consideration of social aspects to perform a comprehensive sustainability assessment is still an exception. Stefanova et al. [9] used hydrogen production from biomass as an example to perform an extensive goal and scope definition but stopped there and did not perform an analysis. Wulf et al. [10] used hydrogen production to test their indicator selection based on the Sustainable Development Goals. However, the authors have not presented a consistent description of the inventory and did not discuss the results regarding trade-offs. The group of Ren [11] focused more on the mathematical linking of indicators using multi-criteria decision analysis (MCDA). Weighting factors for the different indicators were derived by expert solicitation, but they focused on a limited set of sustainability indicators. For several hydrogen production and storage options, Acar and Dincer [12] performed a literature review and evaluated different sustainability indicators including several technical indicators. However, by taking only literature data, no joint system boundary is achieved. Furthermore, the analysis did not take the different technology readiness levels of the analysed technologies into account, which makes a comparison very complicated. Several other publications took a similar path. Ren et al. [13] developed an MCDA approach using Fuzzy Best-Worst Method to determine the weights of the criteria and the fuzzy Technique for Order Performance by Similarity to Ideal Solution (TOPSIS) for the ranking of hydrogen production technologies. For the same type of technologies, Xu et al. [14] used interval best-worst method (IBWM), interval entropy technique (IET) and interval best-worst projection (IBWP) for the ranking and Li et al. [15] applied the decision-making trial and evaluation laboratory method and the grey relational analysis. However, the merit of these publications lies in the MCDA and not in the consistency of modelling hydrogen supply chains. Valente et al. [16] followed a different procedure by performing a Life Cycle Sustainability Assessment (LCSA) on hydrogen production by biomass gasification.
The approach applied in this paper does not focus on MCDA because several papers have already tackled this problem and is out of scope of the ES 2050 approach. What is lacking is more a consistent indicator selection based on the ES 2050 approach and modelling of the three dimensions of sustainability, taking not only technical, economic and environmental aspects into account but also social aspects. Technologically, the focus is on the total supply chain of hydrogen rather than different hydrogen production technologies.
Alkaline water electrolysis has proven to be an excellent technology for hydrogen production coupled with photovoltaics or wind power [17]. Wind power is selected as the renewable energy source because it is a promising option under the circumstances given in Germany. The reference region Germany is one of the boundaries of the ES 2050 project together with the technological development until 2050. As field of application, hydrogen mobility by fuel cell electric vehicles (FCEV) is selected as an example. Within the project, the described approach is applied for the reference year 2015 as well as for the target year 2050. All aspects of the case study are developed in the respective section; but at first, the overall ES 2050 approach is introduced with a more detailed presentation of the different sustainability indicators.
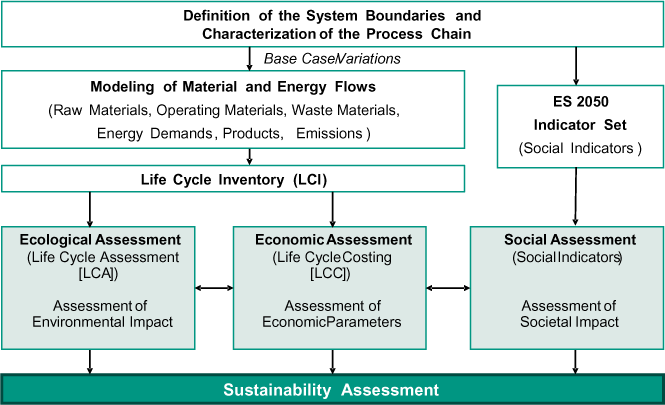
Backbone of a transparent and comprehensive sustainability assessment approach is a detailed modelling of material and energy flows between processes of the systems investigated. In a future-oriented ecological and economic assessment (LCA and LCC), systems are analysed from a life cycle perspective (Figure 1). The extensively assessed economic indicators and ecological impact categories are complemented by social indicators evaluating hot spots for certain social topics. Pre-selected social issues are acceptability, innovation potential and added value. An equally comprehensive assessment of social impacts for innovative technologies is not possible at the moment and subject to further research.
Joint sustainability assessment approach of energy technologies based on [2]
The social assessment takes only specific elements of the process chain into consideration. “Social acceptance” of hydrogen transport can affect different aspects. Thesen and Langhelle [18] analysed the public perception of hydrogen refuelling stations and FCEVs in the neighbourhood of people. More questions with a broader range of technology were asked by Zimmer and Welke [19]. In their questionnaire, also risk perception and the attitude towards “green” hydrogen was assessed as well as aspects regarding hydrogen production and storage. Based on these findings, hydrogen refuelling stations turn out to be the most critical part of the process chain, because not only the person actively choosing to buy and drive an FCEV has to be convinced by the new technology, but also residents near the refuelling station should tolerate the technology. This is evaluated by analysing the public perception of this technology. A second social aspect analyses patents to express a technology’s innovation potential. This analysis is employed for alkaline electrolysers. A third social indicator reflects possible impacts of the new technology regarding local employment. This is assessed by analysing the cost structure of the technology and classifying the costs in tradable and non-tradable parts. Further information on the applied methods is provided in this section.
LCA is an established method to evaluate environmental impacts of technologies, products or services. Its methodology has been enhanced for decades, its basic approach is described in international standards ISO 14040 [20] and ISO 14044 [21] and it was specified for Europe by the International Reference Life Cycle Data System (ILCD) [22]. Based on their recommendations [23], the twelve most agreed-upon environmental impact categories were chosen for the assessment (Table 1).
Assessed environmental impact categories, based on ILCD recommendations [23]
Impact category |
Ecologial Indicator |
Unit |
Acidification |
Accumulated Exceedance (AE) |
Mole H+ eq. |
Climate change |
Global warming potential 100a |
kg CO2-eq. |
Eutrophication, aquatic, freshwater |
Fraction of nutrients reaching freshwater end compartment (P) |
kg P eq. |
Human toxicity, carcinogenics |
CTU-h |
|
Human toxicity, non-carcinogenics |
CTU-h |
|
Ionising radiation, human health |
Human exposure efficiency relative to U235 |
kg U235 eq. |
Eutrophication, aquatic, marine |
Fraction of nutrients reaching marine end compartment (N) |
kg P eq. |
Ozone depletion |
Ozone depletion potential |
kg CFC-11 eq. |
Particulate matter/Respiratory inorganics |
Intake fraction for fine particles |
kg PM2.5 eq |
Photochemical ozone formation |
Tropospheric ozone concentration increase |
kg C2H4 eq. |
Resource depletion, mineral, fossil and renewable |
Scarcity |
kg Sb eq. |
Eutrophication, terrestrial |
Accumulated Exceedance (AE) |
Mole N eq. |
The software openLCA 1.7 [24] was used with the ecoinvent 3.3 database [25] for background data. For the assessment, the openLCA Life Cycle Impact Assessment methods v2 were applied.
The calculation of technologies’ life cycle costs was based on the equivalent annual costs. The levelised costs are calculated as described in eq. (1) [26]:
(1)
T- depreciation period; t- year of business; I- capital expenditure; O- operating and maintenance costs; C- expenditures on consumables; R- revenue; H- net production; r- discount rate; c- levelised production costs.
For the sustainability assessment, different actors like investors, society, consumers etc. can be taken into account. Here a systemic view of the total national economy was used, not a business perspective. Therefore, the depreciation period was equivalent to the lifetime of the systems and the discount rate varied between 1.5 and 3.5% based on German government bonds.
The assessment of the social dimension of sustainability can be designed in many ways. Rather basic approaches take human health impacts from LCA to assess societal issues, e.g. [27]. Another approach is social LCA according to the UNEP/SETAC guidelines [28], with a clear focus on the whole product life cycle. These assessments can either evaluate social issues of a specific process [29] or be a more generic hot spot analysis [30]. Furthermore, social indicators can tend to be socio-political [31] or socio-economic [32], while the economic dimension is assessed by a more business-oriented approach. In addition, socio-technic aspects are of interest. These include hazards and safety implications. Hydrogen emissions are still the cause of several accidents [33] and risk assessments are necessary [34].
A general pre-condition of the ES 2050 project is that newly developed energy technologies need to be innovative, accepted by the public and, in the best case, generate new employment in Germany. It was decided to concentrate on the conditions in Germany in a first step and not on aspects related to foreign supply chains. Based on these considerations, three topics were selected for the social assessment, which are fit to assess process chains. These topics include acceptance and user concerns, patents and local added value. Patents and local added value, however, might also be considered as macro-economic indicators. This shows how closely the three dimensions are connected – a clear distinction is not always possible. One indicator might evaluate more than one sustainability aspect. There are sustainability concepts available that do not rely on the distinction of three dimensions, e.g. [35]. However, this discussion goes beyond the aim of this paper. Further development of this approach will consider additional social indicators, which will cover other aspects of social sustainability, e.g. working conditions.
Acceptance and user concerns. To assess the public concerns towards hydrogen technologies, which need to be taken into account during implementation, an online survey was conducted. The study was developed using the methodological and technological background of Huijts et al. [36], [37] and Miguel et al. [38], [39]. In a first step, the questionnaire introduced the considered technology. In a second step, the interviewee was asked to indicate which effects they are concerned about with regard to the introduced technology. Participants were provided with a multiple-choice list of seven aspects and a blank text box for further concerns:
Electrosmog,
Odour pollution,
Noise pollution,
Air pollution,
Fire hazard,
Explosion hazard,
Negative effects on landscape or cityscape,
Others [to be specified in a text box].
Furthermore, sociodemographic data were collected regarding gender, population of the place of residence, income situation, profession, age and education of the interviewee. The online platform Sosci-Survey was used for conducting the survey. This platform is freely available for non-commercial use. In preparation of the questionnaire, a cognitive pre-test with five persons and a standard pre-test with ten persons was carried out.
A total of 211 data sets was gathered, 141 samples for biofuels and storage and 70 for the hydrogen refuelling station. The evaluation of the overall sociodemographic data showed that participants were predominantly male, aged between 25 and 29 years, had a university degree, were in employment with a higher income and lived in rather rural areas. For the hydrogen refuelling station, however, the participants were predominantly students. A detailed description of the approach and additional results for the other two ES 2050 technologies, straw based biofuels and battery storage, can be found in Emmerich et al. [40].
Patents. Information contained in patent applications enable in-depth assessments of national policies and allow the analysis of technological life cycles [41]. The overall goal was to assess the innovation potential of a country regarding a specific technology.
With this specific approach, two different aspects of patents were analysed. The first aspect is related to country of origin. The patent activity in a certain technology field was one indicator for this aspect. By analysing this indicator, not only the R&D activities of a specific country were evaluated with regard to its technological and commercial interest [42]. It was also possible to compare these with the R&D activities of other countries in the same technology field. Looking at a second indicator, the size of patent families were evaluated. If a patent does not stand alone but is part of a patent family, the applicant is more interested in protecting their innovation in multiple markets [42]. The effort a country is putting into the development of a certain technology compared to its overall number of patents was analysed with the indicator “national technology share”. A comparison of this indicator’s impact with the impacts of the same indicator in other countries or for other technologies can highlight its importance. The growth potential of a technology was characterised by the growth rate of patents, which is also called technology potential [43]. A high patent growth rate can indicate a high technology potential due to increased research effort in the area [44]. The last indicator dealing with national/international aspects was the national innovation potential. This indicator describes the efforts of a country in relation to its purchasing power parity (PPP) [45]. The absolute number of registered patents in a country might be small but the relation to its PPP shows the effort of this country in a technology field or its disinterest.
The second aspect considered here focused on the technological life cycle of an innovation with the intent to assess future R&D trends. The life cycle was depicted by the number of patent applications over time (e.g. years). According to Ernst [42] and Chanchetti et al. [41] four different phases in the technology life cycle can be distinguished:
An emerging phase of new technology initially with stable patent activity and an abruptly increasing activity (representing the end of development phase);
A consolidation phase with decreasing growth of patent activities due to new focus on first experiences with the new technology;
A market penetration phase with strong growth of patent activities as new companies start to file patents in the area;
A maturity phase where the peak can be seen as breakthrough and technology reaches maturity.
The first two phases together can also be considered as a hype cycle or expectation phase. Based on this life cycle, the R&D “level” can be estimated. All indicators are summarised in Table 2.
Summary of analysed patent indicators
Patent indicator |
Definition |
Meaning |
Patent activity |
Sum of patents of a technology in a country |
Extent of R&D expenditures |
International scope |
Size of patent family share |
Economic quality of a country’s total patent activity |
Technology life cycle |
Sum of yearly patents and shape of approximated technology life cycle curve (5th degree polynomial regression) |
Level of technology within technology life cycle, estimation of further development |
National technology share |
Number of patents in this field in relation to all national patents |
Relevance of a certain technology for a country |
Technology potential |
Patent growth rate in % of this technology for a defined time period |
Growth potential of the technology |
National innovation potential |
Number of patents of a technology in relation to its purchasing power parity |
R&D efforts of a country with regard to its economic potential |
For a better visualization of the patent indicators and comparison of different countries, a portfolio analysis was suggested [42]. For the portfolio analysis, the five countries with the most patent applications in the analysed time span were considered plus Germany. If Germany was one of the top five countries, only these five were compared. The x-axis represents the number of patents in relation to its purchasing power parity (c). The y-axis describes the growth rate of patents in the considered time span (technology potential) and the bubble size visualises the ration between patents in this field of technology and the total number of patents in the analysed country (National technology share). An extended description of the approach is presented in Baumann et al. [46].
The patent analysis was performed exemplarily for the alkaline water electrolysis. The search term “cl=C25B1 or cl=C25B9 or cl=C25B11 or C25B13 or C25B15 or cl=Y02E60/366 and ti=electroly* and ti=alkaline” returned 195 results on the Espacenet database from the European Patent Office on March 11th 2019 [47].
Local added value. The assessment of potential job creation requires complex input/output models to evaluate not only direct effects due to new production facilities but also indirect effects due to changed employment in other industry branches [48]. Only a streamlined approach could be implemented due to restricted resources. Therefore, solely direct effects were modelled by a surrogate of invested money into the analysed energy technology. This was based on the premise that locally invested money most likely also creates or secures local jobs. In contrast, components purchased globally will not contribute to further job growth in the assessed country or region. As a result, investment as well as operation and maintenance costs were divided in three categories:
Domestic added value,
Potential domestic added value,
Non-domestic added value.
An example for this is the automotive industry in Germany. The internal combustion engine of a German car manufacturer is designed and constructed in Germany whilst the battery for a battery electric vehicle of the same car manufacturer is designed and constructed in Asia. As a consequence, a higher share of battery electric vehicles in Germany will probably result in job loss within the automotive industry [49]. The aim of this indicator is to give a qualitative indication regarding whether the new energy technology might have a positive effect on job development in comparison to a conventional technology.
For the implementation of the indicator, the detailed data basis of the economic assessment was used and each cost component was categorised accordingly. Three separate cost assessments were carried out, each with the cost components of its respective class only, i.e. domestic added value. Subsequently, shares of the total costs can be calculated for the three classes.
To test the sustainability assessment approach for innovative energy technologies that was developed for ES 2050, a case study on hydrogen mobility was carried out. The goal was to assess hydrogen as an alternative fuel for passenger cars in Germany. Although the supplied hydrogen could also be used in public buses or light duty vehicles, in this case the passenger car was chosen for the investigation.
Hydrogen for mobility applications has a chance to be climate-friendly only when produced from renewable energy sources [50]. As done in this paper, a case study for Germany is discussed with wind power as an appropriate renewable energy source. The generated electricity was used in an alkaline water electrolyser. To account for the non-stable electricity supply, the full load hours of the electrolyser are adjusted accordingly. Afterwards it was stored and transported to the hydrogen refuelling stations to be dispensed to FCEVs (Figure 2).
Case study hydrogen mobility, icons from [1]
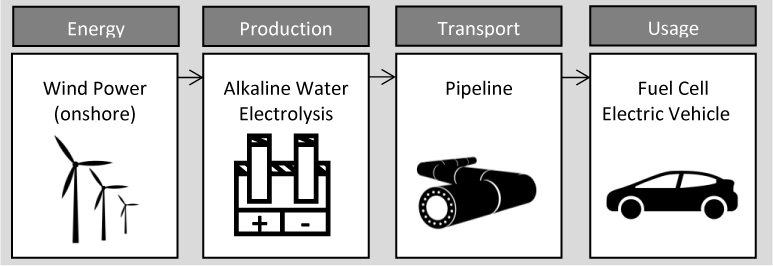
For transport and distribution of hydrogen, different technologies are available. Currently, the most common method of transporting gaseous hydrogen in high pressure tanks and liquid hydrogen in cryogenic tanks is by truck. Alternatively, hydrogen storage and transport in liquid organic hydrogen carriers (LOHCs) by truck was considered. The fourth alternative analysed was the construction of a new hydrogen pipeline network in Germany. In order to be independent from the fluctuations of wind power availability, hydrogen needs to be stored, if necessary for months. Therefore, for gaseous hydrogen transport, seasonal storage in salt caverns was taken into account. Liquid hydrogen as well as hydrogen in LOHCs can be stored in appropriate tanks. The most important technical parameters for the sustainability assessment are summarised in Table 3.
Most important technical parameters of the analysed systems
Unit |
2015 |
2050 |
Source |
|
Hydrogen production |
||||
Hydrogen production |
Mio t/a |
low |
1.51 |
Calculations based on [51] |
Full load hours electrolyser |
h/a |
3260 |
3260 |
[52] |
Capacity electrolyser |
MW/unit |
6 |
100 |
[52] |
Number of electrolysers (DE) |
1 |
227 |
Own calculations |
|
Stack lifetime electrolyser |
h |
60,000 |
83,000 |
|
Stored hydrogen |
% |
33.3 |
33.3 |
[56] |
Hydrogen storage capacity per cavern |
m3 |
500,000 |
500,000 |
|
Hydrogen transport |
||||
Hydrogen transport distance |
km |
400 |
400 |
|
Average truck velocity |
km/h |
50 |
50 |
[58] |
Diesel demand truck |
l/100km |
32 |
25 |
|
Lifetime truck |
years |
14.3 |
14.3 |
[60] |
(Un)loading time at HRS GH2/LH2/LOHC |
h |
1.5/3.0/1.5 |
1.5/3.0/1.5 |
[58] |
Pressure gaseous H2 trailer |
bar |
500 |
500 |
[61] |
Capacity gaseous H2 trailer |
kg |
1100 |
1100 |
[61] |
Capacity liquid H2 trailer |
kg |
4300 |
4300 |
[62] |
Capacity LOHC trailer |
kg |
1800 |
1800 |
[63] |
Capacity hydrogenation/liquefaction |
t/d |
50 |
50 |
[64] |
Full load hours hydrogenation/liquefaction |
h/a |
7500 |
7500 |
Own assumption |
Catalyst demand ((de)hydrogenation) |
mg/kg H2 |
60.4 |
60.4 |
Based on [63] |
DBT loss (de)hydrogenation |
% |
0.2 |
0.2 |
[63] |
H2 loss (de)hydrogenation |
% |
2 |
2 |
[63] |
Outlet pressure dehydrogenation |
bar |
1 |
1 |
[63] |
Heat demand dehydrogenation |
kWh/kg H2 |
9.5 |
9.5 |
[63] |
Electricity demand (de)hydrogenation |
kWh/kg H2 |
0.733 |
0.733 |
Based on [63] |
Electricity demand pipeline transport |
kWh/kg H2 |
1.27 |
1.27 |
Based on [65] |
Electricity demand liquefaction |
kWh/kg H2 |
11.8 |
6.76 |
|
Hydrogen loss liquefaction |
g/kg H2 |
16.2 |
16.2 |
[64] |
Length transmission pipeline |
km |
5660 |
5660 |
Based on [67] |
Length distribution pipeline |
km |
46,600 |
46,600 |
Based on [67] |
Hydrogen refuelling station |
||||
Number of HRS (DE/WW) |
21/ 185 |
5050/ 44,500 |
||
Capacity HRS |
kg/day |
350 |
850 |
Own assumption |
Capacity utilization HRS |
% |
70 |
70 |
Own assumption |
Electricity demand HRS GH2/Pipeline/LH2/LOHC |
kWh/kg H2 |
0.80c/2.20d/0.50e/4.36f |
0.80c/2.20d/0.50e/4.36f |
Own calculations, [70] |
Hydrogen loss LH2 |
g/kg H2 |
30 |
30 |
[58] |
Hydrogen loss Pipeline/GH2/LOHC |
g/kg H2 |
5 |
5 |
[62] |
DE- Germany, WW- World wide, HRS- hydrogen refuelling station, GH2- gaseous hydrogen, LH2- liquid hydrogen, LOHC- liquid organic hydrogen carrier
More detailed information on hydrogen transport and storage as well as the modelling of the LCA inventory can be found in [71] and [72]. The detailed LCA for the FCEV can be found in [73]. The costs deriving from the designed system are summarised in Table 4.
Economic parameters of the analysed systems
Unit |
2015 |
2050 |
Source |
|
Investment costs |
||||
Electrolyser |
€/kW |
1,330 |
608 |
[52] |
Hydrogen storage cavern |
€/unit |
56,200,000 |
44,700,000 |
[52] |
Hydrogen refuelling station gas/liquid supply |
€/unit |
2,210,000/2,060,000 |
2,040,000/1,900,000 |
|
Transmission/distribution pipeline |
bn € |
2.28/16.0 |
2.28/16.0 |
|
Hydrogenation (central)/Dehydrogenation (decentral) |
€ |
1,900,000/94,400 |
1,900,000/94,400 |
[63] |
Liquefaction |
Mio € |
109 |
109 |
[64] |
Truck |
€/unit |
160,000 |
160,000 |
[62] |
Trailer (gas, liquid, LOHC) |
€/unit |
792,000/860,000/150,000 |
275,000/860,000/150,000 |
|
Operation costs |
||||
Electricity from wind power |
€ct/kWh |
8.98 |
6.07 |
[51] |
Grid mix electricity |
€ct/kWh |
7.41 |
11.37 |
[51] |
Diesel |
€/l |
0.91 |
0.91 |
|
Plant operator |
€/h |
20.50 |
20.50 |
|
Technician |
€/h |
30.30 |
30.30 |
|
Site manager |
€/h |
47.50 |
47.50 |
|
Truck driver |
€/h |
26.5 |
26.5 |
|
Cavern operation costs |
€/a |
1,490,000 |
1,490,000 |
[57] |
For the calculation of the future costs of hydrogen refuelling stations, a learning and economy of scale approach (eq. (2)) is followed based on Melaina and Penev [75]:
(2)
C1 - station capital cost; C0 - base station capital cost; Q1 - station capacity (kg/day); Q0 - base station capacity (kg/day); n1 - number of hydrogen refuelling stations; no - number of hydrogen refuelling stations at cost status of base station; α - scaling factor (0.707); β - learning factor (-0.106).
The application of this learning curve approach requires that not only the expansion of hydrogen mobility in Germany proceeds as described in Pregger et al. [51], but also in the global scale hydrogen mobility increases in the same rate. For calculating the current capital costs of the hydrogen refuelling station, the HRSAM model from the Argonne national laboratory was used [74].
The presented approach for sustainability assessment in combination with the described case study provided a plethora of possible results. A selection of these results will be presented and discussed.
For the environmental assessment, three impact categories were selected exemplarily for all analysed impact categories (acidification, climate change and eutrophication, terrestrial). These impact categories were applied to the four options of hydrogen supply for the year 2050 and their results are shown in Figure 3.
Environmental impacts for hydrogen supply options in 2050: CG H2-Compressed gaseous hydrogen, LH2-Liquid hydrogen; LOHC-Liquid organic hydrogen carrier
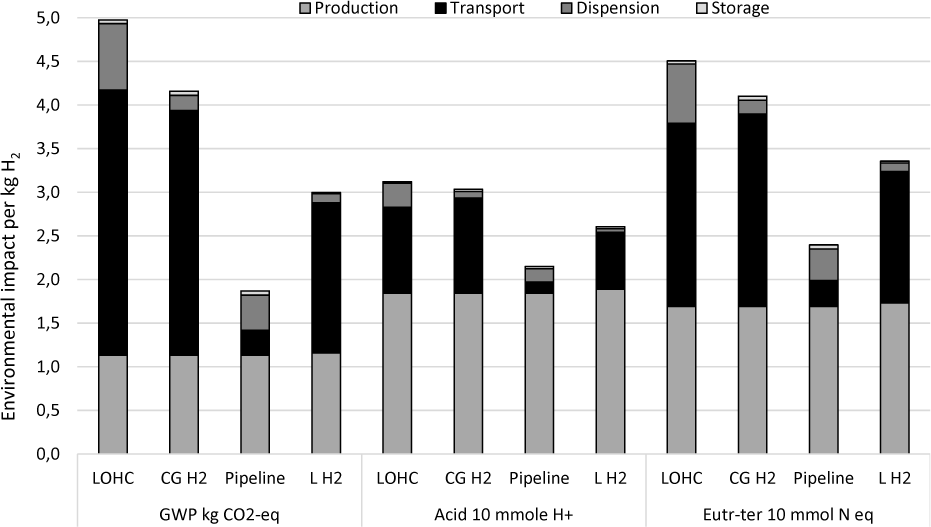
The lowest impact was always achieved in the pipeline option, regardless of the analysed impact category. The same applies to the transport of liquefied hydrogen: it always showed the second lowest environmental impacts. Comparing the transport of gaseous hydrogen with hydrogen bound in LOHCs, no clear statement is possible. From a climate and eutrophication (terrestrial) perspective, gaseous hydrogen transport is more advantageous, while for acidification the impact is too similar in value for a differentiation to be made. The importance of the different process steps, i.e. hydrogen production, transport, storage and dispension, varied for the different impact categories. For climate change, transport was determining the results. The different characteristics of the assessed options clearly influence the results. For LOHC, the heat demand for dehydrogenation is most influential, while for compressed hydrogen, the lower transport capacity in the trucks lead to more emissions and for liquefied hydrogen, it is the electricity demand for the liquefaction. In the other impact categories, transport is less dominant and instead, hydrogen production comes into focus. More detailed results for the environmental assessment of alkaline water electrolysis can be found in [53], while LOHC based transport in 2050 is discussed further in [71] and [72].
The costs for hydrogen supply in 2050 are presented in Figure 4 in comparison to the costs that would occur if hydrogen were supplied today. The error bars show the range of results for varying discount rates (1.5 – 3.5%). It has to be noted that for the LOHC option the investment costs are connected with higher insecurities than for the other options because no commercial hydrogenation and dehydrogenation plants were running in the reference year.
Levelized costs of hydrogen supply options for 2015 and 2050: CG H2-Compressed gaseous hydrogen; LH2-Liquid hydrogen; LOHC-Liquid organic hydrogen carrier
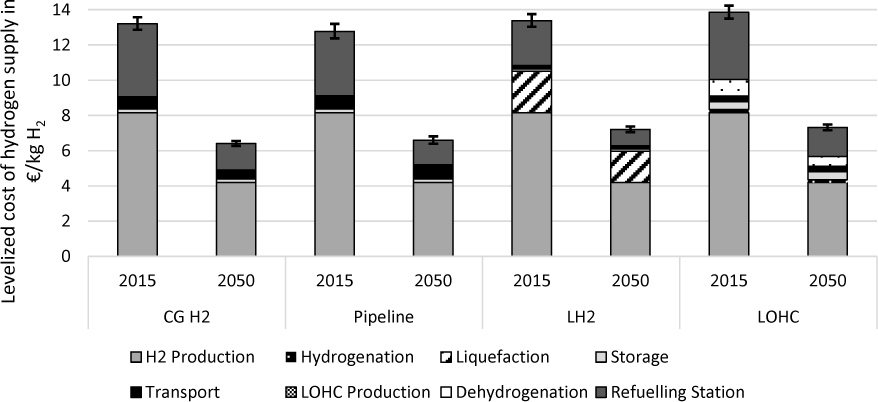
For all options, a significant reduction could be achieved due to lower electricity generation costs of wind power for the hydrogen production and lower investment costs of alkaline electrolysers and hydrogen refuelling stations. The reduction of investment costs was realized by higher production volumes (economy of scale) and bigger plants. The most expensive process in the hydrogen supply chain is hydrogen production (between 57% and 65% of the total costs in 2050) due to the electricity costs of wind power. The transport options of liquid hydrogen and LOHCs, however, added significant costs to the overall process chain due to additional investment costs and higher operational costs for electricity (liquefaction) and natural gas (dehydrogenation). The costs for storage are very low for the assessed options, even though high initial investments, e.g. for the underground storage, are necessary. When allocated to the total amount of hydrogen produced, these end up very low. The costs for hydrogen supplied by pipelines and high-pressure trailers are very close together. A slight preference for high-pressure trailers can be observed (3.0% difference). A more detailed assessment of the parameters driver wage, future diesel demand for trucks, investment costs for pipelines and the electricity demand for recompression within the pipeline is necessary to conclude on the most cost efficient supply chain.
Regarding the social aspects, survey participants chose explosion hazard as the most pressing concern (Figure 5). A possible fire hazard was also a matter of concern for the respondents.
Citizen concerns about hydrogen refuelling stations, based on [40]
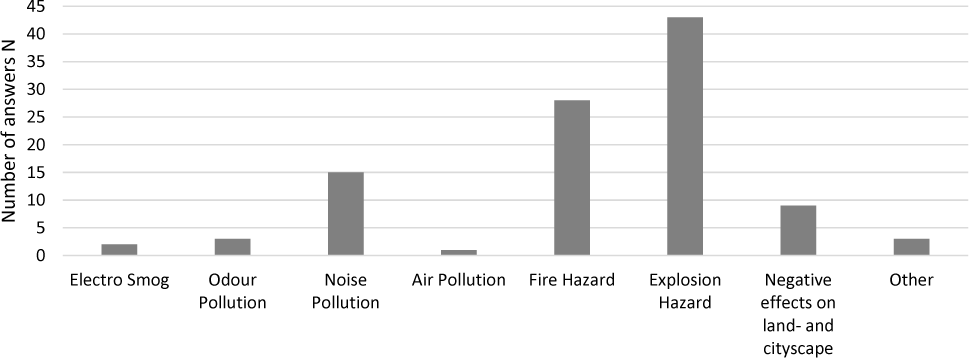
Other concerns of the people did not refer to hydrogen itself but to the refuelling station regardless of the dispensed fuel. This is not only visible in the number of answers for noise pollution and negative effects on land- and cityscape, but also in the submitted comments. Further comments dealt with the competition to other technologies, e.g. less funding for charging points for battery electric vehicles or the competition for land between food and energy crops. The interviewees were also asked to state the level of knowledge they had about the technologies. For the hydrogen refuelling station, 64% stated that they had known nothing or only very little about it before the study. This was also reflected in some of the answers. Hydrogen is an odourless gas, which makes odour pollution very unlikely. Additionally, FCEVs’ only emission is water so that from them and from a hydrogen refuelling station, very little odour pollution can be expected.
For the patent analysis, the portfolio diagram for alkaline water electrolysis for the years 2016 until 2018 is presented as one result (Figure 6). This diagram incorporates the indicators national technology share (bubble size), technology potential/ patent dynamic (y-axis) and national innovation potential/ patents per PPP (x-axis).
Portfolio diagram of three patent indicators for alkaline water electrolysis for the years 2013 to 2018: CN-China; DE- Germany; JP-Japan; KR- South Korea; US-United States of America; PPP- purchasing power parity [46]
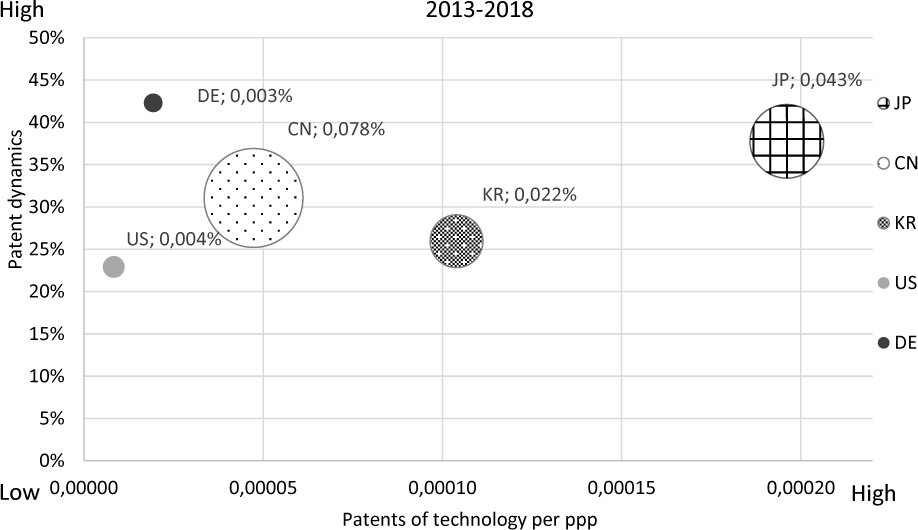
Over the considered time period (1995 until 2018), Japan issued most of the patents. In the past years, however, China has increased its patent activity tremendously and holds most issued patents in relation to all technologies in their country (Figure 6). Germany shows the highest patent dynamic, even though it started on a very low number of issued patents in the previous period. However, this still implies an increasing interest of alkaline electrolysers in Germany. Compared to its economic output (here described using purchasing power parity; PPP) South Korea shows the highest patent activity. Together with the rather high patent dynamic (second rank) and the high national technology share (also second rank), South Korea is well positioned in the field of alkaline water electrolysis.
For a first assessment of added value for hydrogen supply, the pipeline option is used exemplarily (Figure 7).
Distribution of hydrogen supply (pipeline) costs regarding their potential spending region
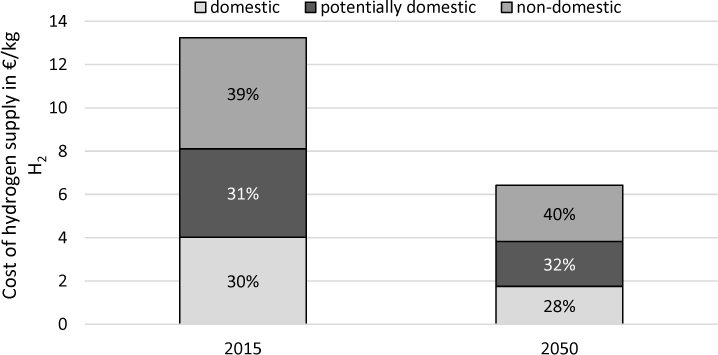
In future, the added value could shift slightly from domestic spending to non-domestic spending. In the base year, in particular the generation of electricity from wind power produced added value in Germany. Due to the ongoing globalization of the industrial sector, this market will not be spared. When including FCEV, however, a much higher shift to non-domestic spending is expected [49].
In this paper, an approach for sustainability assessment of innovative energy technologies was presented and applied to a case study about hydrogen supply. Well-established methods like LCA and LCC were combined with social indicators still under development. The environmental assessment showed that hydrogen transport by pipeline is the preferable option. The economic analysis returned no clear transport preference. The supplementary social evaluation highlighted some additional concerns that need to be addressed when implementing hydrogen as fuel for private cars. A risk assessment of explosion hazards at hydrogen refuelling stations would be an adequate consequence of the survey result. This would additionally take into account the general limitation of LCA not to include risks. The potential shift of local jobs to other countries is another important point that needs further addressing, even though hydrogen supply seems to have a stable share of domestic spending due to the German wind industry. Additionally, Germany needs to do more to foster innovation regarding hydrogen production if it wants to remain competitive with countries such as China, Japan or South Korea.
Next to the already mentioned limitation of LCA not to include risks, another import limitation is the dependence of economic results on the economy of scale. Only if hydrogen demand – not only in the mobility sector – is high enough, investments into a hydrogen infrastructure will be made and electrolyzers and hydrogen refuelling stations need to be produced in larger numbers to become economically viable. Another prerequisite, in particular affecting the environmental results, is the large-scale expansion of on- and offshore wind power as well as photovoltaics in Germany to deliver enough electricity from renewable sources for hydrogen production, which might face bureaucratic obstacles and public resentment.
Moving forward, further social indicators are to be developed, regarding not only their calculation method but also the interpretation of results. With reference to the case study, the model should be extended from hydrogen supply to hydrogen mobility for all indicators by including an FCEV. Especially for the discussion of “added value” a comparison with conventional reference technologies is important and should be integrated into the model. Furthermore, some refinements of the model would benefit the overall significance of the results. This includes, for example, the investment costs for the LOHC system, the environmental modelling of electricity generation technologies or the modelling of the hydrogen underground storage, which is our next focus for LCA.
This work was supported by the Helmholtz Association under the Joint Initiative “Energy System 2050 – A Contribution of the Research Field Energy”.
Many thanks go to our project colleagues Martina Haase and Manuel Baumann for their critical review and much appreciated advise.
The article is based on a contribution to the SDEWES 2019 conference in Dubrovnik and was choosen for this special issue.
- , Noun Project, Icons licenced by Creative Commons CCBY: wind power by Jacqueline Fernandes from the Noun Project, Car by Ditta from the Noun Project, pipeline by Ron Scott from the Noun Project, The Noun Project, 2019
- , Life Cycle Assessment of the thermochemical conversion of biomass for the production of fuel, electricity and heat. 26th European Biomass Conference and Exhibition; 14.-17. May, 2018
- ,
Sustainability assessment of energy technologies: towards an integrative framework ,Energy, Sustainability and Society , Vol. 1 (1), 2011, https://doi.org/https://doi.org/10.1186/2192-0567-1-3 - ,
The challenging paradigm of interrelated energy systems towards a more sustainable future ,Renewable and Sustainable Energy Reviews , Vol. 95 ,pp 171-193 , 2018, https://doi.org/https://doi.org/10.1016/j.rser.2018.07.023 - ,
A lifecycle-based sustainability indicator framework for waste-to-energy systems and a proposed metric of sustainability ,Renewable and Sustainable Energy Reviews , Vol. 56 ,pp 797-809 , 2016, https://doi.org/https://doi.org/10.1016/j.rser.2015.11.036 - ,
Exploring the Current Challenges and Opportunities of Life Cycle Sustainability Assessment ,Sustainability , Vol. 11 (3),pp 636 , 2019, https://doi.org/https://doi.org/10.3390/su11030636 - Energy System 2050 - A Contribution of the Research Field ENergy, 2019, https://www.helmholtz.de/en/research/energy/energy_system_2050/structure/
- ,
Review and analysis of Power-to-X demonstration projects in Europe ,Frontiers in Energy Research , 2020, https://doi.org/https://doi.org/10.3389/fenrg.2020.00191, in pres - ,
Goal and Scope in Life Cycle Sustainability Analysis: The Case of Hydrogen Production from Biomass ,Sustainability , Vol. 6 (8),pp 5463 , 2014, https://doi.org/https://doi.org/10.3390/su6085463 - ,
Sustainable Development Goals as a Guideline for Indicator Selection in Life Cycle Sustainability Assessment ,Procedia CIRP , Vol. 69 ,pp 59-65 , 2018, https://doi.org/https://doi.org/10.1016/j.procir.2017.11.144 - ,
Life cycle sustainability decision-support framework for ranking of hydrogen production pathways under uncertainties: An interval multi-criteria decision making approach ,Journal of Cleaner Production , Vol. 175 ,pp 222-236 , 2018, https://doi.org/https://doi.org/10.1016/j.jclepro.2017.12.070 - ,
Review and evaluation of hydrogen production options for better environment ,Journal of Cleaner Production , Vol. 218 ,pp 835-849 , 2019, https://doi.org/https://doi.org/10.1016/j.jclepro.2019.02.046 - ,
Sustainability assessment and decision making of hydrogen production technologies: A novel two-stage multi-criteria decision making method ,International Journal of Hydrogen Energy , 2020, https://doi.org/https://doi.org/10.1016/j.ijhydene.2019.12.134 - ,
Technology selection for sustainable hydrogen production: A multi-criteria assessment framework under uncertainties based on the combined weights and interval best-worst projection method ,International Journal of Hydrogen Energy , 2019, https://doi.org/https://doi.org/10.1016/j.ijhydene.2019.09.030 - ,
A multi-criterion decision making for sustainability assessment of hydrogen production technologies based on objective grey relational analysis ,International Journal of Hydrogen Energy , 2020, https://doi.org/https://doi.org/10.1016/j.ijhydene.2019.11.039 - ,
Life cycle sustainability assessment of hydrogen from biomass gasification: A comparison with conventional hydrogen ,International Journal of Hydrogen Energy , 2019, https://doi.org/https://doi.org/10.1016/j.ijhydene.2019.01.105 - ,
Current status, research trends, and challenges in water electrolysis science and technology ,International Journal of Hydrogen Energy , 2020, https://doi.org/https://doi.org/10.1016/j.ijhydene.2020.03.109 - ,
Awareness, acceptability and attitudes towards hydrogen vehicles and filling stations: A Greater Stavanger case study and comparisons with London ,International Journal of Hydrogen Energy , Vol. 33 (21),pp 5859-5867 , 2008, https://doi.org/http://dx.doi.org/10.1016/j.ijhydene.2008.07.006 - , , HyTrust: Repräsentative Bevölkerungsbefragungen zur Wasserstoffmobilität, 2013
- , , ISO 14040:2006 Environmental management – Life cycle assessment – Principles and framework; German and English version, 2009
- , , ISO 14044:2006 Environmental management – Life cycle assessment – Requirements and guidelines; German and English version, 2006
- , , International Reference Life Cycle Data System (ILCD) handbook: General guide for life cycle assessment : detailed guidance, 2010
- , , Recommendations for Life Cycle Impact Assessment in the European context - based on existing environmental impact assessment models and factors, 2011
- , GreenDelta, OpenLCA, GreenDelta GmbH, 2018
- , , Swiss Centre for live cycle inventories, Ecoinvent Database version 3.3, 2016
- , , Levelised Cost of Electricity, 2015
- ,
Sustainability indicators for the assessment of nuclear power ,Energy , Vol. 36 (10),pp 6037-6057 , 2011, https://doi.org/http://dx.doi.org/10.1016/j.energy.2011.08.011 - , , Guidelines for Social Life Cycle Assessment of Products: Social and socio-economic LCA guidelines complementing environmental LCA and Life Cycle Costing, contributing to the full assessment of goods and services within the context of sustainable development, 2009
- ,
Towards life cycle sustainability assessment: an implementation to photovoltaic modules ,The International Journal of Life Cycle Assessment , Vol. 17 (8),pp 1068-1079 , 2012, https://doi.org/https://doi.org/10.1007/s11367-012-0433-8 - ,
Working conditions in hydrogen production: A social life cycle assessment ,Journal of Industrial Ecology , Vol. 23 (5),pp 1052-1061 , 2019, https://doi.org/https://doi.org/10.1111/jiec.12840 - ,
Sustainability decision support framework for industrial system prioritization ,AIChE Journal , Vol. 62 (1),pp 108-130 , 2016, https://doi.org/https://doi.org/10.1002/aic.15039 - ,
Intuitionistic fuzzy multi-criteria decision making framework based on life cycle environmental, economic and social impacts: The case of U.S. wind energy ,Sustainable Production and Consumption , Vol. 8 ,pp 78-92 , 2016, https://doi.org/http://dx.doi.org/10.1016/j.spc.2016.06.006 - ,
Low rate releases of hazardous light gases under semi-confined geometry: A consequence based approach and case-study application ,Journal of Loss Prevention in the Process Industries , Vol. 63 ,pp 104038 , 2020, https://doi.org/https://doi.org/10.1016/j.jlp.2019.104038 - ,
Hydrogen infrastructure—Efficient risk assessment and design optimization approach to ensure safe and practical solutions ,Process Safety and Environmental Protection , Vol. 143 ,pp 164-176 , 2020, https://doi.org/https://doi.org/10.1016/j.psep.2020.06.028 - , , Nachhaltige Entwicklung integrativ betrachtet konstitutive Elemente, Regeln, Indikatoren, 2001
- ,
Hydrogen fuel station acceptance: A structural equation model based on the technology acceptance framework ,Journal of Environmental Psychology , Vol. 38 ,pp 153-166 , 2014, https://doi.org/http://dx.doi.org/10.1016/j.jenvp.2014.01.008 - ,
Intention to act towards a local hydrogen refueling facility: Moral considerations versus self-interest ,Transportation Research Part A: Policy and Practice , Vol. 48 ,pp 63-74 , 2013, https://doi.org/http://dx.doi.org/10.1016/j.tra.2012.10.006 - , , Hyacinth: Report on Methodologies and factors, 2016
- , , Ergebnisse zur Akzeptanz der Bevölkerung, 2017
- , IET/CICS.NOVA, Innovation and Technology Studies pole at FCT-UNL, Centro Interdisciplinar de Ciências Sociais, Faculdade de Ciências e Tecnologia, Citizen concerns and acceptance for novel energy technologies, 2019
- ,
Technological forecasting of hydrogen storage materials using patent indicators ,International Journal of Hydrogen Energy , Vol. 41 (41),pp 18301-18310 , 2016, https://doi.org/https://doi.org/10.1016/j.ijhydene.2016.08.137 - ,
Patent information for strategic technology management ,World Patent Information , Vol. 25 (3),pp 233-242 , 2003, https://doi.org/https://doi.org/10.1016/S0172-2190(03)00077-2 - ,
Market Share, Market Value and Innovation in a Panel of British Manufacturing Firms ,The Review of Economic Studies , Vol. 66 (3),pp 529-554 , 1999, https://doi.org/https://doi.org/10.1111/1467-937X.00097 - ,
Patterns of technological innovation and evolution in the energy sector: A patent-based approach ,Energy Policy , Vol. 59 ,pp 415-432 , 2013, https://doi.org/https://doi.org/10.1016/j.enpol.2013.03.054 - , , GDP per capita, PPP (current international $), The World Bank, 2019
- ,
Comparative patent analysis for the identification of global research trends for battery storage, hydrogen and bioenergy ,Technological Forecasting & Social Change , 2020 - , www.epo.org, [Accessed 25.03.2019
- , DIW, DLR, gws, Fraunhofer ISI, ZSW, Osnabrück, Berlin, Karlsruhe, Stuttgart, Kurz- und langfristige Auswirkungen des Ausbaus der erneuerbaren Energien auf den deutschen Arbeitsmarkt, 2011
- , , Elektromobilität 2035 - Effekte auf Wirtschaft und Erwerbstätigkeit durch die Elektrifizierung des Antriebsstrangs von Personenkraftwagen, 2018
- ,
Hydrogen Supply Chains for Mobility—Environmental and Economic Assessment ,Sustainability , Vol. 10 (6),pp 1699 , 2018, https://doi.org/https://doi.org/10.3390/su10061699 - ,
Moving towards socio-technical scenarios of the German energy transition – lessons learned from integrated energy scenario building ,Climatic Change , 2019, https://doi.org/https://doi.org/10.1007/s10584-10019-02598-10580 - , , Studie über die Planung einer Demonstrationsanlage zur Wasserstoff-Kraftstoffgewinnung durch Elektrolyse mit Zwischenspeicherung in Salzkavernen unter Druck, 2015
- ,
Site-Dependent Environmental Impacts of Industrial Hydrogen Production by Alkaline Water Electrolysis ,Energies , Vol. 10 (7),pp 860 , 2017, https://doi.org/https://doi.org/10.3390/en10070860 - ,
Future cost and performance of water electrolysis: An expert elicitation study ,International Journal of Hydrogen Energy , Vol. 42 (52),pp 30470-30492 , 2017, https://doi.org/https://doi.org/10.1016/j.ijhydene.2017.10.045 - , , Stand und Entwicklungspotenzial der Wasserelektrolyse zur Herstellung von Wasserstoff aus regenerativen Energien: NOW-Studie, 2011
- ,
Utilisation of excess electricity in different Power-to-Transport chains and their environmental assessment ,Transportation Research Part D: Transport and Environment , Vol. 64 ,pp 23-35 , 2018, https://doi.org/https://doi.org/10.1016/j.trd.2018.01.016 - ,
Correas L. C., HyUnder – Hydrogen Underground Storage at Large Scale: Case Study Spain ,Energy Procedia , Vol. 73 ,pp 136-144 , 2015, https://doi.org/http://dx.doi.org/10.1016/j.egypro.2015.07.661 - ,
Seasonal storage and alternative carriers: A flexible hydrogen supply chain model ,Applied Energy , Vol. 200 ,pp 290–302 , 2017 - , , Update of Emission Factors for EURO 5 and EURO 6 vehicles for the HBEFA Version 3.2 - Final Report, 2013
- Verkehr in Kilometern der deutschen Kraftfahrzeuge im Jahr 2016, https://www.kba.de/DE/Statistik/Kraftverkehr/VerkehrKilometer/verkehr_in_kilometern_node.html, [Accessed 17.08.2017
- ,
The Linde Group and Daimler AG, Linde und Daimler bauen ,DWV-Mitteilungen , Vol. 18-2 (6),pp 20 , 2014 - , , 3.2 Hydrogen Delivery, 2015
- , Konzeption und Bewertung einer nachhaltigen Energieversorgung auf Basis flüssiger wasserstoffträger (LOHC), Dissertation, 2015
- , Hydrogen Liquefaction Report - Whole Chain Assessment, Integrated Design for Demonstration of Efficient Liquefaction of Hydrogen (IDEALHY), 2013
- , Strom- und Gasmarktdesign zur Versorgung des deutschen Straßenverkehrs mit Wasserstoff, Dissertation, 2015
- , The latest developments and outlook for hydrogen liquefaction technology, AIP Conference Proceedings, 2014
- ,
A hydrogen supply chain with spatial resolution: Comparative analysis of infrastructure technologies in Germany ,Applied Energy , Vol. 247 ,pp 438-453 , 2019, https://doi.org/https://doi.org/10.1016/j.apenergy.2019.04.064 - , , VII.11 Hydrogen Station Data Collection and Analysis, 2015
- , HyARC, International Hydrogen Stations, 2018
- , Wasserstoff im motorisierten Individualverkehr - Möglichkeiten und deren Bewertung, Dissertation, 2017
- ,
Assessment of system variations for hydrogen transport by Liquid Organic Hydrogen Carriers ,International Journal of Hydrogen Energy , Vol. 43 (26),pp 11884-11895 , 2018, https://doi.org/https://doi.org/10.1016/j.ijhydene.2018.01.198 - ,
Life Cycle Assessment of hydrogen transport and distribution options ,Journal of Cleaner Production , Vol. 199 ,pp 431-443 , 2018, https://doi.org/https://doi.org/10.1016/j.jclepro.2018.07.180 - ,
Ecological assessment of hydrogen tanks for fuel cell electric vehicles ,Journal of Cleaner Production , Vol. 278 , 2021, https://doi.org/https://doi.org/10.1016/j.jclepro.2020.123277 - , Hydrogen Refueling Station Analysis Model (HRSAM) 2.0 Argonne National Laboratory, 2017
- , , Hydrogen Station Cost Estimates: Comparing Hydrogen Station Cost Calculator Results with other Recent Estimates, 2013
- Durchschnittlicher Preis für Dieselkraftstoff in Deutschland in den Jahren 1950 bis 2017* (Cent pro Liter), https://de.statista.com/statistik/daten/studie/779/umfrage/durchschnittspreis-fuer-dieselkraftstoff-seit-dem-jahr-1950/, [Accessed 17.08.2017
- , , Dieselpreis-Information (Großverbraucher), 2019
- , , Entwicklung von modularen Konzepten zur Erzeugung, Speicherung und Einspeisung von Wasserstoff und Methan ins Erdgasnetz, 2013
- Statistisches Bundesamt, Gehalts- und Lohnentwicklung in Deutschland gegenüber dem Vorjahr von 1992 bis 2017, https://de.statista.com/statistik/daten/studie/75731/umfrage/entwicklung-der-bruttoloehne-in-deutschland/, [Accessed 24.07.2018
- , Himmelweite Unterschiede in der Entlohnung - Löhne von Lkw-Fahrern im Vergleich, eurotransport.de, 2017
- , Kuratorium für Betriebshilfsdienste und Maschinenringe in Westfalen-Lippe e.V., Erfahrungssätze für Maschinenring-Arbeiten unter Landwirten ab 2017, 2017