


The Circular Economy package of the European Union aims at increasing the amount of waste resources sent to material recycling [1]. Waste composition analysis show that more than 40% of the waste generated by households is food waste [2]. This indicates that separation and recycling of food waste is important to achieve the circular economy objectives of increased separation of waste followed by recycling. In Norway, municipalities are responsible for the collection and treatment of waste from households. The decisions regarding types of waste for separation and which collection and treatment systems to use, are political decisions made by local governments. It has been estimated that the total amount of biowaste generated by households is approximately 460,000 tonnes per year, and in 2016 about 38% of the waste was separated and sent to biological treatment [3]. The remaining amount is sent to energy recovery as part of the residual waste. A bill suggested by The Norwegian Environmental Agency in 2016 requires the municipalities to obtain a minimum separation rate for food waste of 55% within 2025, 60% within 2030 and 70% within 2035 [3].
In addition to the ambition to increase the amount of separated food waste, Norway has a cross sectoral biogas strategy, asserting a national goal to increase biogas production. This is mainly a measure to reduce greenhouse gas emissions, but also to recycle the nutrients in the waste resources [4]. The amount of biogas produced in Norway in 2018 was estimated to be about 0.5 TWh, mainly from food waste and sewage sludge [5]. So far, the amount of livestock manure treated by anaerobic digestion has been limited. In some countries, biogas is considered as a potential important contributor to a renewable energy system due to the possibility of flexible power generation [6]. Due to relatively low energy prices and a high share of renewable energy in Norway (more than 97% for electricity, and an overall share of 69.4% [7]), there has been less focus on the production of heat and electricity from biogas. Likely this has contributed to a considerable share of flaring and internal use of the biogas at the anaerobic digestion plants [8]. Over the last years, however, biogas has increasingly been upgraded to fuel quality and used in the transport sector, where the share of renewable energy was about 6% in 2016 [7]. In 2018 40% of the biogas was upgraded to fuel quality, 27% was used for internal heating at the plant, 9% for electricity or district heating and 24% was flared [5].
To obtain the national objectives of increased separation of food waste and increased production of biogas, it is necessary to establish new biogas plants. As increased biogas production is regarded as an instrument to reduce environmental impacts, there is a need to document the potential effects as part of the decision support, before new value chains are created. Documenting the potential impact of non-existing value chains can be challenging, as the required data may not be available. It is thus necessary to perform predictions and to make assumptions, based on literature, models and experiences from similar value chains.
Life cycle assessment (LCA) is a well-known methodology for assessing the environmental impacts of products and services by considering the entire value chain from raw material extraction, production, use phase and end of life treatment. LCA is widely used to optimise products and services, and can be regarded as an important instrument for policy development [9].
LCA results from biogas value chains are significantly affected by the properties of the feedstock materials, the efficiency of the biogas plant and the status of the end-use technology[10]. Several studies have concluded that operation of anaerobic digesters is one of the main contributors to the impacts from biogas production [11], [12]. This can be a challenge when performing predictive studies for non-existing plants. For example, large variations can be found in literature regarding assumptions relating to the amount of reject from pre-treatment. The standard value in the BioValueChain model is 7% [13], while a Swedish study assumed 17% [14]. Mapping of anaerobic digestion plants in Denmark and Sweden have shown that the amount of reject varies significantly, and can be as high as 45% [15], [16]. A study on pre-treatment efficiencies effect on LCA results did, however, find that variations in the results due to changes in pre-treatment efficiency generally were small when looking at potential impacts on global warming [17]. The same study concluded that the methane potential of feedstock was important for the LCA results. Other aspects that are found to be important in literature are: what the biogas and digestate is used for [13], [18], choice of upgrading technology [19] and fugitive methane emissions[20]. This shows the importance of the use of case specific data [13], [21].
Several LCA studies have assessed the environmental impacts of potential future scenarios for anaerobic digestion as a treatment method for food waste compared with other treatment alternatives. For example, in a Swedish full-scale case study of treatment of food waste in a specific region, site-specific data were used for source separation behaviour and transport distances. Data regarding energy use, methane content in biogas and methane losses were collected from the local anaerobic digestion plant [14]. An Italian study compared the environmental sustainability of anaerobic digestion with energy recovery from the organic wet fraction of municipal solid waste. The results indicated that the production of biomethane for road transport is more environmentally beneficial than production of heat and power. The data for the production processes were based on measurements done at a real plant [22].
Full scale studies of existing biogas plants have also been performed. For example, a French study assessed the environmental profile of a real-scale anaerobic-digestion plant in Corsica [23]. Another study assessed two real biogas plants to evaluate different feedstocks for biogas production [24].
LCA can also be used for evaluating future scenarios for new plants or geographical regions, for example when planning a new urban settlement [25]. A Norwegian study assessed the greenhouse gas emissions and economic impacts from anaerobic digestion of the livestock manure resources in a region [26]. The assessment of the anaerobic digestion plant was based on model data. A British study investigated the environmental impacts of anaerobic digestion compared with other options in London. As anaerobic digestion represented a new treatment option, the study used literature data for operation of the plant. The sensitivity assessment showed that fugitive emissions of methane and the quantity and the quality of energy produced have a large impact on the results, and are thus important input data in the assessment [27].
None of the studies above have in retrospect evaluated how valid the results of predictive studies turned out to be compared with the use of real data from operation of the plant. The aim of this paper is to compare the results of a predictive study used as decision support before the establishment of a new anaerobic digestion plant with the results from a monitoring study based on data from the same plant in operation. The purpose is to increase the understanding of the benefits and challenges of using LCA as decision support prior to establishing a new plant and to provide knowledge that can be transferred to other LCA studies involving future scenarios in general and to the planning of anaerobic digestion plants specifically.
In the following sections present the methods, results and discussion of the study, before the conclusion. The methods, results and discussion sections are divided in two: Part 1 is the predictive study that was done before the plant was established, and Part 2 is the comparison between the predictive and the monitoring study of the plant.
The LCA methodology is standardised through the ISO system [28], [29] and the European Commission has developed general guidelines for performing LCA [30] and LCA for waste systems [31]. The methodology applied in the two parts of this study is described below.
The predictive case study was performed in 2013 and was based on the estimated amounts of food waste and livestock manure resources in the region of Vestfold in Norway [32], as shown in Table 1. The functional unit was thus defined as treatment of the available amounts of resources. The main purpose of the study was to give the local politicians decision support regarding: 1) whether or not a plant should be established, 2) the size of the plant in terms of treatment of waste and manure resources, and 3) the importance of requirements regarding coverage on digestate storage. This was done by estimating the potential reductions of greenhouse gas emissions associated with four future scenarios.
Available resources in the region [32]
| Resource | Wet weight (tonnes) |
|---|---|
| Food waste | 18,000 |
| Manure from cattle | 30,000 |
| Manure from pig | 30,000 |
When attempting to model a non-existing value chain, there are few specific data available. The assessment was thus based on standard values in the BioValueChain model [9], which is a model for calculating the environmental impacts from biogas value chains in Norway. The use of a pre-defined model makes the conduction of each case study less resource intensive, as the model includes a large range of parameter values that can easily be changed to fit the regional situation. In the BioValueChain model the expected biogas production is calculated based on theoretical biogas potential of each input material, and the realistic output is assumed to be 70% of the theoretical potential [13]. In addition, a co-digestion effect between manure and food waste of 10% was assumed in the predictive study [32].
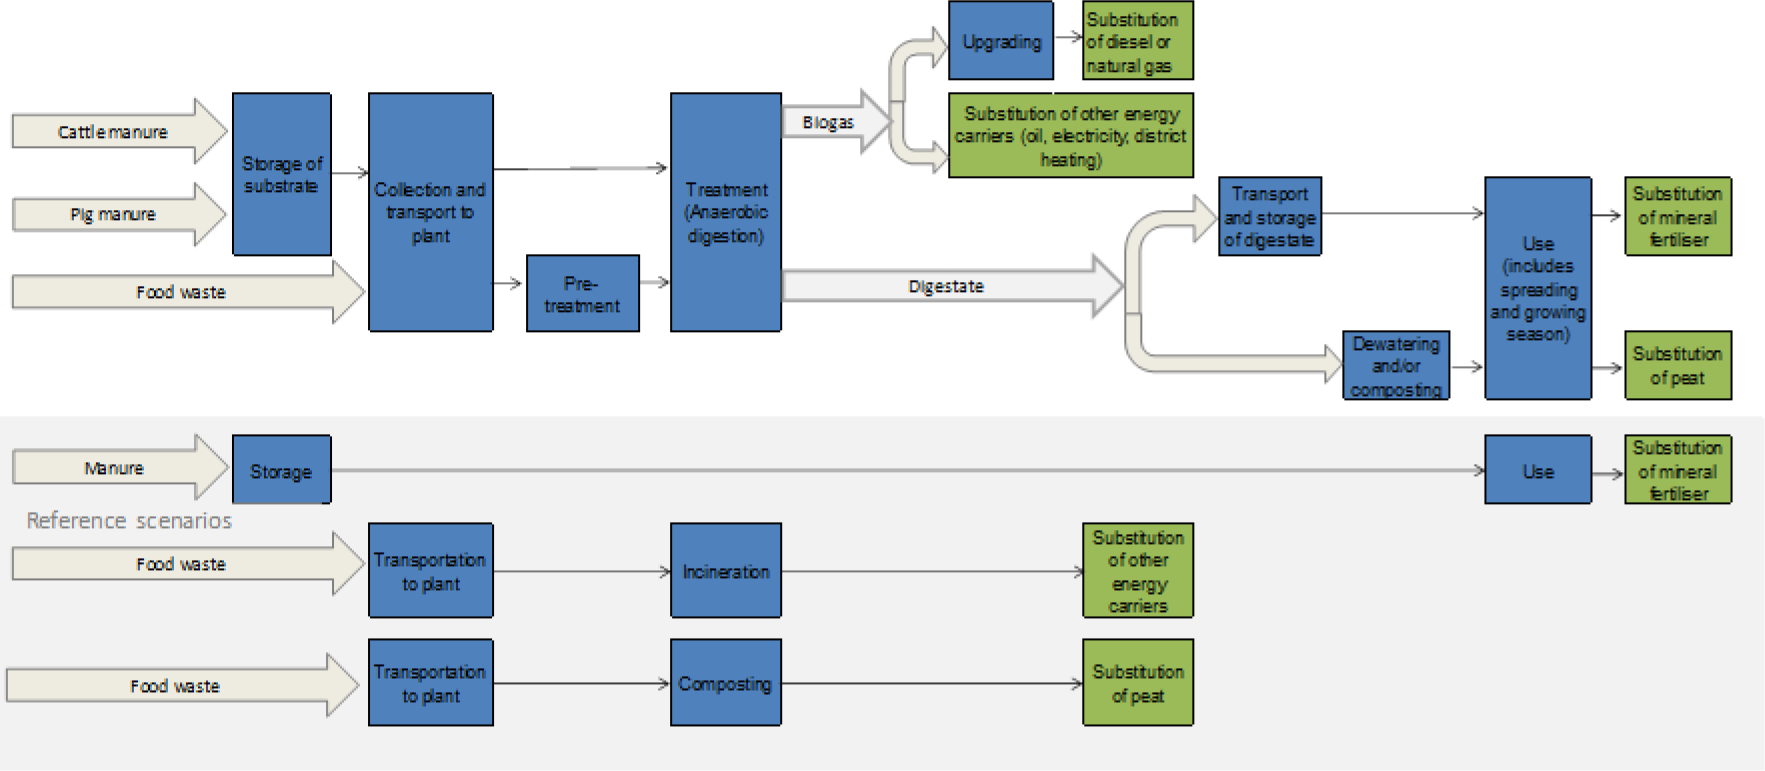
Both of the co-products from anaerobic digestion (biogas and digestate) have several utilisation pathways. The biogas can be used to generate heat and electricity, used as a fuel for transport or injected into the natural gas grid if the methane content is upgraded to over 97 %. Untreated digestate can be used as biofertiliser directly, or the digestate can be dewatered and composted and used as compost or soil improvement product. Based on knowledge from the BioValueChain model [13] about which application of biogas and digestate that would provide the best environmental benefit in a Norwegian context, it was decided that the biogas should be upgraded and used as a fuel for transport to replace diesel, and that the digestate should be used as biofertiliser to replace mineral fertiliser. In order to evaluate various possibilities for a digestion plant, several scenarios were developed and compared with a reference scenario. Each of the scenarios as defined in the original study are described below [32].
Reference scenario: This scenario represented the current situation in 2013, where none of the manure and food waste resources were treated by anaerobic digestion. The livestock manure was stored at each farm and spread on the fields during the growing season. In the original study, it was estimated that about 60% of the food waste in the region was not separated and thus sent to energy recovery together with the residual waste, while 40% was separated and sent to composting [32]. Further, it was assumed that the heat from incineration substituted Norwegian district heating mix and that the compost substituted peat on the basis of carbon content.
Scenario A: In scenario A it was assumed that an anaerobic digestion plant was established for treatment of food waste only, while the manure resources were treated as in the reference scenario.
Scenario B: In scenario B the anaerobic digestion plant was assumed to be a co-digestion plant for food waste and some of the livestock manure resources in the region (24,000 tonnes). The rest of the manure was treated as in the reference scenario.
Scenario C: In scenario C the anaerobic digestion plant was assumed to be a co-digestion plant for food waste and all of the available livestock manure resources. Thus, this scenario constitutes the scenario with the largest treatment capacity.
Scenario D: Scenario D is identical to scenario C, with the exception of storage tanks without cover for digestate at the farms.
In all scenarios except D, the farmers receiving biofertiliser from the plant are required to cover their storage tanks.
As illustrated in Figure 1, the following life cycle stages were defined: storage of manure, transportation to plant, pre-treatment of food waste, anaerobic digestion, upgrading of biogas, transport and storage for digestate, use of biofertiliser, avoided emissions caused by biogas substituting diesel and avoided emissions caused by digestate substituting mineral fertiliser.
The assessment of the reference scenario included a storage phase for untreated manure and use of manure as fertiliser. The storage phase for the manure was assumed to be substantially longer than for manure that was sent to the anaerobic digestion plant. To ensure comparability between the scenarios, it was assumed that the livestock manure substituted mineral fertiliser, in line with the BioValueChain model [13]. The reference scenario also included collection and treatment of food waste (a mix of composting and incineration), avoided emissions associated with the generated heat that substituted district heating mix, and compost that substituted peat.
Life cycle stages for the scenarios
The BioValueChain model is able to assess several environmental impact categories. When performing this study, however, the political interest was limited to the reduction of greenhouse gas emissions and therefore, the results in this paper are only be presented for this environmental impact category. In the predictive study in 2013, characterisation factors from IPCC (2007) 100 years horizon were applied [33]. The characterisation factor for (fossil) methane (CH4) was 25 kg CO2 equivalents/kg CH4 and the factor for dinitrogen monoxide 298 kg CO2 equivalents/kg N2O. Biogenic CO2 was given the characterisation factor 0 and the characterisation factor for biogenic methane was 22 kg CO2 equivalents/kg biogenic CH4.
The biogas plant named ‘The Magic Factory’ was established in Vestfold in 2016 based on knowledge from the predictive study in Part 1. The plant was opened by the Norwegian prime minister as the first centralised biogas plant in Norway co-digesting manure and food waste and was given the status as a national pilot plant. The pilot status included joining a research monitoring programme which comprised mass- and energy balances and measurements of potential methane leakages. In addition, an LCA was performed based on data from the operation of the plant.
In contrast to the predictive study, the LCA performed during the monitoring study was based on specific data for energy use, the amount of reject from pre-treatment of the food waste, actual production of biogas and sale of upgraded biogas, amount of biofertiliser (untreated digestate) produced and nitrogen content in the biofertiliser [34]. Fugitive emissions of methane were also included based on the measurements of methane losses.
The time frame of the monitoring study was two years in operation: 2016 and 2017. 2016 was the first full year in operation and was regarded as a start-up period where some adjustments in the production were done. 2017 was assumed to be a more representative year for future operation of the plant. The study was, however, carried out in the first part of 2017, and therefore the data was based on the first months of the year.
To obtain a fair comparison between the results in the predictive and the monitoring study in this paper, it was necessary to do a few adjustments to the predictive study. Firstly, the amounts of food waste and manure treated in the anaerobic digestion plant during 2016 and 2017 were different to the estimated amounts in the predictive study. While the tonnes of wet weight (w.w.) livestock manure were smaller than predicted, the amount of food waste was about twice as high, as the anaerobic digestion plant received food waste from outside the region. As a result, the amount of food waste and manure were corrected in the adjusted predictive study, as shown in Table 2.
Amount of resources treated
| Resource | 2016Wet weight (tonnes) | 2017Wet weight (tonnes) |
|---|---|---|
| Food waste | 37,855 | 49,733 |
| Manure from cattle | 28,616 | 40,780 |
| Manure from pig | 25,174 | 22,897 |
The assumptions regarding dry matter (DM) content for the input materials in the predictive study was based on standard values in the BioValueChain model, which was 33% for food waste and 8% for manure from cattle and pig [13]. The values used in the monitoring study was based on specific data, which was 30% dry matter content for food waste from household, 27% for food waste from industry, 12% for substrates from other sources, 7% for cattle manure and 4% for pig manure. The dry matter content of the biofertiliser (digestate) is 4.5%.
A summary of the operational data applied in the monitoring study is shown in Table 3. When the food waste enters the plant, it undergoes a pre-treatment process, which consists a screw press and a grinder. Plastic collection bags and mis-sortings are removed as reject and sent to energy recovery. Further, a hydro cyclone removes sand, eggshells and other heavy particles. The organic feedstock is then sent through a sterilization process for 1 hour at 70 °C. The hydraulic retention time during the monitoring study was 36.5 days in average [35]. The total energy use at the plant was calculated to be 370 kWh electricity and 49 kWh for heating. The heat demand was mainly during the winter and was covered by natural gas. Based on measurements performed in the monitoring study, it was estimated that the fugitive emissions from biogas production mounted a maximum of 1.3% of the biogas produced. The upgrading technology used to obtain fuel quality for the biogas is water scrubbing. Methane loss from upgrading was measured to be less in reality (0,8%) compared with the upgrading technology providers specifications (1%). After the monitoring study adjustments were done to reduce fugitive emissions. The plant currently also extracts CO2 from the upgrading process, which is used by a greenhouse to produce tomatoes. The extraction of CO2 was not established when the monitoring study was performed in 2017 and is thus not discussed further in this paper.
Operational data [34]
| 2016 | 2017 (estimated) | |
|---|---|---|
| Feedstock (tonnes w.w.) | 91,645 | 113,410 |
| Reject | 21.5 % | 21.5 % |
| Electricity use (kWh/tonne DM) | 370 | 370 |
| Natural gas use (kWh/tonne DM) | 49 | 49 |
| Flared | 14.5% | 14.5% |
| Fugitive emissions digester | 1.3% | 1.3% |
| Methane loss from upgrading | 0.8% | 0.8% |
| Biomethane sold, Nm3 (98,5% CH4) | 3,540,659 | 5,870,000 |
| Biofertiliser (tonnes w.w.) | 89,870 | 111,175 |
Furthermore, the monitoring study had applied the most updated characterisation factors for global warming potential from IPCC 2013 [36], while the predictive study utilised factors from IPCC 2007 [33]. The characterisation factors in the predictive study were thus changed from IPCC 2007 to 2013 in the comparative assessment to obtain a real comparison between the input data in the two studies. Consequently, the characterisation factor for fossil CH4 increased from 25 to 30.5, and the factor for biogenic methane from 22 to 27.75, while the characterisation factor for N2O decreased from 298 to 265 kg CO2 equivalents/kg N2O in the predictive study.
Lastly, the system boundaries were defined slightly different in the two studies. In the predictive study, a separate assessment was performed for the reference scenario (treatment of food waste and livestock manure before the establishment of the plant). The effect of establishing a new plant was evaluated by calculating the difference in results between each future scenario and the reference scenario. In the monitoring study, no reference scenario (alternative treatment of food waste and manure) was included because the scope of the study was the newly established value chain. As the farmers that supply livestock manure to the plant receive the same amount of digestate in return, it was assumed that the digestate from the manure substituted use of untreated manure, resulting in reduced emissions from storage and application to soil. The effect of substituting mineral fertiliser was thus only accounted for on the basis of nitrogen content in the food waste.
In this chapter the results from the predictive study is presented (Part 1), before the difference in results between the predictive and the monitoring study is presented and discussed (Part 2).
The results for the Reference Scenarios and the future scenarios defined in 2013 are shown in Figure 2. The results are presented per life cycle stage and as net results, which summarizes the burdens and the avoided impacts. These results are identical to those in the original study [32] using characterisation factors from IPCC 2007 [33].
Potential impact on climate change per life cycle stage and net results (impacts and avoided impacts)
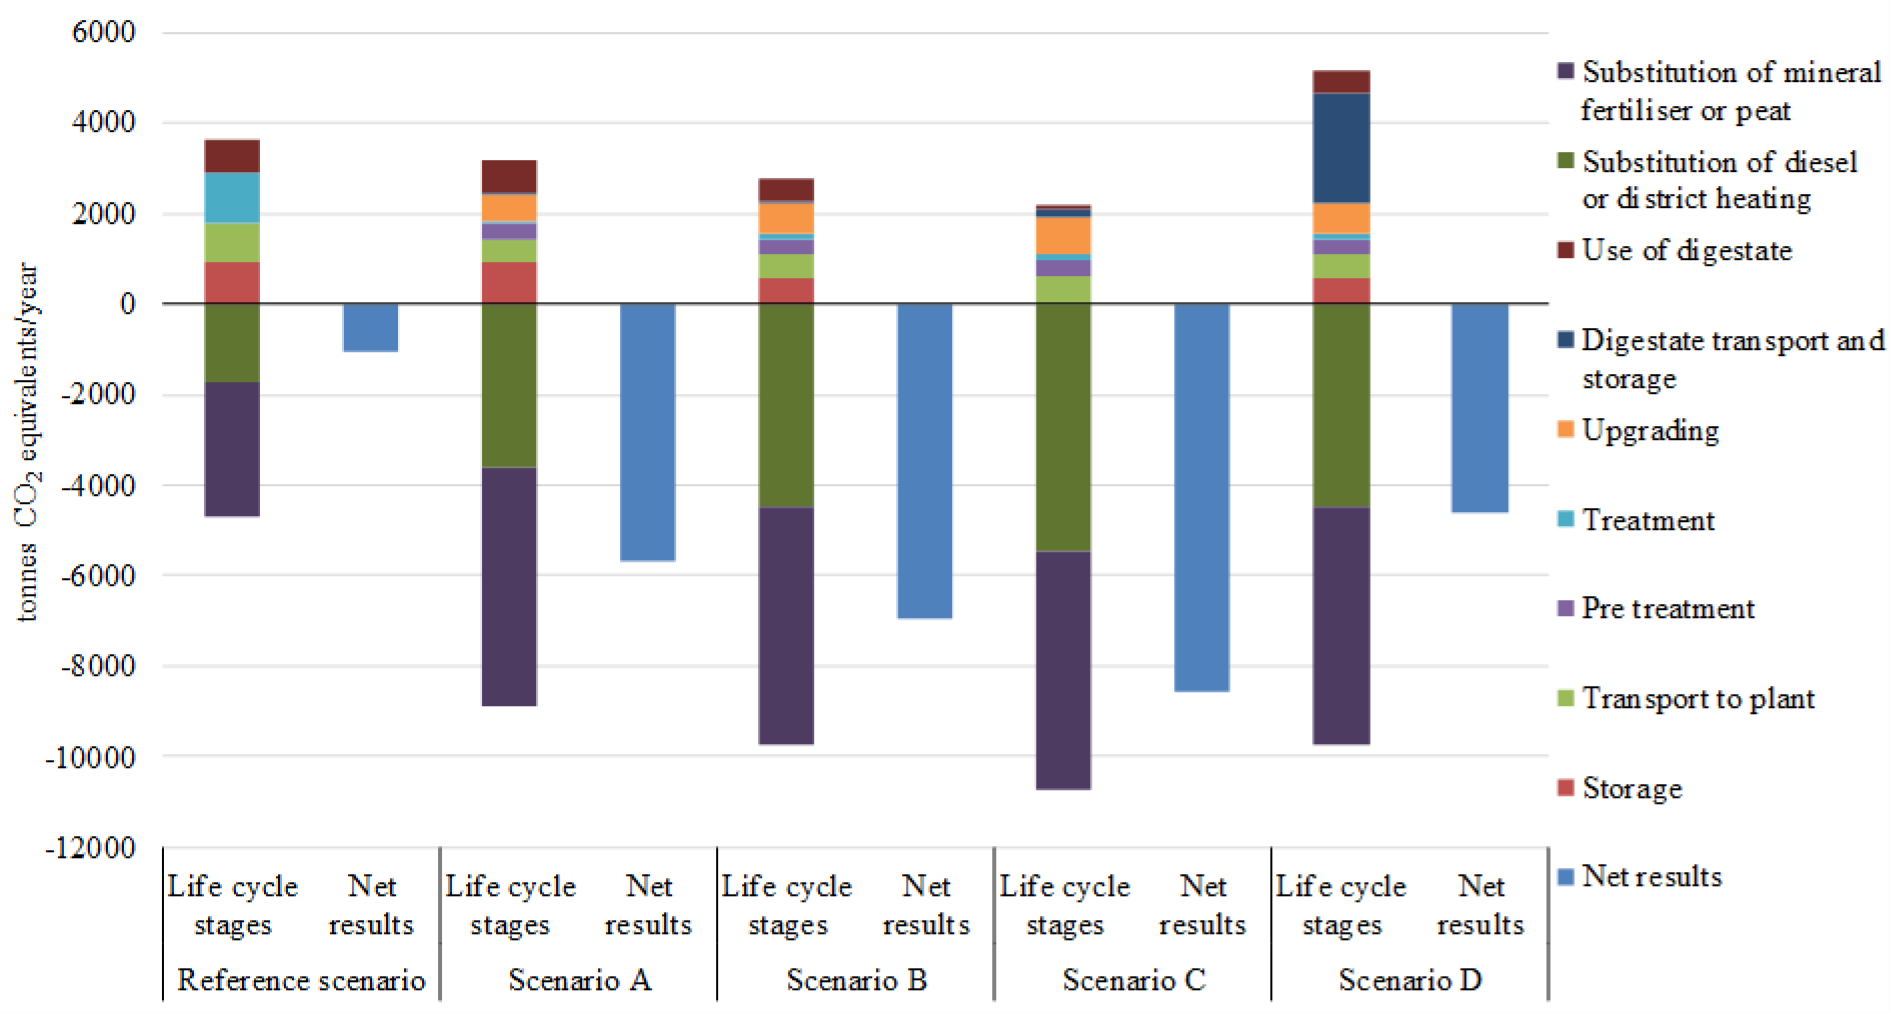
The results showed that all the alternatives for establishing an anaerobic digestion plant in the region of Vestfold in Norway would result in a reduction of greenhouse gas emissions. The largest reductions are obtained in the scenario with the largest co-digestion plant (Scenario C), which represents a reduction of about 7,500 tonnes CO2 equivalents per year when compared with the Reference Scenario. The reductions are mainly due to the avoided emissions from the use of biogas and digestate. The upgraded biogas was used as fuel for transport and resulted in avoided emissions of the production and use of diesel. The digestate was assumed to be used as biofertiliser and to substitute mineral fertiliser on the basis of the nitrogen content. Some of the reductions are also due to reduced emissions of greenhouse gases from storage compared with the reference scenario for livestock manure.
Scenario A results in lower reductions of greenhouse gas emissions when compared with Scenario C which treats all the identified manure resources in the region, and Scenario B which treats some of the manure resources. The explanation is twofold. Firstly, the more manure that is treated in the anaerobic digestion plant, the more emission reductions are obtained from storage of manure. In addition, the more resources that are used for biogas production, the more biogas is produced, and consequently more diesel is substituted. The annual reductions in greenhouse gas emissions were estimated to be approximately 4,700 tonnes CO2 equivalents when comparing Scenario A with the Reference scenario. In Scenario B the potential reductions of greenhouse gases were estimated to be 5,900 tonnes CO2 equivalents per year.
In Scenario A-C it was assumed that the farmers receiving digestate from the anaerobic digestion plant were required to cover the storage tank to reduce methane emissions. Scenario D is identical to Scenario C, with the exception that no digestate covers on the storage tanks were assumed. Scenario D represents the least favourable option of the anaerobic digestion plant alternatives, with a reduction of 3,500 tonnes CO2 equivalents per year. This shows the importance of minimising methane emissions after the anaerobic digestion process.
Based on the predictive study, the local politicians decided to build a plant corresponding to the scenario that gave the greatest reduction in greenhouse gas emissions compared with the current situation, i.e. Scenario C.
The comparison between the predictive study (adjusted) and the monitoring study is shown in Figure 3.
Net results for the predictive (adjusted) and the monitoring study
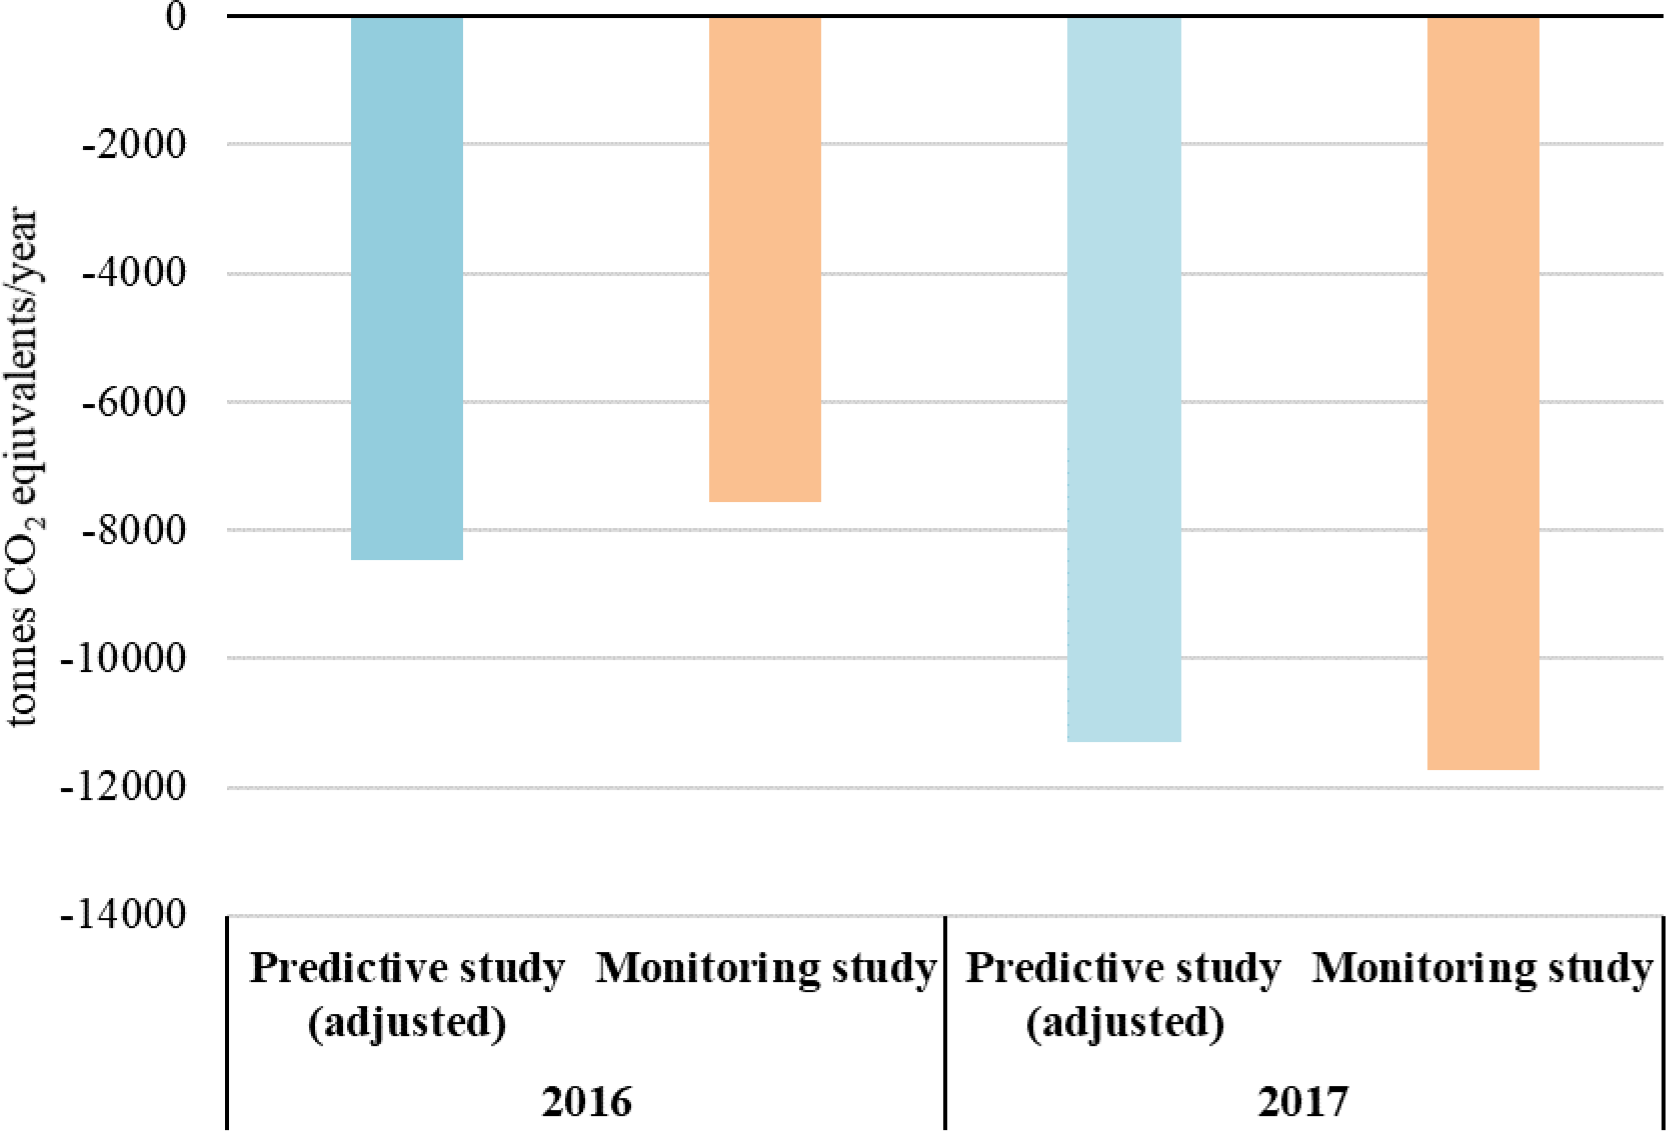
The net results for the monitoring study were 911 tonnes CO2 equivalents higher than the adjusted predictive study, representing a deviation of -12% in the results for 2016. The results for 2017 show a difference of 449 tonnes CO2 equivalents, which is a deviation of +4%. In Table 4 the results are divided into each life cycle stage and the deviation between the monitoring and the predicted results are presented.
Results for the predictive and monitoring study per life cycle stage
| 2016 | 2017 | |||||
|---|---|---|---|---|---|---|
| Life cycle phase | PredictiveStudy (adjusted) | Monitoringstudy | Deviation | PredictiveStudy (adjusted) | Monitoringstudy | Deviation |
| Avoided emissions fromuntreated manure | -1,143 | -783 | 360 | -1,482 | -1,029 | 453 |
| Transport to biogas plant | 706 | 2,868 | 2,162 | 949 | 4,252 | 3,303 |
| Pre treatment | 99 | 194 | 95 | 134 | 295 | 160 |
| Anaerobic digestion | 113 | 1,777 | 1,664 | 149 | 2,499 | 2,350 |
| Upgrading | 1,078 | 593 | -485 | 1,433 | 944 | -489 |
| Transport and storage ofbiofertiliser | 92 | 21 | -71 | 119 | 38 | -82 |
| Spreading and use ofbiofertiliser | 92 | 689 | 597 | 112 | 908 | 796 |
| Biogas substitutes diesel | -6,296 | -9,067 | -2,771 | -8,369 | -14,463 | -6,093 |
| Biofertiliser substitutesmineral fertiliser | -3,213 | -3,853 | -640 | -4344 | -5,192 | -847 |
| Net results | -8,472 | -7,562 | 910 | -11,298 | -11,748 | -449 |
The results show that both the burdens and the avoided emissions were greater in the monitoring study than in the predictive study. The largest difference in the predictions and the actual results is the avoided emissions due to substitution of diesel. This confirms that the production and supply of upgraded biogas as a fuel for transport were greater than forecasted, even during the start-up year. The estimated sales of biogas based on the standard values in the BioValueChain were 27 GWh (2016) and 35 GWh (2017) compared with the real sales value 33 GWh (2016) and 54 GWh (2017). This implies that the assumption of obtaining 70% of the theoretical biogas potential and a co-digestion effect of +10% in predictive study represented a conservative approach for estimating the production.
The impacts from transport turned out to be larger than estimated in the predictive study. The predictive study included the amount of food waste available in the region as a basis for establishing the plant. The transport distances were not known and were based on best estimates. It was assumed that food waste was collected with a waste collection truck with an average transport distance of 19 km, reloaded and further transported 12 km to the biogas plant. An average distance of 13 km was assumed for transport of manure to the plant and 15 km for transport of digestate back to the farms. During the monitoring programme, more accurate data was collected. Once the plant was established, food waste from households and industry outside of the region was also used as a substrate, increasing the transport distances and thus the environmental impacts associated with the transport. The average transport distance for collection of food waste was estimated to be 69 km. After collection, the waste is reloaded and transported in average 54 km to the anaerobic digestion plant. The transport distances from livestock farms supplying manure to the plant and for farms receiving biofertiliser were calculated to be 24 km in average, which was 11 km longer than predicted. This shows that a more conservative approach for estimating transport distances could be advisable when performing predictive studies.
The life cycle phase anaerobic digestion also caused higher impacts in the monitoring study than assumed in the predictive study. In the predictive study no fugitive emissions of methane were included, but a methane loss of 1.5% from the upgrading process was assumed. During the monitoring study, a total loss of 2-3% was estimated based on measurements [34], where of about 45% of these were attributed to the upgrading process. Some adjustments have been done to the plant and new measurements in 2020 indicate that the fugitive losses now are reduced. Future predictive studies should, nevertheless, include a small share of methane loss as default, to avoid overestimation of emission reductions. Making assumptions about what is substituted when using system expansion is challenging and can causes large uncertainties in LCA [37]. In this specific case, the assumption can be confirmed, that the use of biogas as a fuel for transport actually has led to reductions in the use of diesel. As a consequence of establishing the anaerobic digestion plant and supplying upgraded biogas as a fuel for transport, buses and waste collection trucks that used to run on diesel in the region of Vestfold have now been replaced with gas vehicles that run on upgraded biogas.
The assumptions can also be tested for substitution of mineral fertiliser. A survey performed amongst the farmers in the region documented that the use of digestate actually has reduced the need for mineral fertiliser, both amongst the livestock farms that supply manure and get digestate in return, and amongst cereal farmers that use the digestate as biofertiliser [38].
The predictive study presented in this paper documented that anaerobic digestion of food waste had lower potential impacts on climate change compared with the alternative treatment methods for food waste and livestock manure. It also documented that co-digestion of food waste and manure, and cover on biofertiliser storages provided the most beneficial solution in terms of greenhouse gas reduction. These insights contributed to the decision of establishing a new anaerobic digestion plant.
Performing LCA of non-existing value chains may be challenging, as specific data are unavailable. This requires the LCA practitioner to makeassumptions, to collect data from literature or from similar value chains or to use models that contain standard values. The uncertainties of such predictive studies have not been properly assessed in previous studies.
The comparison between the results from the predictive and the monitoring study in this paper showed that some impacts were higher, and some were lower than forecasted. The net results were, however, within an acceptable range. The benefit of substituting fossil fuel turned out to be greater (more biogas was produced than anticipated). An additional finding was that the burdens from transport and diffusive emissions were also greater. In total, the net effect was quite close to the estimates (4% and 12% deviation).
This exercise showed that a conservative approach is advisable when it comes to estimating the transport distances, and that a small percentage of methane leakage should be included. Although the production volume of biogas was higher than expected, a conservative approach is advisable, as some activities may cause larger impacts than expected. In this way one ensures that the potential reductions of environmental impacts are not over-estimated.
The BioValueChain-model, which was applied in the predictive study for calculating the environmental impacts, turned out to be a useful tool for these types of evaluations, and the standard values in the model can be concluded to be within an acceptable range.
The authors would like to thank Greve Biogas for providing data over many years and the other researchers taking part in the associated research projects. Development of the BioValueChain models and the predictive study was funded by the Norwegian Agriculture Agency and the Norwegian Research Council (228821). The monitoring research was funded by Innovation Norway. This article was written as part of the EnviSafeBioC project - contract No PPI/APM/2018/1/00029/U/001. The project is financed by the Polish National Agency for Academic Exchange (NAWA).
- , Circular Economy Strategy. Closing the loop - An EU action plan for the Circular Economy, 2015
- ,
Edible food waste from Norwegian households—Detailed food waste composition analysis among households in two different regions in Norway ,Resources, Conservation and Recycling , Vol. 109 ,pp 146-154 , 2016, https://doi.org/10.1016/j.resconrec.2016.03.010 - , Utsortering og materialgjenvinning av biologisk avfall og plastavfall. Utredning av konsekvenser av forslag til forskrift for avfall fra husholdninger og liknende avfall fra næringslivet (2017/12503) Separation and material recycling of biowaste and plastic waste. Investigation of consequences of proposed regulation for household waste and similar waste from industry. Available in Norwegian only., 2018
- , Nasjonal tverrsektoriell biogasstrategi. (National cross sectoral biogas strategy.) Available in Norwegian only, 2014
- , Virkemidler for økt bruk og produksjon av biogass. In Norwegian only: Instruments for increased use and production of biogas. M-1652, 2020
- ,
Economic and Technical Evaluation of Flexible Power Generation Scenarios for a Biogas Plant ,J. sustain. dev. energy water environ. syst. , Vol. 8 (2),pp 328-343 , 2020, https://doi.org/10.13044/j.sdewes.d7.0289 - , Country reports. Norway - 2018 update. Bioenergy policies and status of implementation. IEA Bioenergy 09 2018, 2018
- , Reduction of environmental impacts through optimisation of biogas value chains. Drivers, barriers and policy development. PhD thesis 2018:6, Norwegian University of Life Sciences, 2018
- , Life cycle assessment : A governance tool for transition towards a circular bioeconomy?, 2019
- ,
Environmental systems analysis of biogas systems—Part I: Fuel-cycle emissions ,Biomass and Bioenergy , Vol. 30 (5),pp 469-485 , 2006, https://doi.org/10.1016/j.biombioe.2005.11.014 - ,
Agricultural anaerobic digestion plants: What LCA studies pointed out and what can be done to make them more environmentally sustainable ,Applied Energy , Vol. 179 ,pp 669-686 , 2016, https://doi.org/10.1016/j.apenergy.2016.07.029 - ,
Influence of different practices on biogas sustainability ,Biomass and Bioenergy , Vol. 53 ,pp 149-161 , 2013, https://doi.org/10.1016/j.biombioe.2013.02.020 - ,
The BioValueChain model: a Norwegian model for calculating environmental impacts of biogas value chains ,The International Journal of Life Cycle Assessment , Vol. 20 (4),pp 490-502 , 2015, https://doi.org/10.1007/s11367-015-0851-5 - ,
A life cycle approach to the management of household food waste – A Swedish full-scale case study ,Waste Management , Vol. 31 (8),pp 1879-1896 , 2011, https://doi.org/10.1016/j.wasman.2011.02.026 - ,
Effects of pre-treatment technologies on quantity and quality of source-sorted municipal organic waste for biogas recovery ,Waste Management , Vol. 27 (3),pp 398-405 , 2007, https://doi.org/10.1016/j.wasman.2006.02.014 - ,
Need for improvements in physical pretreatment of source-separated household food waste ,Waste Management , Vol. 33 (3),pp 746-754 , 2013, https://doi.org/10.1016/j.wasman.2012.06.012 - ,
Importance of food waste pre-treatment efficiency for global warming potential in life cycle assessment of anaerobic digestion systems ,Resources, Conservation and Recycling , Vol. 102 ,pp 58-66 , 2015, https://doi.org/10.1016/j.resconrec.2015.06.012 - ,
Environmental systems analysis of biogas systems—Part II: The environmental impact of replacing various reference systems ,Biomass and Bioenergy , Vol. 31 (5),pp 326-344 , 2007, https://doi.org/10.1016/j.biombioe.2007.01.004 - ,
Life cycle assessment of biogas upgrading technologies ,Waste Management , Vol. 32 (5),pp 991-999 , 2012, https://doi.org/10.1016/j.wasman.2011.12.016 - ,
Biomass sustainability criteria: Greenhouse gas accounting issues for biogas and biomethane facilities ,Energy Policy , Vol. 87 ,pp 95-109 , 2015, https://doi.org/10.1016/j.enpol.2015.08.031 - ,
Modelling of environmental impacts from biological treatment of organic municipal waste in EASEWASTE ,Waste management (New York, N.Y.) , Vol. 31 (4),pp 619-630 , 2011, https://doi.org/10.1016/j.wasman.2010.10.025 - ,
Biowaste-to-biomethane or biowaste-to-energy? An LCA study on anaerobic digestion of organic waste ,Journal of Cleaner Production , Vol. 174 ,pp 462-476 , 2018, https://doi.org/10.1016/j.jclepro.2017.10.320 - ,
Biogas production by means of an anaerobic-digestion plant in France: LCA of greenhouse-gas emissions and other environmental indicators ,Science of The Total Environment , Vol. 670 ,pp 1226-1239 , 2019, https://doi.org/10.1016/j.scitotenv.2019.03.211 - ,
The environmental effect of substituting energy crops for food waste as feedstock for biogas production ,Energy , Vol. 137 ,pp 1130-1143 , 2017, https://doi.org/10.1016/j.energy.2017.04.137 - ,
LCA for household waste management when planning a new urban settlement ,Waste Management , Vol. 32 (7),pp 1482-1490 , 2012, https://doi.org/10.1016/j.wasman.2012.03.018 - ,
Optimising Anaerobic Digestion of Manure Resources at a Regional Level ,Sustainability , Vol. 10 (1),pp 286 , 2018, https://doi.org/10.3390/su10010286 - ,
Life cycle assessment of energy from waste via anaerobic digestion: A UK case study ,Waste Management , Vol. 34 (1),pp 226-237 , 2014, https://doi.org/10.1016/j.wasman.2013.09.013 - , ISO 14040:2006 Environmental management -- Life cycle assessment -- Principles and framework, 2006
- , ISO 14044:2006 Environmental Magament - Life Cycle Assessment - Requirements and guidelines, 2006
- , ILCD handbook. International Reference Life Cycle Data System. General guide for Life Cycle Assessment. Detailed guidance, 2010
- , Supporting Environmentally Sound Decisions for Waste Management. A technical guide to Life Cycle Thinking (LCT) and Life Cycle Assessment (LCA) for waste experts and LCA practitioners, JRC Scientific and Technical Reports, 2011
- , Klimanytte for biogassproduksjon ved Vesar AS. Arbeidsrapport. Greenhouse gas accounting for biogas production at VESAR. Working report. Available in Norwegian Only. Østfoldforskning AS. AR 03.13, 2013
- , Characterisation method, GWP 100 a v.1.02, 2007
- ,
Følgeforskning: Den Magiske Fabrikken. Miljø- og økonomianalyse (åpen versjon). Monitoring research: The Magic Factory. Environmental and economic assessment. Available in Norwegian only. Østfoldforskning report OR 24.17 , 2017 - ,
Følgeforskning Greve Biogass -masse- og energibalanser, økonomi og klimanytte. Monitoring research of Greve Biogass -mass and energy balance, economy and climate benefit. Available in Norwegian only. REALTEK report 57 , 2017 - , Climate Change 2013. The Physical Science Basis. Working Group I contribution to the Fifth Assessment Report of the Intergovernmental Panel on Climate Change (IPCC), 2013
- ,
Allocation and ‘what-if’ scenarios in life cycle assessment of waste management systems ,Waste Management , Vol. 27 (8),pp 997-1005 , 2007, https://doi.org/10.1016/j.wasman.2007.02.013 - , Evaluering av pilotordning for tilskudd til husdyrgjødsel til biogassproduksjon. Evaluation of pilot scheme for economic support for livestock manure for biogas production. Available in Norwegian only. Østfoldforskning report OR 04.10, 2019