


The built environment sector accounts for a significant proportion of global energy use and energy-related emissions [1]. It is responsible for up to 35% of the total final energy consumption and is increasing fast [2]. Reducing buildings' energy consumption is crucial towards meeting the global carbon emission reduction targets and will require innovative methods. Major energy consumers in buildings include the heating, ventilation and air-conditioning (HVAC), hot water, lighting and appliances. While HVAC systems and their associated operations are responsible for up to 40% of the total consumption [3]. This is even higher in areas with harsh or extreme climates. Enhancing the efficiency or minimising the consumption of such systems will go a long way towards developing the low carbon economy and future. Solutions such as occupancy-based controls can achieve significant energy savings by eliminating unnecessary energy usage.
A significant element affecting the usage of these energy consumers is the occupants' behaviour [4]. For instance, rooms in offices or lecture theatres are not fully utilised or occupied during the day, and in some cases, some rooms are routinely unoccupied. Current standards and guidelines such as the ASHRAE 90.1 [5] and ASHRAE 55 [6] suggest a generalised set point range and schedule for room heating and cooling during occupied and unoccupied hours. For example, during occupied hours, it suggests 22 27°C for cooling and 17 22°C for heating, while during unoccupied hours, it suggests 27 30°C for cooling and 14 17°C for heating. However, according to Papadopoulos [7], these HVAC setpoint configurations must be revised when applied to commercial buildings. The use of fixed or scheduled set points combined with varying occupancy patterns could lead to rooms frequently being over or under-conditioned. This may lead to significant waste in energy consumption [8] which can also impact thermal comfort and satisfaction [9]. Delzendeh et al. [10] also suggested that the impact of occupancy behaviour has been overlooked in current building energy performance analysis tools. This is due to the challenges in modelling the complex and dynamic nature of occupant's patterns, influenced by various internal and external, individual and contextual factors. Peng et al. [11] collected occupancy data from various offices and commercial buildings and have identified that occupancy patterns vary between different office types. Multi-person office spaces regularly achieve occupancy rates of over 90%. However, private, single-person offices rarely achieve an occupancy rate of over 60%. While equipment or appliances in offices can be kept in operations during the entire working day, irrespective of occupancy patterns [12]. The study by Chen et al. [13] highlighted that occupancy behaviour is a major contributing factor to discrepancies between the simulated and actual building performance. In current building energy simulation (BES) programs, the occupancy information inputs are also static and lack diversity, contributing to discrepancies between the predicted and actual building energy performance.
This indicates the need to develop solutions such as demand-driven controls that adapt to occupancy patterns in real-time and optimise HVAC operations while also providing comfortable conditions [14]. These systems take advantage of occupancy information to reduce energy consumption by optimising the scheduling of the HVAC and other building systems such as passive ventilation [15] and lighting [16]. Energy can be saved using demand-driven solutions by (1) adjusting the setpoints to reduce the temperature difference between the outdoor and air-conditioned indoor space and (2) reducing the operation time of the systems.
The integration of occupancy information into building HVAC operations can lead to energy savings [17]. The occupancy detection and monitoring approach proposed by Erickson and Cerpa [18] employed a sensor network of cameras within underutilised areas of a building and have shown to provide an average 20.0% annual energy savings and 26.5% savings during the winter months. The study by Shih [19] highlighted that offline strategies for pre-defined control parameters cannot handle all variations of building configurations, particularly the large numbers of humans and their various behaviors.
Information on real-time occupancy patterns is central to the effective development and implementation of a demand-driven control strategy for HVAC [20]. Several sensors and technologies [21] can be used to measure and monitor real-time occupancy. Nagy et al. [22] presented the use of motion sensors to monitor occupancy activity throughout the day. Various types of environmental sensors have been employed in buildings for automation and controls, temperature and ventilation control, fire detection, and building security systems [23]. Wearable-based technologies have been increasingly popular for human detection and activity analysis in the indoor environment [24]. Furthermore, Wi-Fi enabled internet of things (IoT) devices are increasingly being used for occupancy detection [25]. To some extent, these sensor-based solutions provide accurate detection of occupancy patterns. Previous works, including [20], [25], have shown these strategies' capabilities in sensing occupancy information through the count and location of occupants in spaces and aid demand-driven control systems. However, there is limited research on sensing the occupants' actual activities, which can affect the indoor environment conditions [26], [27]. The activities of occupants can affect the internal heat gains (sensible and latent heat) in spaces directly [26] and indirectly towards other types of internal heat gains [27]. The real-time and accurate predictions of the occupants' heat emitted with various activity levels can be used to estimate better the actual heating or cooling requirements of a space. A potential solution is to use artificial intelligence (AI) based techniques such as computer vision and deep learning to detect and recognise occupants' activities [28].
Several works [29], [30] have already implemented vision-based deep learning methods to identify human activities and have shown to be capable of learning features from new sensor data and predicting the associated movement. Most of these studies attempted to improve the performance and accuracy of the deep learning model for human presence and detection activity classification rather than using the data to seek solutions to minimise unnecessary energy loads associated with buildings. Furthermore, no work has attempted to predict the associated sensible and latent heat emission from the occupants, which affects the temperature and humidity levels in an internal space. Furthermore, limited studies conducted tests of vision-based deep learning methods in an actual office environment and assessed its performance in energy savings and indoor environment quality. Finally, the heat emission profiles generated can also be used as input for building energy simulation (BES) tools, increasing the reliability of results since unpredictability of occupant behaviour is one of the parameters that create difficulties for BES.
The present work aims to address the research gaps by using a vision-based deep learning method that enables the real-time detection and recognition of multiple occupants' activities within office building spaces. A faster region-based convolutional neural network (Faster R-CNN) was used to enable training of a classification model which was deployed to a camera for detecting occupancy activities. This method can identify multiple occupants within an indoor space and the activities performed by each. Validation of the developed deep learning model is conducted by using a set of testing data, and the accuracy and suitability for live detection were also evaluated. Experiments are carried out within a case study office room to test the proposed approach's capabilities and accuracy. Using BES, the case study building was simulated with both static' and deep learning influenced profiles (DLIP) to assess the potential energy savings that can be achieved.
The following section presents an overview of the research method with the corresponding details for each stage of the proposed framework to develop a vision-based method for detecting and recognising occupancy activities.
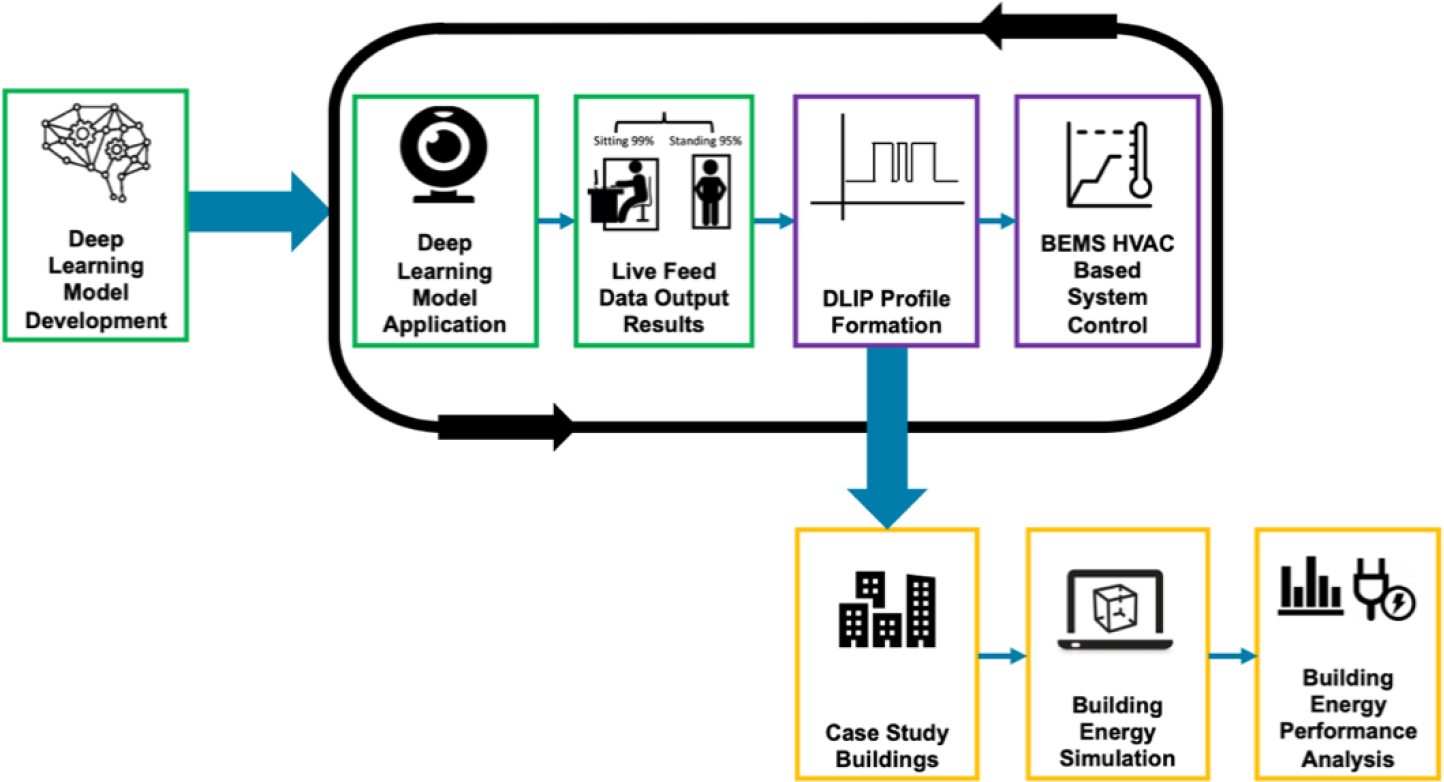
Figure 1 presents an overview of the research method. It consists of three main sections. Section 1 (highlighted in green) is the formation and application of a deep learning model for occupancy activity detection and recognition. The model based on a convolutional neural network (CNN) was trained, validated and deployed to an AI-powered camera. Section 2 is the formation of the deep learning influenced profiles (DLIP) using the live occupancy detection within the office space. The DLIP can be fed into a building energy management system and controls of the building heating, ventilation and air-conditioning (HVAC) system to make adjustments based on the actual building conditions while minimising unnecessary loads. However, for the initial analysis (yellow boxes), the DLIP profiles were inputted into building energy simulation to identify potential reductions in building energy consumption and changes within the indoor environment (Section 3). Further details of the steps described in Figure 1 are discussed in the next sub-sections.
Overview of the proposed framework of a vision-based deep learning method to detect and recognise occupancy activities
Deep learning is a class of machine learning technique utilised to implement object classification, speech recognition, vehicle and pedestrian detection with high accuracy. Compared with other shallow learning methods, deep learning techniques can lead to better performance in detecting and recognising objects. Many studies [31], [32] showed that deep learning models with a convolutional neural network (CNN) based architecture could perform computer vision tasks with high accuracy. Convolutional Neural Network (CNN) is a deep learning network class that is extensively used for image-based classification and recognition applications. Compared with other machine learning-based classification techniques, CNN requires input data in the form of videos or images and can directly feed the data in its original form into the framework model. Instead of performing complex pre-processing stages, the data can be used to derive directly and extract the acquired features from the selected parts of an image [33]. Therefore, CNN algorithm is selected in this study.
In general, the CNN architecture consists of a feedforward network with the input data such as an image is processed through the network. The feature of the data from input images is first extracted within the convolutional layers, and then the spatial volume of the input data is reduced in the pooling layer. The fully connected (FC) layer is then used to classify images between different categories by training. A fully connected layer involves weights, biases, and neurons. The output layer then delivers the outcome of the calculations and extractions. For these layers, the configuration is presented in the form of groups, indicated as stacked modules to present the structure of a deep learning model. The rectified linear unit (ReLU) layer consists of advantages due to its simple function and sparse features, which can minimise training duration. Furthermore, the SoftMax layer provides further constraint to aid the training of the model. Both the ReLU and softmax layers are essential to building CNN architectures for various applications. This includes vision-based applications such as object detection [34] and face recognition [35] and also data analysis and other programmatic marketing solutions [36].
As detailed in [37], [38], the convolutional layers are the first layer to exact features from the input data. It plays a central role in the architecture by utilising techniques to convolve the input data (image). This performs the stages of learning the feature representations while extracting without manual work. Neurons located within each of the convolutional layers are arranged into feature maps. This enables convolution to preserve the relationship between pixels by learning image features using small squares of input data through a mathematical operation. It takes the image matrix and a filter or kernel and passes the result to the next layer through convolutional kernels stride over the whole image, pixel by pixel, to create 3-direction volumes (height, width and depth) of the feature maps.
Then, the ReLU layer introduces nonlinearity into the output neuron. It is an activation function defined as a piecewise linear function that is used to enable direct output when the input was positive or otherwise as a zero output when a negative input is received. According to LeCun, [39], ReLU has become a default activation function for many types of neural networks because a model that uses it is easier to train and often achieves better performance. Through this, the volume size will not be affected while the nonlinear properties of the decision function will be enhanced during this process, resulting in an enrichment of the expressions of an image. Subsequently, the pooling layers enables the reduction in the spatial dimensions of the data (width, height) of the feature maps when the images are too large. For this, the most common spatial pooling type of Max Pooling was selected as it outperforms on processing image datasets [40]. It effectively selects the largest element within each receptive field from left to right, so the output's spatial size is reduced.
Since several convolutional and pooling layers are formed in stacks to enable greater amounts of feature extraction, the fully connected (FC) layers follow on from these layers and interpret the feature representations and perform the function of high-level reasoning to flatten the matrix into a vector form. Combining the features together, the FC layers connect every neuron from one layer to every neuron in another layer. This forms the model, and along with the activation function of SoftMax, it enables the classification of the input images, which generates the classified output results of one of the following occupancy activities.
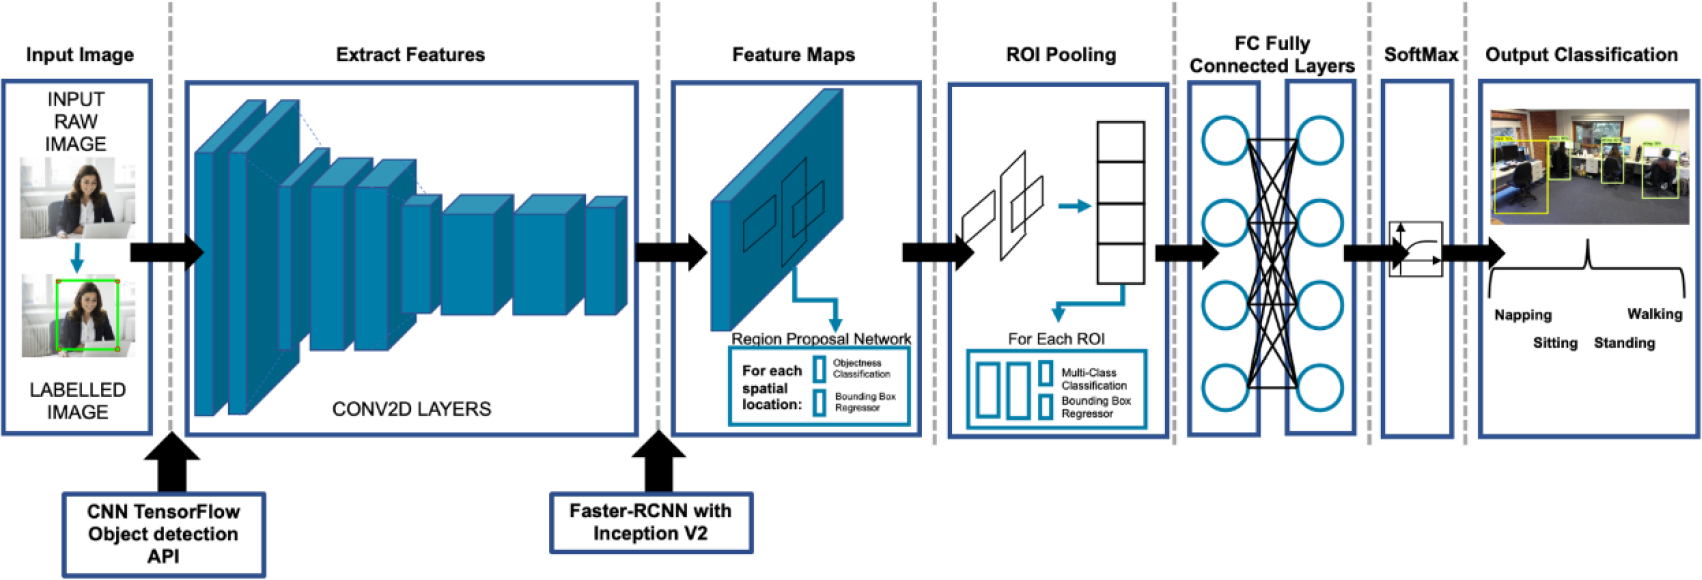
The exceptional image classification performance of CNN [41], along with its flexibility [42] and popularity within the industry [43] influenced the selection of CNN over other neural network techniques when developing the vision-based occupancy detection and recognition solution. Derived from the understanding of the CNN, Figure 2 presents the CNN based deep learning model configured for the training of the model for occupancy activity detection and recognition. Further discussion of model configuration is outlined within the following sub-sections.
Since this approach is designed to be useful for wider applications to solve other problems related to occupant detection within buildings [44], the deep learning model (Figure 2) was developed and tested following the steps given in Figure 3 to provide a vision-based solution. Part 1 consists of the process of data collection and model training. Images of various types of occupancy activities are collected and processed through manual labelling of the images. Through the analysis of various types of deep learning models, the most suitable type of convolutional neural network-based deep learning model was selected. This was configured specifically for this type of detection approach to provide the model outlined in Figure 2. Next, the model was trained and deployed to an AI-based camera to allow the real-time detection and recognition of occupancy activities, as indicated in Part 2 of the workflow.
Convolutional Neural Network (CNN) based deep learning model configured for the training of the model for occupancy activity detection and recognition
The workflow of the deep learning method for model development and application
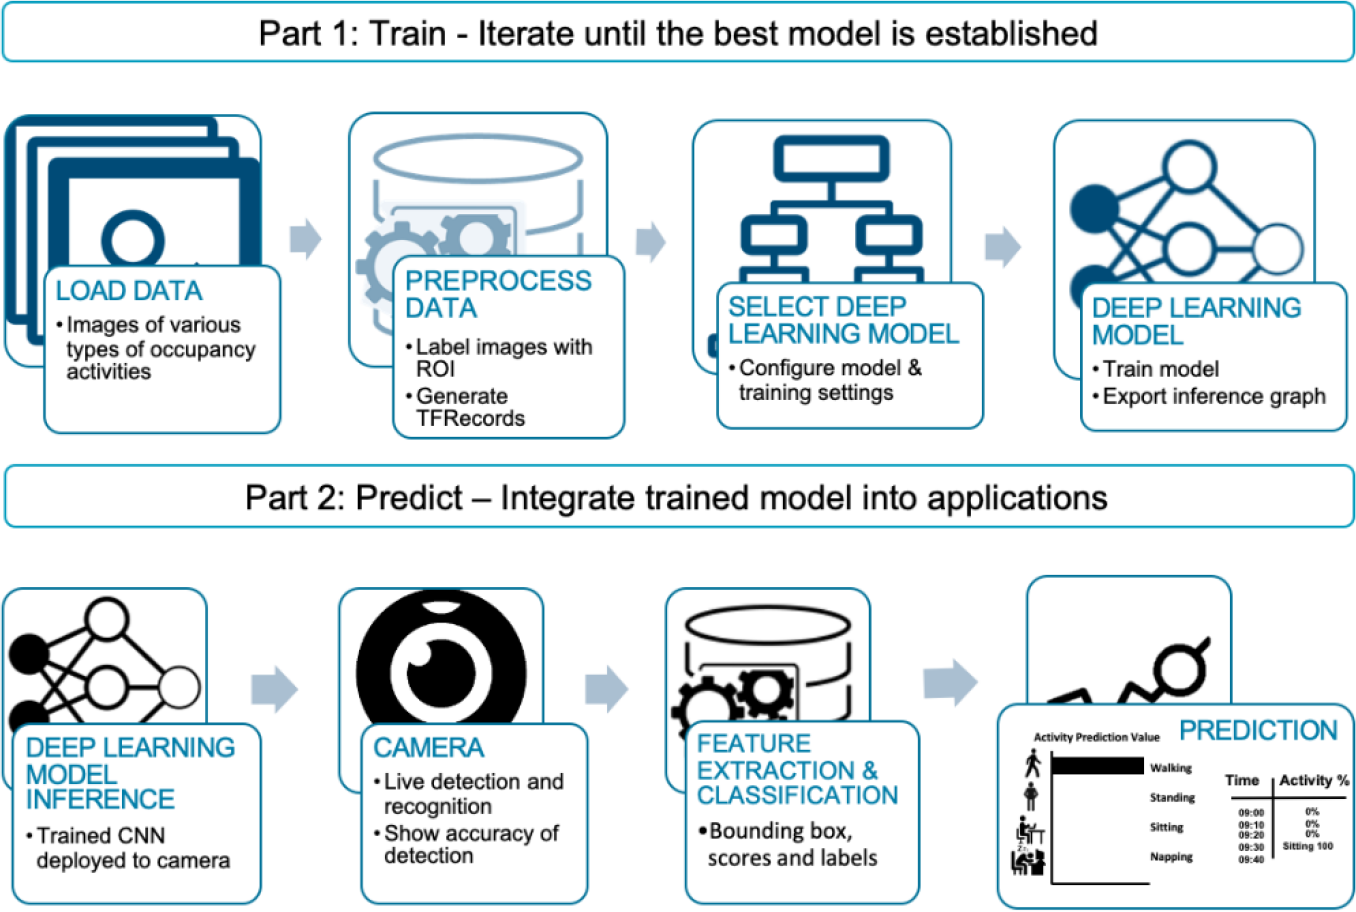
As indicated in Figure 3, the initial stage of the development of the deep learning detection model was to collect relevant input data. Data in the form of images were selected to create large training and testing datasets. For the initial study, the selected data were limited to the most common activities performed in office spaces. The number of images within the datasets followed the rule of thumb and suggestion given by Ng [45]. Table 1 presents the number of images used within the initial development and the images categories based on the selected activity responses. Further development of the method will be carried out in future works by building larger datasets with greater responses and predictions.
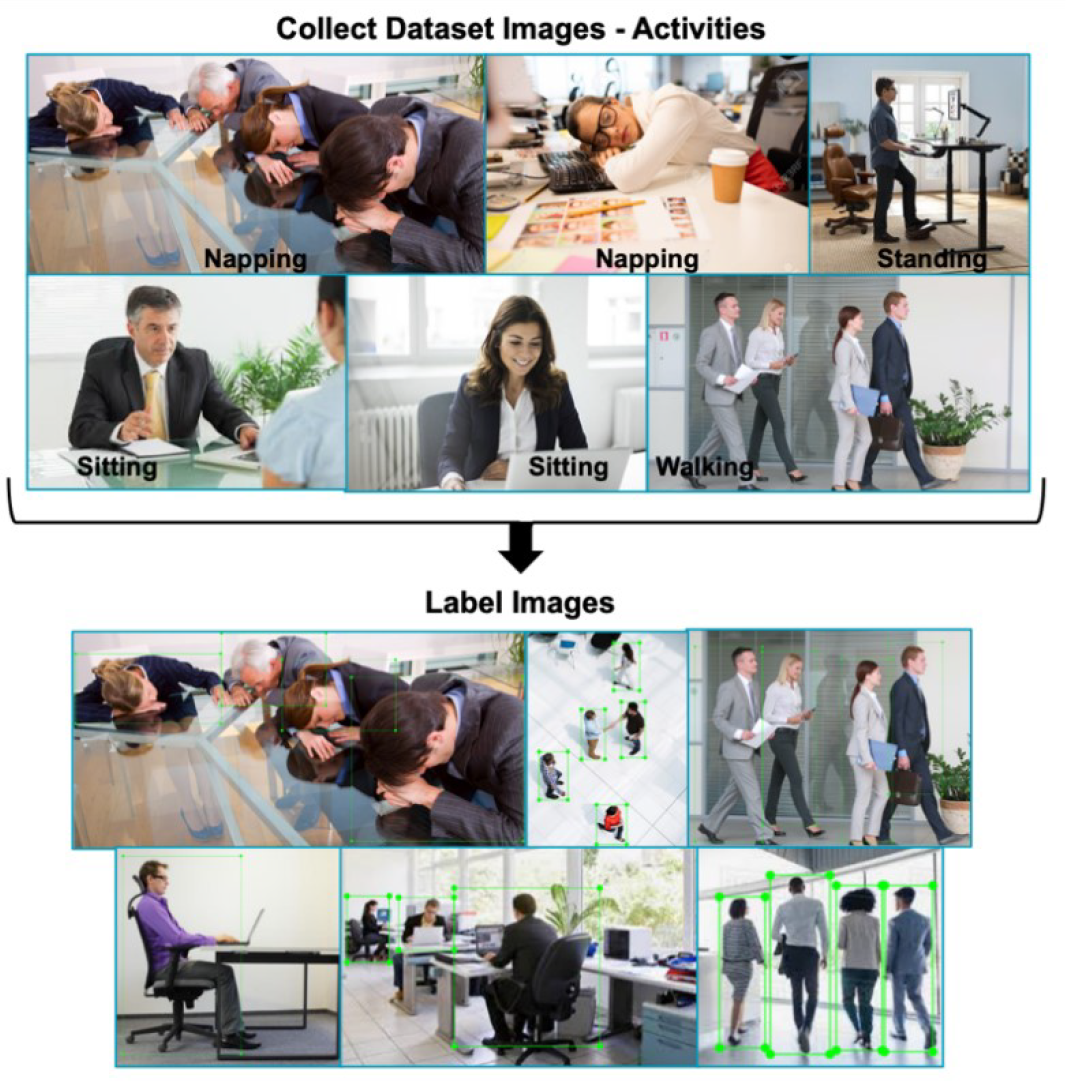
All images obtained were pre-processed to the desired format before enabling the data to become ready for model training. The images were manually labelled using the software LabelImg [46]. This is an open-source graphical image annotation tool which allows images to be labelled with bounding boxes to specifically identify the regions of best interest. For some cases, multiple numbers of labels were assigned to each image as this was highly dependent on each image. Hence, the number of labels given in Table 1 was greater than the number of images used. Figure 4 shows an example of the images located within the training and testing datasets of various occupancy activities and how the bounding boxes were assigned around the specific region of interest for each image.
The number of images and labels per category
| Number of Images | Number of Labels | |||||
|---|---|---|---|---|---|---|
| Activity | Training | Testing | Total | Training | Testing | Total |
| None | 100 | 20 | 120 | 108 | 25 | 133 |
| Napping | 100 | 20 | 120 | 100 | 20 | 120 |
| Sitting | 100 | 20 | 120 | 146 | 26 | 172 |
| Standing | 100 | 20 | 120 | 131 | 26 | 157 |
| Walking | 100 | 20 | 120 | 177 | 35 | 212 |
| Total | 500 | 100 | 662 | 132 | ||
Example images of various occupancy activities used within the image dataset for training and testing, which were obtained from a relevant keyword search in Google Images; the images were prepared via the labelling of the region of interest (ROI) of each image
As discussed, the Convolutional Neural Networks (CNN) was selected as the main type of network architecture. CNN is designed to perform modelling for computer vision-related tasks (recognition, classification and detection) with image datasets [45] and have been extensively used for deep learning object detection projects.
Following the selection of CNN as a suitable model, the model requires further configuration to provide an applicable framework for multiple occupancy activity detections. Suitable deep learning framework platforms that were previously used to form effective detection models were explored. Many deep learning framework libraries and platforms such as TensorFlow, PyTorch and Keras are highly popular and is recommended according to Google Trends (as of February 2020) [47]. Along with the comparison of deep learning frameworks by Fonnegra et al. [48], it suggests that TensorFlow is one of the most employed tools used for deep learning due to its capabilities, compatibility, speed, and support it provides. TensorFlow is an end-to-end open-source machine learning platform [49], it provides an efficient implementation of advanced machine learning algorithms along with the ability to test novel configurations of deep learning algorithms and to demonstrate the robustness. According to previous works, many choose TensorFlow as the desired platform for the development of solutions for building-related applications. This includes [50] where TensorFlow has been used as a platform to train the desired deep learning model. Vázquez-Canteli et al. [51] fused TensorFlow technique with BES to develop an intelligent energy management system for smart cities and Jo and Yoon [52] used TensorFlow to establish a smart home energy efficiency model.
Additionally, the provision of pre-existing open-source deep learning-based models by TensorFlow, such as the CNN TensorFlow object detection application programming interface (API) [53] enabled researchers to use this framework as the base configuration for detection-based applications. This includes the applications in [53]-[55] which effectively fine-tuned the model to improve accuracy and to adapt for the research desired detection purposes. This object detection model is part of the TensorFlow pre-defined model's repository; it consists of incorporating high levels API's and includes the ability to localise and identify multiple objects in a single image. Therefore, the TensorFlow platform with the CNN TensorFlow object detection API was employed for the development of a suitable model for occupancy activity detection.
To train the convolutional neural network model, the general process requires defining the network architecture layers and training options. Through the influence of existing research which utilised the CNN TensorFlow Object detection API, a transfer learning approach was incorporated into the model configuration. Transfer learning is a learning method that leverages the knowledge learned from a source task to improve learning in a related but different target task [56]. This approach enables the development of an accurate occupancy detection model within a reduced network training time and requiring fewer amounts of input data, but still provides adequate results with high detection and recognition rates. For this occupancy detection model, the network architecture layers were not defined from scratch. Instead, the TensorFlow detection model zoo [57] provided a collection of detection models pre-trained on various large-scale detection-based datasets specifically designed for a wide range of machine-learning research. For object detection, R-CNN [58], SSD-MobileNet [59] and YOLO [60] algorithms were most commonly used. However, if computational time and resource is the priority, SSD would be a better decision. If accuracy is not the priority but the least computational time, is required then YOLO can be employed. Furthermore, the required size of the detection object can have an impact on the performance of the algorithms. According to the study by Alganci et al. [61] which evaluated the impact of object size on the detection accuracy, YOLO achieved the lowest accuracy for any object size in comparison to SSD and R-CNN respectively. Whereas, Faster R-CNN achieved the highest accuracy. The performance achieved for the three types of algorithms widens as object sizes increases. Therefore, to avoid results being dependent on object sizes which is important when detecting occupants, the R-CNN was selected in the present work.
With the substantial benefits of leveraging pre-trained models through a versatile transfer learning prediction and feature extraction approach, an R-CNN model from the TensorFlow detection model's zoo directory [57] was selected. The TensorFlow detection model's zoo consisted of various forms of networks pretrained with the Common Objects in Context (COCO) dataset [62]. These pretrained models are based on the most popular types of R-CNN frameworks used for object detection. Generally, R-CNN works by proposing bounding-box object region of interest (ROI) within the input image and uses CNN to extract regions from the image as output classification. As compared with R-CNN, Fast R-CNN runs faster as the convolution operation is performed only once for each image rather than feeding a number of region proposals to the CNN every time. Both R-CNN and Fast R-CNN employ selective search to look for the region proposals. With regards to this, it commends an effect on the model training computational time and the performance of the network. Faster R-CNN uses the region proposal network (RPN) module as the attention mechanism instead of using selective search to learn the region proposals [53]. Ren et al. [34] introduced the Faster R-CNN algorithm. This similar to Fast R-CNN whereby, it enables input image to feed into the convolution layers and generate a convolutional feature map. Then, the region proposals are predicted by using an RPN layer and reshaped by an ROI pooling layer. The image within the proposed region is then detected by the pooling layer. Overall, all algorithms are suitable to enhance the performance of the network. However, according to the comparison of different CNN-based object detection algorithms [34], Faster R-CNN is much faster than other algorithms, which can be implemented for live object detection [63]. Furthermore, to improve such Faster R-CNN model, the inception module can aid towards the reduction of the required computational time [64] and improves the utilisation of the computing resources inside the network to achieve a higher accuracy [53]. Inception network is presented in many forms. This includes, Inception V1 V4 [64], [65] and also Inception ResNet [66]. Each version is an iterative improvement of the architecture of the previous one.
In this study, the COCO-trained model of Faster R-CNN (With Inception V2) was selected to develop the model for the real-time detection and recognition of occupancy activities. This was chosen due to the performance of Inception V2 and its widespread use for the development of object detections models such as in [34], [66]. Alamsyah and Fachrurrozi [67] used the Faster R-CNN with Inception V2 for the detection of fingertips. Accurate detections of up to 90 94% were achieved across all results, including small variations between fingertips. Hence, this suggests the capabilities of Faster R-CNN with Inception V2 to be able to carry out detection tasks even with small changes. Furthermore, the Faster-R-CNN with Inception V2 trained under the COCO dataset achieved an average speed of 58 ms and a mean average precision (mAP) of 28 for detecting various objects from over 90 object categories [57]. Hence, the model summarised in Figure 2, with the configured architecture and pipeline of the selected CNN model was used for occupancy activity detection. Inputs from the CNN TensorFlow Object Detection API and the Faster R-CNN with Inception V2 model were also identified.
Performance evaluation of the trained model is achieved by using the test images assigned from the test dataset (Table 1). A confusion matrix was used to summarise the detection results of the proposed algorithm, with true positive (TP) representing the correctly identified activity, true negative (TN) representing the correct detection of a different activity, false positive (FP), also known as predicted positive to represent the number of instances that the predicted activity was not true or another activity performed was wrongly identified as this specific activity. Furthermore, false negative (FN) represented the number of instances that the activity was predicted to be something else, but it actually wasn't.
Based on the created confusion matrix, evaluation metrics including, accuracy precision and recall, are used to evaluate the performance of the object detection algorithm. This is defined in eq. (1) (3), respectively. Accuracy defines the proportion of the total number of predictions that were correct, while precision can be seen as a measure of exactness or quality. Additionally, recall is a measure of completeness or quantity. However, it is not sufficient to quantify the detection performance when precision and recall were separately used. With the consideration of a balance between precision and recall, the evaluation metric, F1 score was formed by combining these two measures and expressed as eq. (4).
(1)
(2)
(3)
(4)
Despite the selection of a robust data-driven algorithm, difficulties in terms of accurate identification between several occupant activities could occur. To overcome these, continuous improvement and development of the deep learning network is necessary to provide a sufficiently accurate occupancy activity detection for demand-driven controls. Another drawback of using a vision-based method is that it could interfere with privacy concerns. The present approach will address this by developing a system that only output heat emission profiles instead of actual occupancy information, which can then be inputted into a control system. Further details are given within the next sections.
This section presents the methods required for the application of the deep learning model. It includes the details of the selected case study building and experimental setup, along with the process of live detection and recognition to form the real-time Deep Learning Influenced Profiles (DLIP).
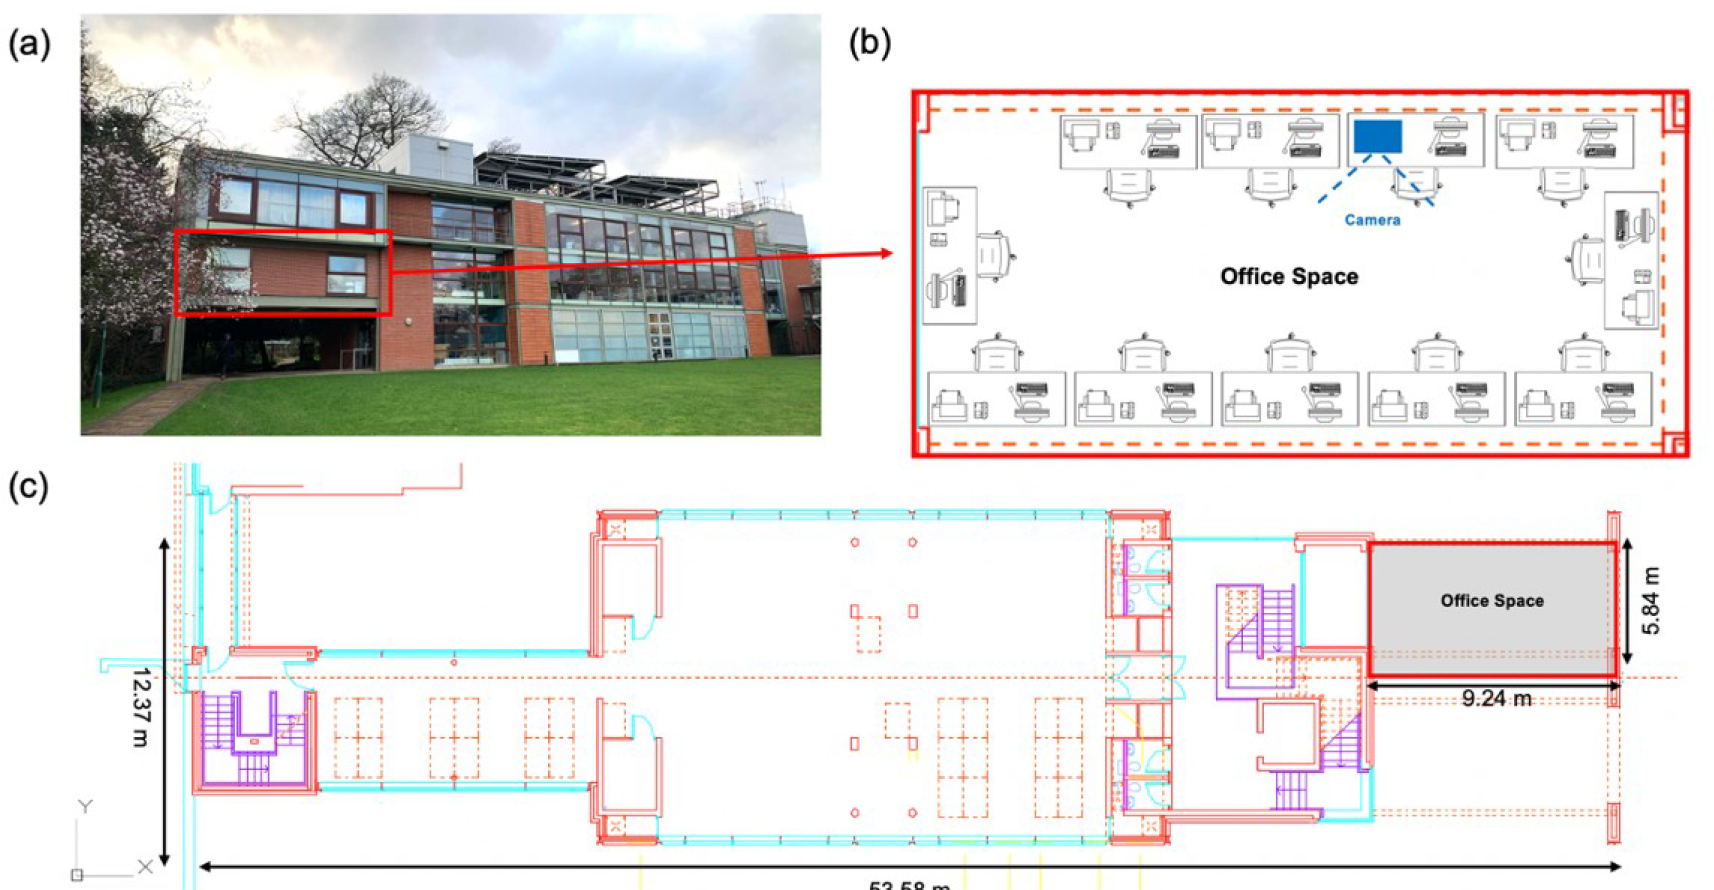
An office space located on the first floor of the Sustainable Research Building at the University Park Campus, University of Nottingham, UK (Figure 5a) was used to perform the initial live occupancy activity detection using the developed deep learning model. This case study building was also used for the initial performance analysis where the office space was modelled using BES tool IESVE [68] to further assess the potential of this framework and the impact towards building energy loads.
Figure 5c presents the floor plan of the 1st floor of the building, with the desired office space highlighted. The selected office space consists of a floor area of 39 m2 with internal dimensions of 9.24 m × 4.23 m and a floor to ceiling height of 2.5 m. Figure 5b presents the experimental setup with the detection camera' located on one side of the room to enable the detection of occupancy situated on the opposite side. The camera used to generate results for this present study was a 1080p camera with a wide 90 degree field of view. This was connected to a laptop which was operated using the trained deep learning model.
Sustainable Research Building at University Park Campus, University of Nottingham, UK: photo (a); experimental set up (b); 1st floor plan (c).
The building operates between the hours of 08:00 to 18:00. This formed the selected hours to perform the experimental occupancy activity detection using the deep learning model. The building is equipped with natural ventilation (manually operated), along with a simple air-conditioning system to provide an internal set point temperature maintained at 21 °C. The Nottingham, UK weather data was inputted into the building energy simulation model. Based on CIBSE Guide A [69], standard occupancy profiles with a sensible and latent heat gain of 70 W/person and 45 W/person was assigned. For the air exchanges, the infiltration rate value was set to 0.1 air changes per hour.
Using the developed deep learning model, a typical cold period was selected to perform the live occupancy activity detection and recognition to assess the capabilities of the method. A range of activities was performed by the occupants. This includes the selected desired detection response types of walking, standing, sitting, and none for when no occupants are present. During the real-time detection, the output data for each of the detected occupants were used to form the occupancy heat emission profiles (DLIP). The profile consists of values corresponding to each detected activity and coupled with the heat emission data-based value for an average adult performing the different activities within an office space given in Table 2.
Selected heat emission rates of occupant performing activities within an office [69]
| Rate of Heat Emission | |||
|---|---|---|---|
| Activity | Total (W) | Sensible (W) | Latent (W) |
| None | 0 | 0 | 0 |
| Napping | 105 | 70 | 35 |
| Sitting | 115 | 75 | 40 |
| Standing | 130 | 75 | 55 |
| Walking | 145 | 75 | 70 |
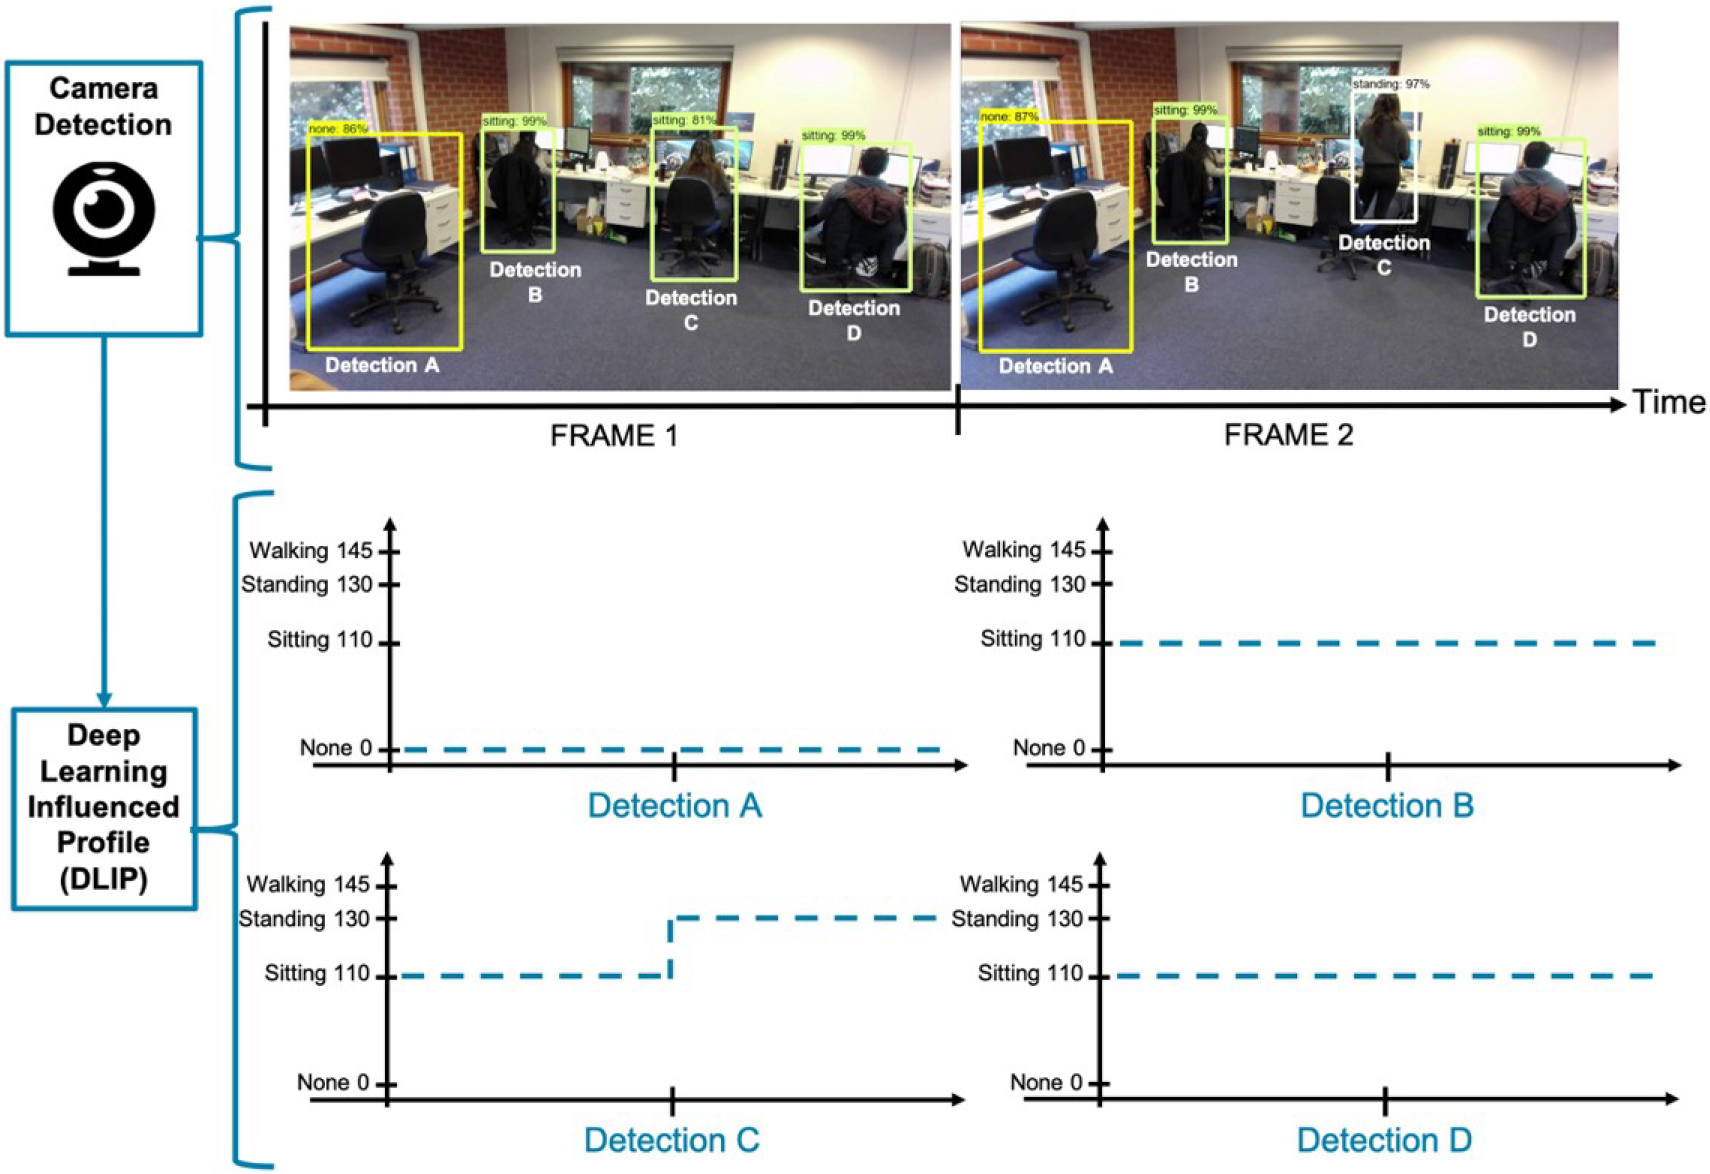
Figure 6 shows an example of the process of DLIP formation for the live detection of occupancy activities within the select office space. It presents several snapshots of the recorded frame indicating the detected occupancy activity condition and the percentage of prediction accuracy. A DLIP was formed for each of the detections. This suggests a total of four DLIP would be created for this individual experiment conducted.
As indicated in Figure 5b, the selected office space was designed to accommodate eleven occupants as eleven office workstations were present. However, for the selected experimental test day, only three occupants were present for the majority of the time. This was achieved based on the number of DLIP generated. Effectively, this method not only recognises the activities performed by occupants in forming the desired DLIP but can also obtain data on the number of occupants present in the desired detection space. This could be useful for other types of applications. Further discussion of the detection and recognition of each detection A, B, C and D, along with the detection of each specific activity, is analysed within the corresponding results section.
Process of forming the deep learning influenced profile from the application of the deep learning approach for occupancy activity detection and recognition
A building energy simulation tool was used to model the office space with the conditions given above. Building energy simulation consists of using a dynamic thermal simulation of the heat transfer processes between a modelled building and its microclimate. Heat transfer processes of conduction, convection, and radiation between each building fabric were modelled and included in the modelling of air exchange and heat gains within and around the building's selected thermal space. The equations are fully detailed in our previous work [70], [71]. The DLIP building occupancy profile was compared with three other profiles; the actual observation profile, and two conventional fixed schedule profiles, Typical Office Profiles 1 and 2. A comparison between the results obtained from these different occupancy profiles enables the analysis of the potential impact of the DLIP profile on the building energy demand. The Actual Observation Profile was formed for the assessment of the accuracy of the DLIP. This profile represents the true occupancy activity performed during the experimental time, enabling verification of the results obtained for the DLIP.
Table 3 summarises the simulation cases and the associated occupancy and building profiles used for the simulation and analysis. The different variations in occupancy profiles were created to compare the DLIP to evaluate the impact of the use of control strategies, informed by real-time multiple occupancy activity detections, on building energy performance. Case 1 and 2, follows current building operational systems based on using static or fixed control setpoints. Typical office 1 assumes that the occupants are sitting most of the time during the selected period (sedentary activity), and Typical office 2 assumes that the occupants are walking most of the time during the selected period. For the simulation cases, maximum sensible and latent occupancy gains of 75 W and 70 W were assigned. This enables representing all activities performed within the office space, with walking being the maximum at 100%, followed by standing at 79%, sitting at 64%, napping at 50%, and none activities would present 0%. Furthermore, occupancy density of one was assigned to each of the DLIP and actual observation profiles. However, for the typical office profiles, it was acknowledged that a maximum number of occupants present within the room on the selected day would be three, so this was assigned as the maximum occupancy density for these cases.
Summary of the occupancy and building energy modelling profiles
| Name | Profile Description | Occupancy | Heating | Ventilation | |
| Internal Gains [69] | |||||
| Max. Sensible Gain (W/person) | Max. Latent Gain (W/person) | Standard constant heating with the setpoint at 21 °C | Standard constant ventilation following a typical office schedule | ||
| Typical Office 1 | Constant sitting between 09:00 – 18:00 | 70 | 45 | ||
| Typical Office 2 | Constant walking between 09:00 – 18:00 | 75 | 70 | ||
| Actual Observation | Based on actual observation of Detection A, B, C, D | 75 | 70 | ||
| Deep Learning Influenced | Based on DLIP Detection A, B, C, D | 75 | 70 | ||
This section presents the initial model training results and the analysis of the experimental results. The section evaluates the application of the real-time occupancy activity detection using the vision-based deep learning approach and the formation of the Deep Learning Influenced Profiles for each of the detected occupants. As detailed in Figure 1, the generated DLIP was intended to inform a demand-driven HVAC control system to optimise building energy performance and conditions. However, prior to the development of such a system, an initial analysis of the feasibility of this method was carried out using BES analysis.
The initial deep learning model was trained using the graphics processing unit (GPU) NVIDIA GeForce GTX 1080. The training approximately took 6 hours 45 minutes for the total losses to reach the level indicated in Figure 7. These training results were obtained using TensorBoard during the training process.
Deep learning model training results using the Faster-R-CNN with InceptionV2 model over the 6 hours 45 minutes training duration: total loss against the number of training steps (a); total classification loss against the number of steps (b)
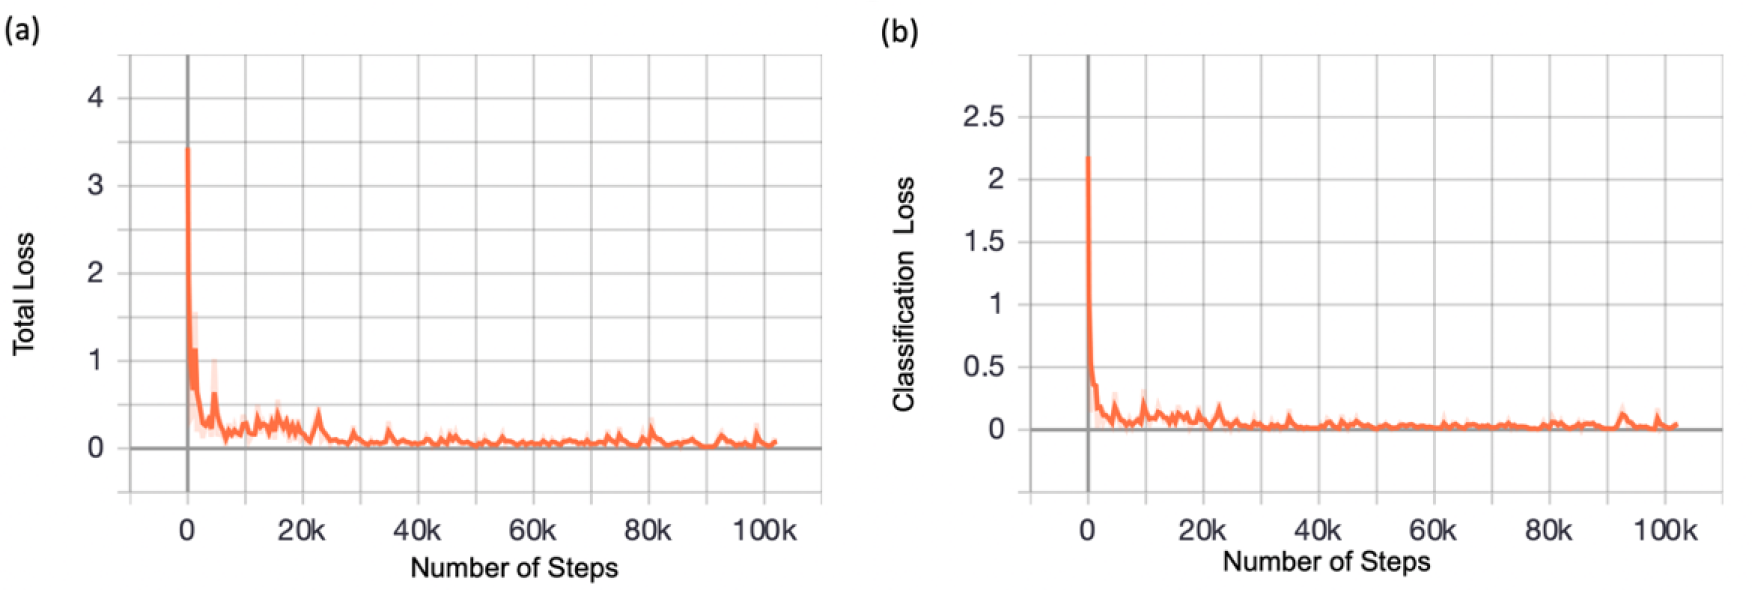
Using the Faster-R-CNN with InceptionV2 as the training model, the results provided training for 102,194 steps from a loss of 3.44 to a minimum of 0.01007. Observations made for this proposed approach can be used to compare the performance of different modifications applied in future works. This includes the input of more training and test data and to variations of the type of models for training. Greater amounts of images will be implemented for testing purposes as the framework is developed further.
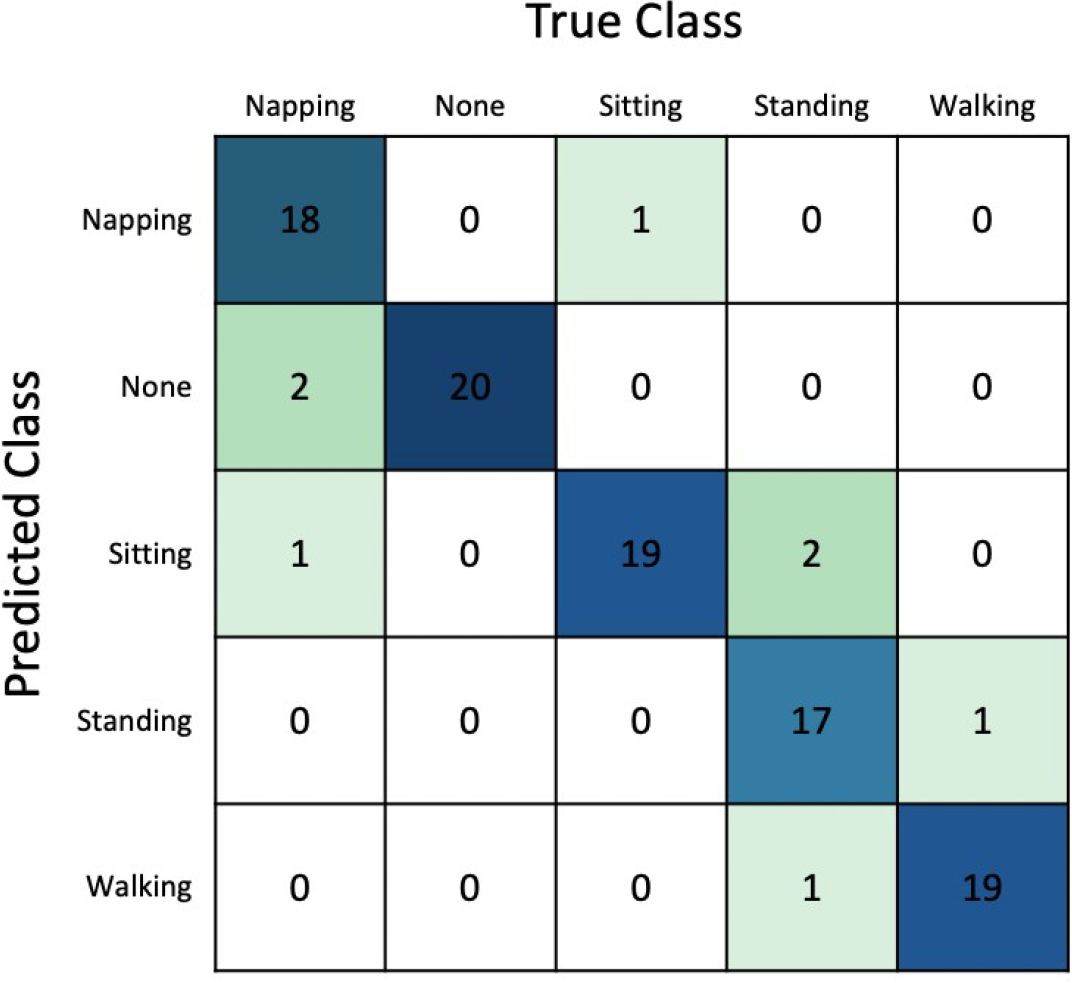
Based on the images assigned to the test dataset (Table 1), Figure 8 presents an example of the confusion matrix. It shows that majority of the images were correctly classified, showing the suitability of the model for occupancy activity classification. Furthermore, Table 4 presents the model performance based on evaluation in terms of the different evaluation metrics. Overall, it suggests that the classification for none' (when the occupant is absent) achieved the highest performance and standing' achieved the lowest. This perhaps is due to the difficulty in recognising the occupancy body form and shape, as it may be confused with the activities of both standing and walking. Nonetheless, an average accuracy of 97.09% was achieved and an F1 Score of 0.9270.
Since this model performance evaluation is based on using still test images assigned in the given testing dataset, therefore, the following experimental detection and recognition results can provide more valuable analysis as occupants progressively move, so the detection evaluation is based on a more realistic scenario, including the background conditions, environment setting and realistic occupants behaviour and actions.
Example of the confusion matrix for occupancy activity classification model
Model performance based on the application of images from the testing dataset
| Class | Activity | Accuracy | Precision | Recall | F1 Score |
|---|---|---|---|---|---|
| 1 | Napping | 96.88% | 0.9474 | 0.9000 | 0.9231 |
| 2 | None | 98.94% | 0.9524 | 1.000 | 0.9758 |
| 3 | Sitting | 95.88% | 0.8636 | 0.9500 | 0.9048 |
| 4 | Standing | 95.88% | 0.9444 | 0.8500 | 0.8947 |
| 5 | Walking | 97.89% | 0.9500 | 0.9500 | 0.9367 |
| Average for all activities | 97.09% | 0.9316 | 0.9300 | 0.9270 | |
Figure 9 presents example snapshots at various times of the day of the experimental test of the detection and recognition of occupants within the selected office space. Based on the set up indicated in Figure 5b, it shows the ability of the proposed approach to detect and recognise occupants. Up to four output detection bounding boxes were present during this experimental detection, and the accuracy for each detection was also presented above the output bounding boxes. As given by the snapshots in Figure 9, these bounding boxes' size and shape varied between each detection interval. It depends on the size of the detected space, the distance of the camera with the detected person, and it is also dependent on the occupant's activity. In practice, these images will not be saved within the system but real-time data (for example, 1 minute intervals) of occupancy number and activities (heat gains) in the form of numerical and text-based is outputted by the system.
Example snapshots at various times of the day of the experimental test of the detection and recognition of occupants within an office space using the deep learning occupancy activity detection approach
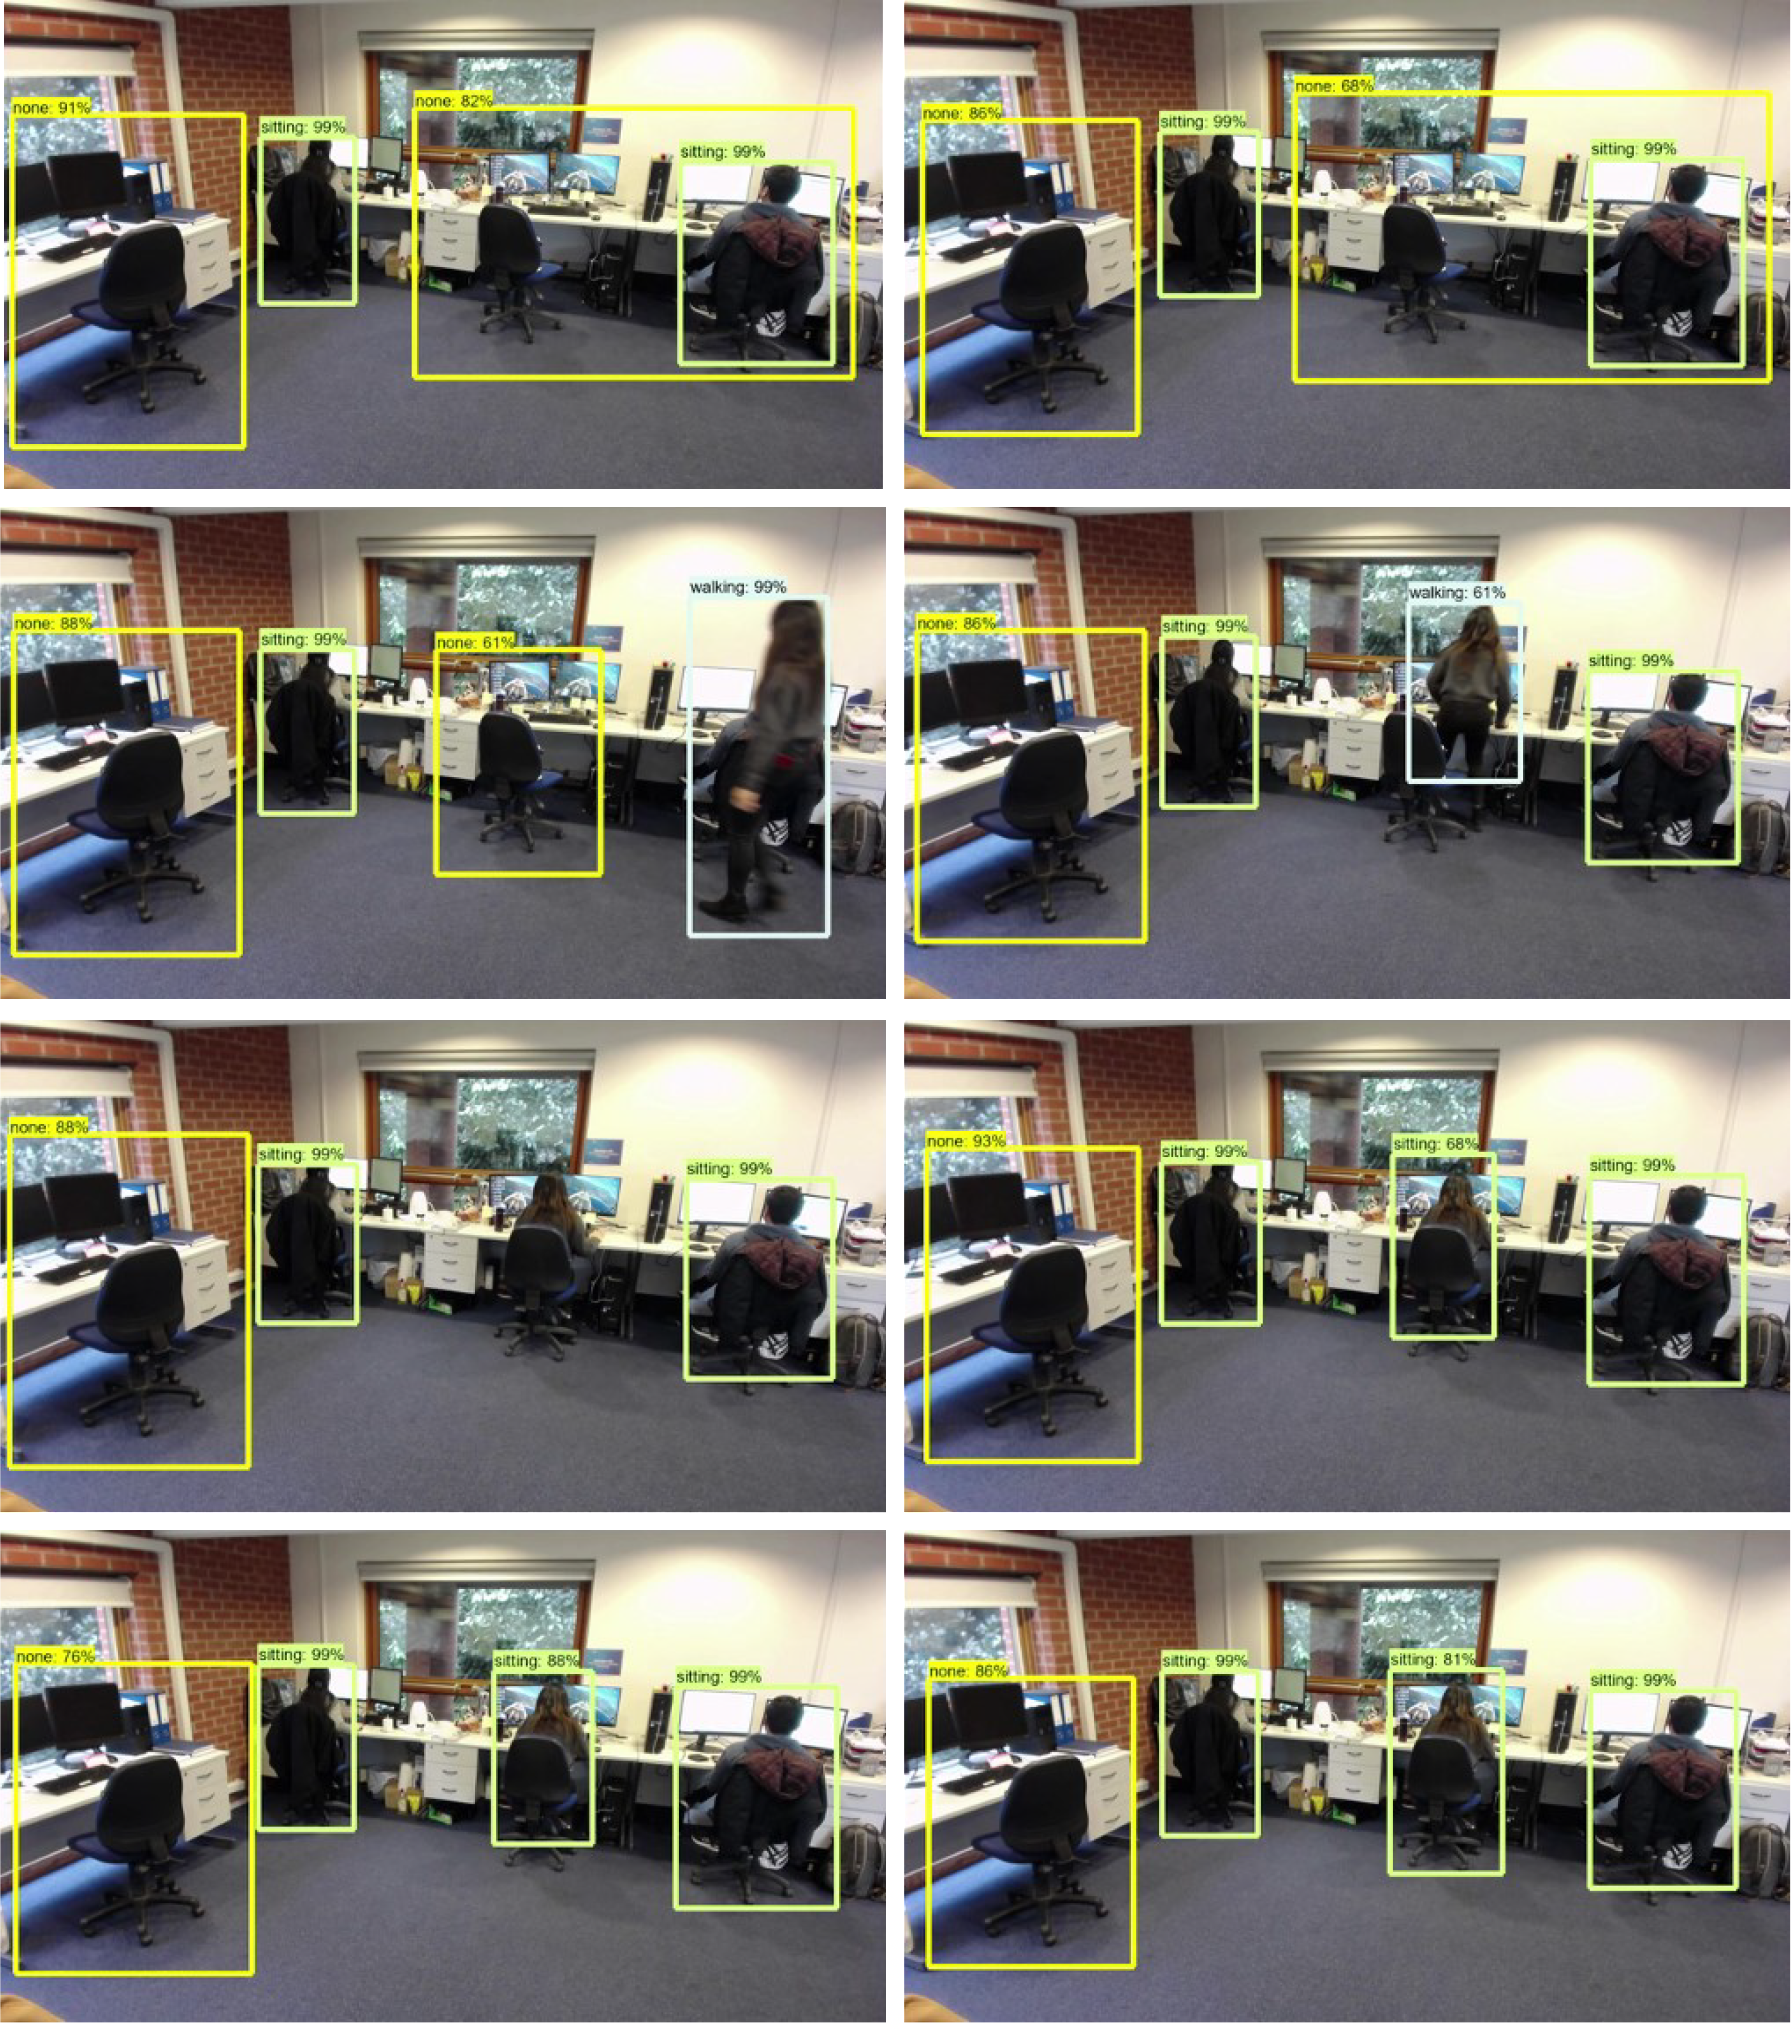
Figure 10 presents the overall detection performance of the proposed approach during the experimental test. The results showed that the approach provided correct detections 97.32% of the time, 1.98% of the time to achieve incorrect detections and subsequently, 0.70% of the time with no detections. It should be noted that the occupants were asked to carry out their typical office tasks. Overall, this indicates that the selected model provides accurate detections within the desired office space.
Overall detection performance during the experimental test, identifying the percentage of time achieving correct, incorrect and no detections
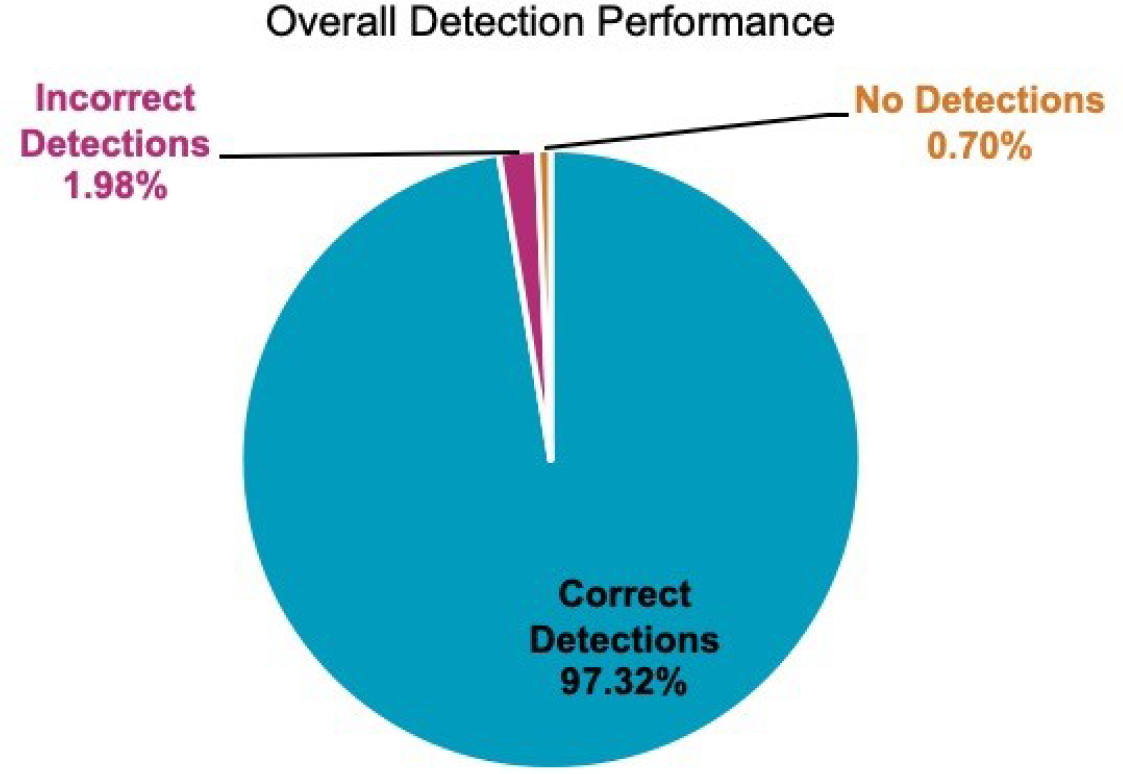
Figure 11 shows the results of the detection performances for a) each of the bounding boxes within the camera detection frame and b) for each of the selected response outcome of detected activities. Figure 11a suggests an average detection accuracy of 92.20% for all activities. The highest detection accuracy (98.88%) was achieved for Detection D, and the lowest was observed for Detection A with an accuracy of 87.29%. To provide a detailed analysis of the detection performance, the detections frames from the live detection were identified as Detection A, B, C and D. The results also indicate the ability to identify specific activities which were performed by each occupant during the detection period. However, detection performance cannot be solely be based on the comparison between the results for Detections A D as not all activities were performed by the detected occupants. Further tests are necessary to fully assess its performance.
Figure 11b presents the detection performance based on the selected activities. Individual detection accuracies for each activity includes walking with 95.83%, standing 87.02%, sitting 97.22% and none (when no occupant is present) achieved an accuracy of 88.13%. This shows the capabilities of the deep learning model to recognise the differences between the corresponding human poses for each specific activity. There is some similarity between the action of standing and walking than there is for sitting. Therefore, this suggests the reason to achieve higher accuracy for sitting as compared to standing and walking.
This section highlights the importance of achieving high accuracy for all activity detections to enable an effective detection approach for building HVAC system controls. Since the following accuracy achieved were only based on small sample size, further model training and testing should be performed to achieve higher detection accuracy for the given occupancy activities to enable further applications of multiple occupancy detection and recognition of a greater number of occupants within different types of office space environments.
Detection performance based on: each of the bounding boxes within the camera detection frame of Detection A, B, C and D (a); each of the selected response outcomes of detected activities; walking, standing, sitting and none (b)
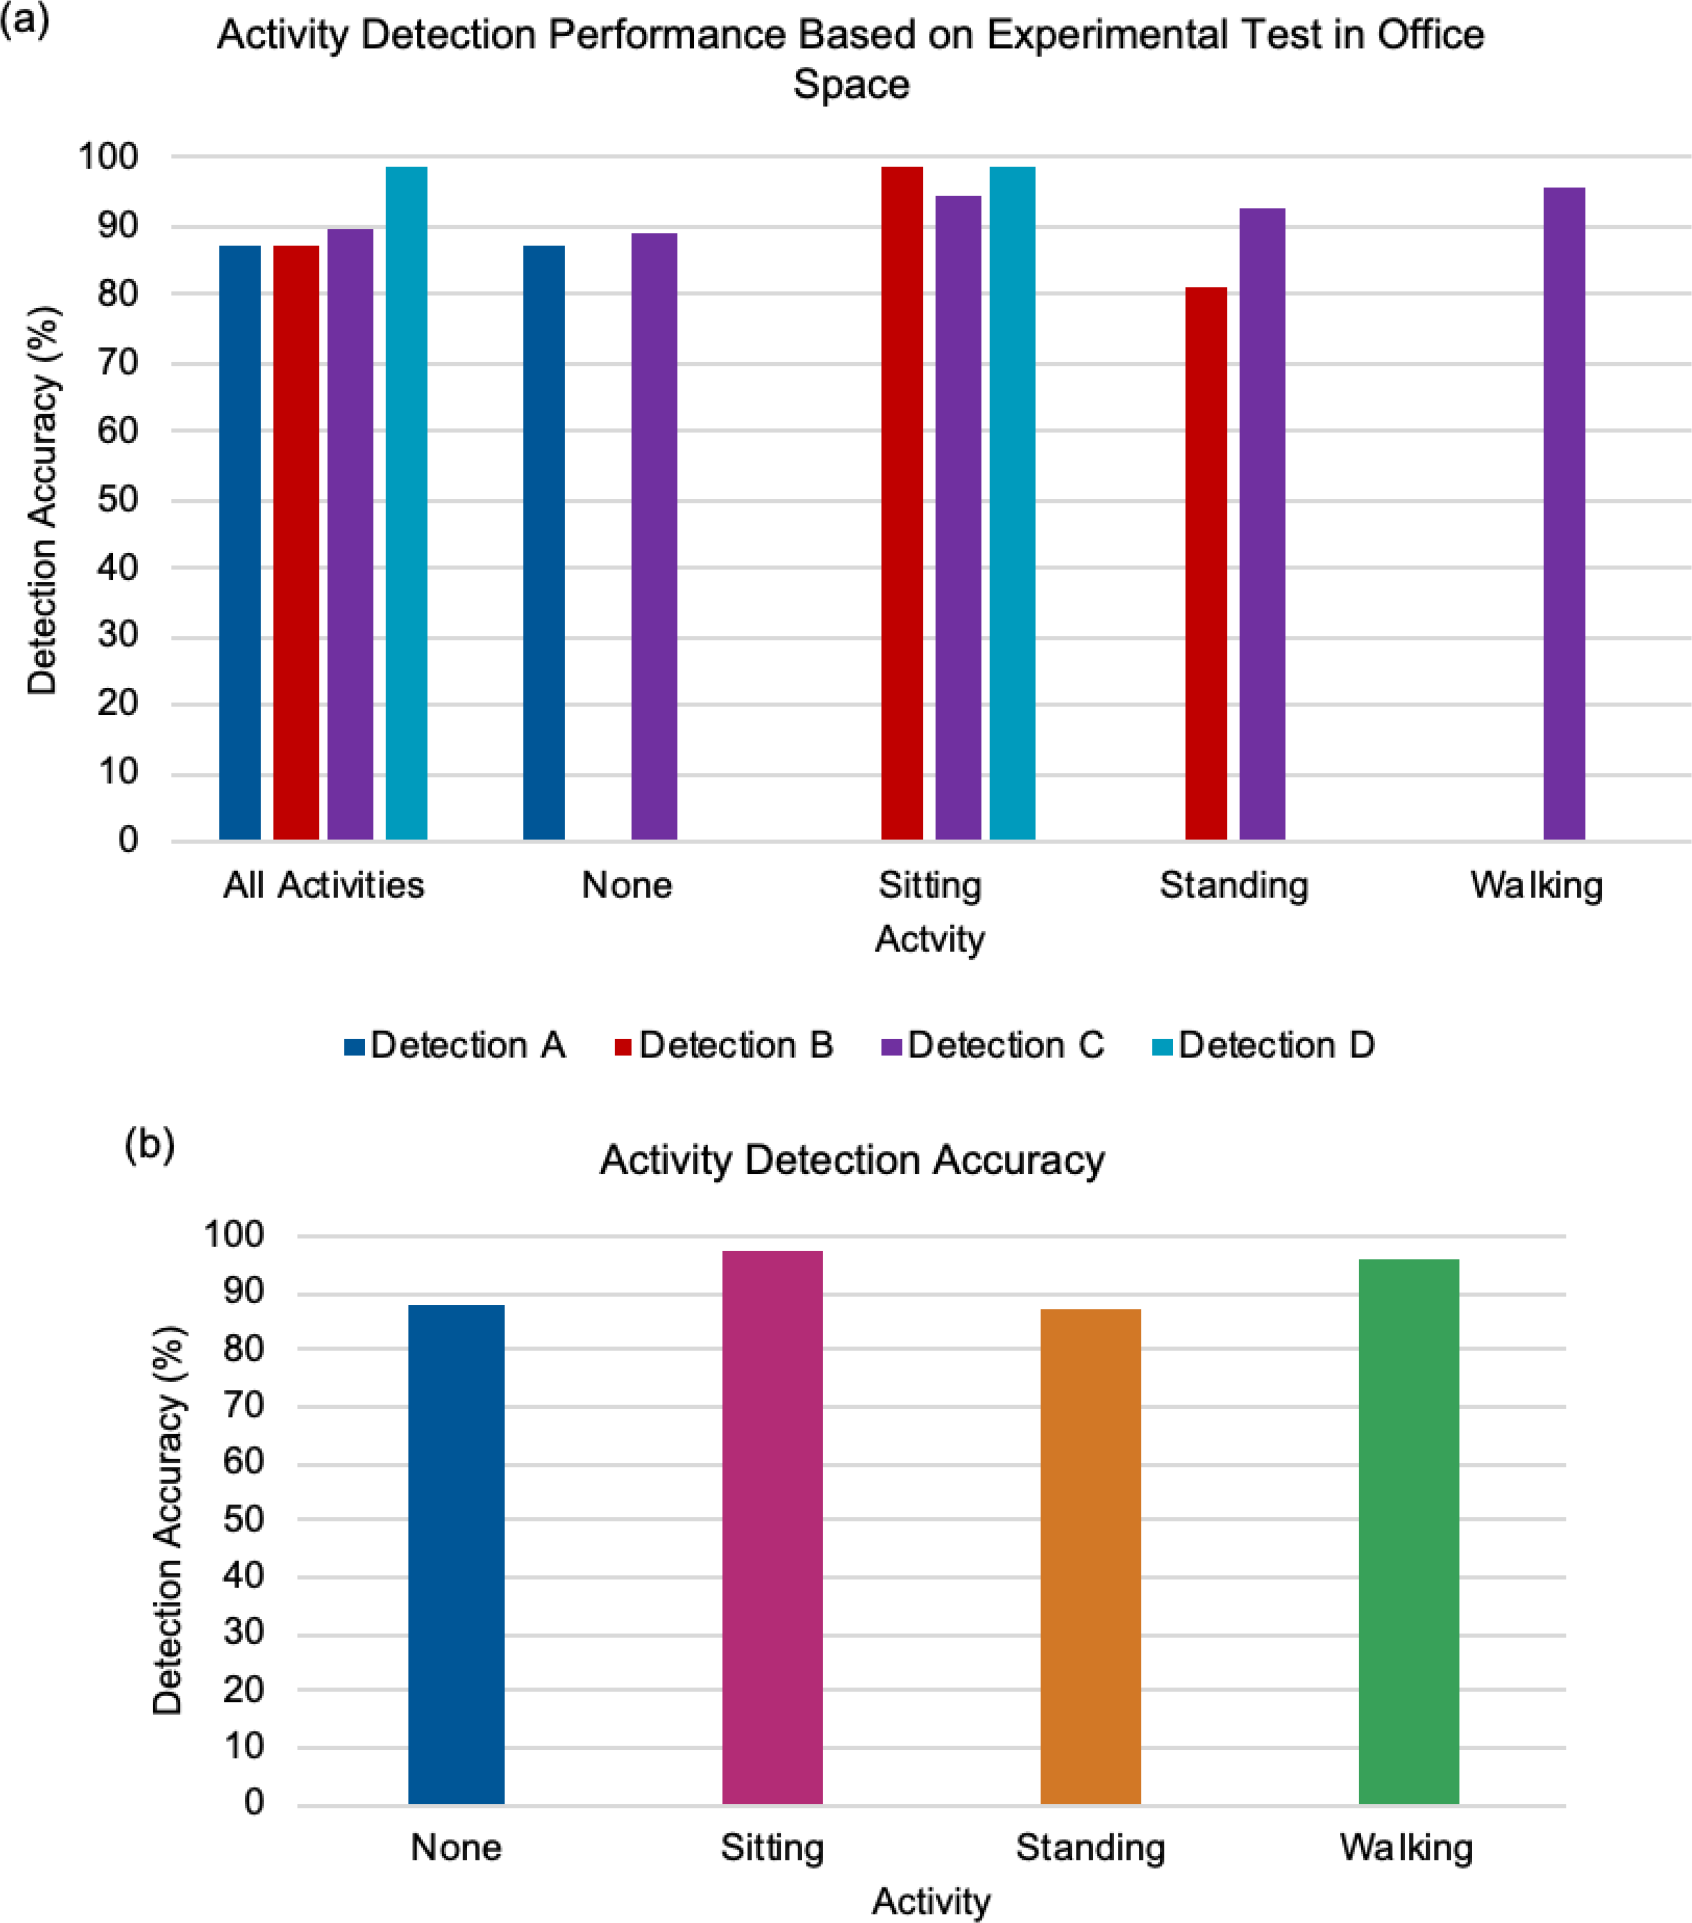
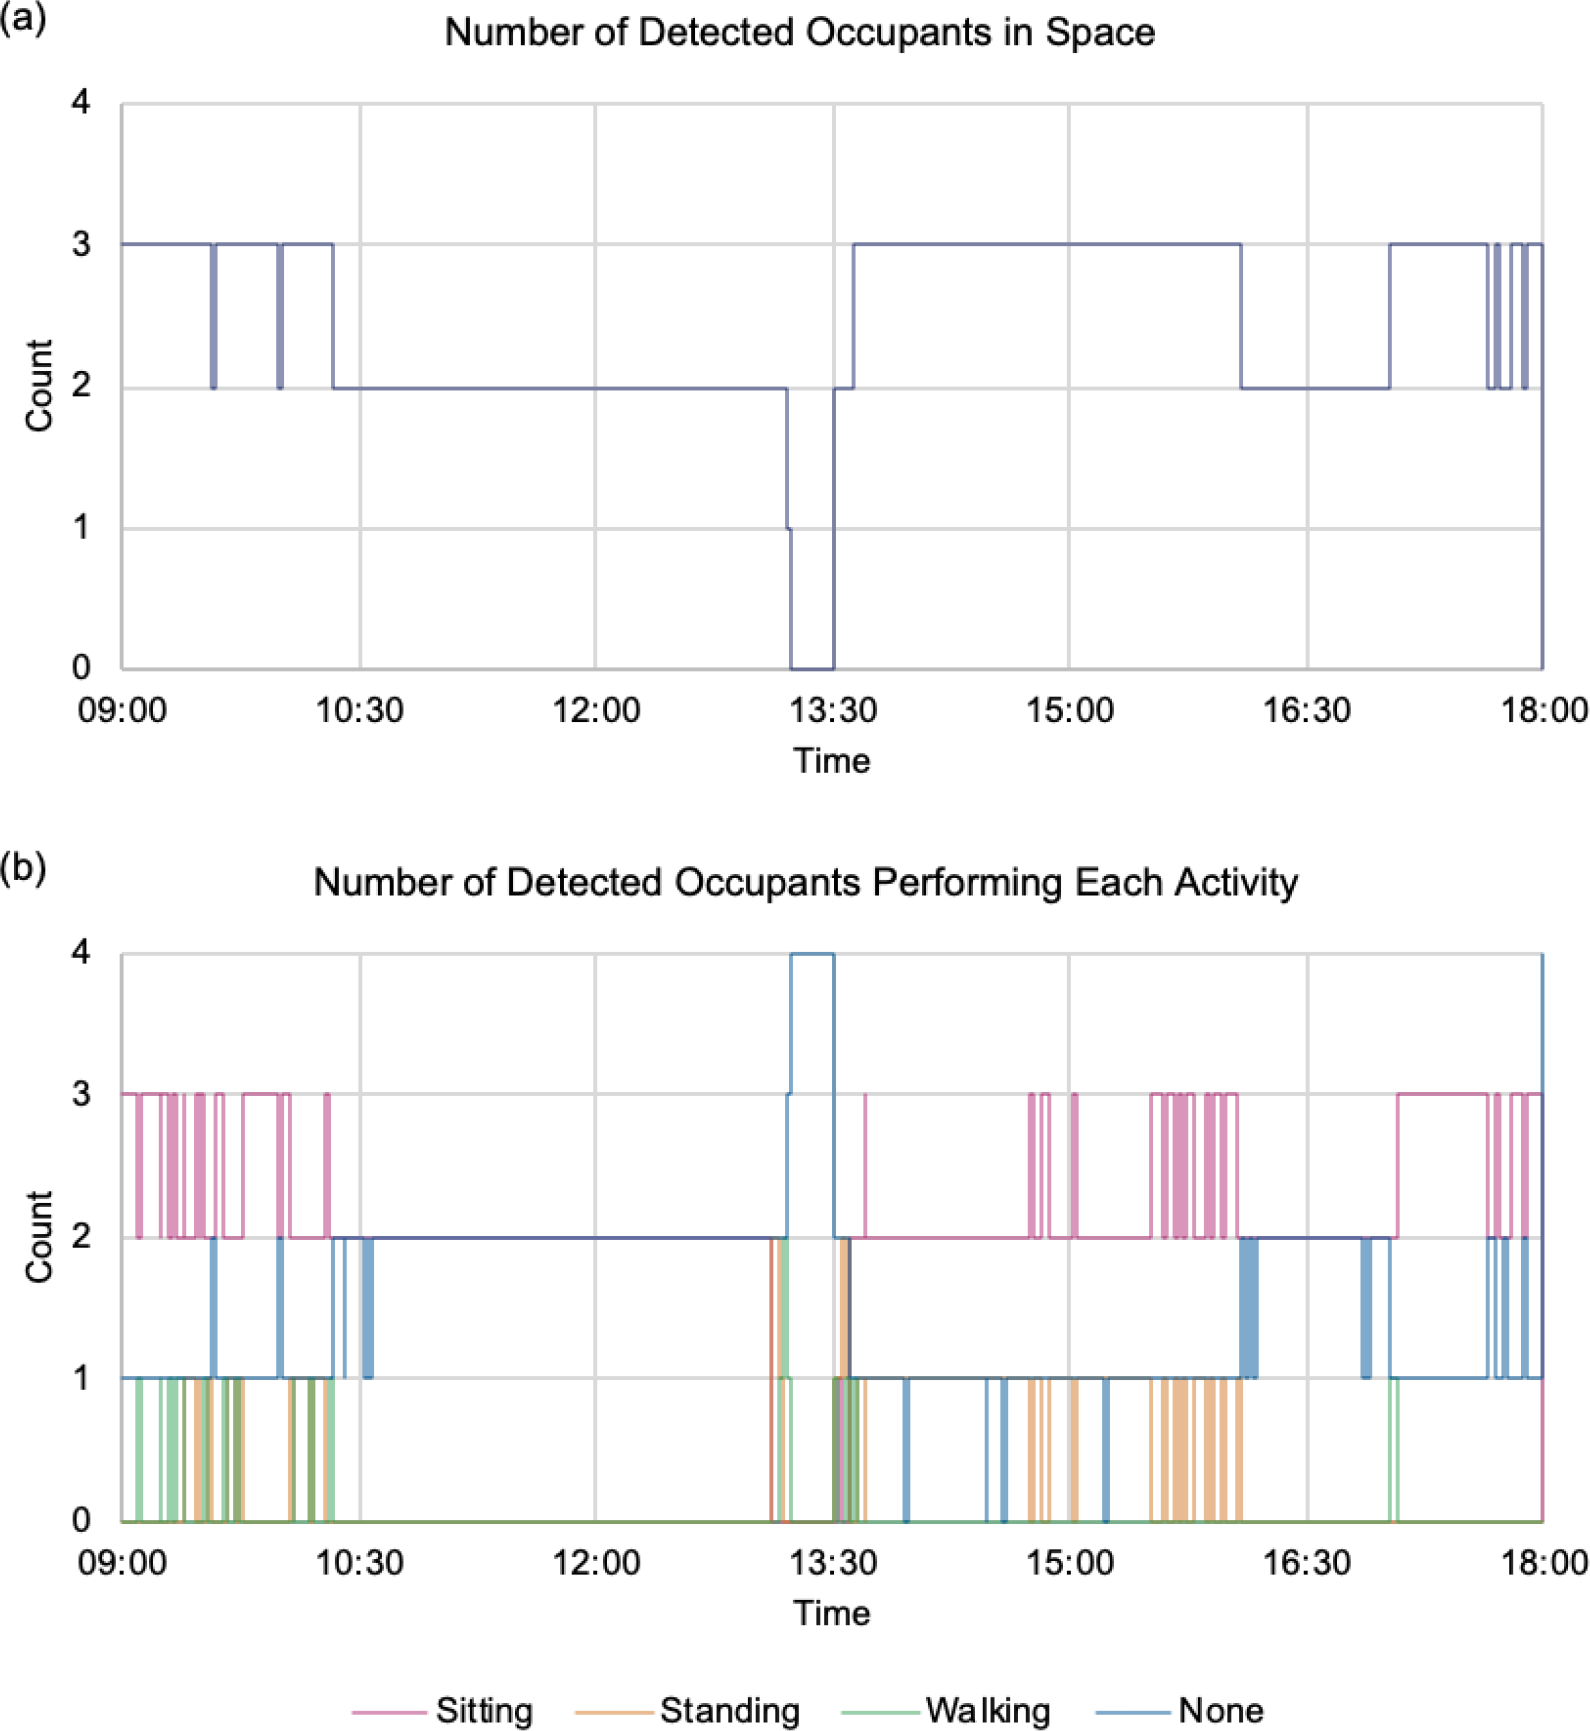
Figure 12a presents the number of detected occupants in the office space within the office space during the test. Figure 12b shows the number of detected and recognised occupants' activities during the test. This provides a better understanding of the occupancy patterns compared to the data shown in Figure 12a, which highlights the potential of the proposed approach.
The number of detected occupants in the select office space (a); the number of detected occupants performing each activity during the one-day detection period using the deep learning occupancy detection model (b)
Following the approach detailed in Figure 1, the data obtained from the live detection and recognition of the occupants were used to generate the DLIP. Figure 13 presents the formed DLIP from the experimental activity detection test results. The formation of the profile corresponds to the process indicated in Figure 6, with the activities of Detections A D. The initial results showed that the DLIP could enable the detection of various activities and provide the identification of times when there are an increase and decrease of activities performed resulting in variation of occupancy heat gains. The DLIP were plotted against the Actual Observation Profile. This defines the actual' occupancy activities performed, which assess the accuracy of the DLIPs. From the comparison of the DLIP and the Actual Observation Profile, an average error of 0.04% was achieved. This indicates the DLIPs would still alternate between the different activities due to the occurrence of prediction error, which suggests the opportunities for further improvements to enhance the accuracy, reliability and stability of the detection model.
Generated Deep Learning Influenced Profile (DLIP) based on the occupancy activity detection results with the corresponding actual observation for the selected one-day detection
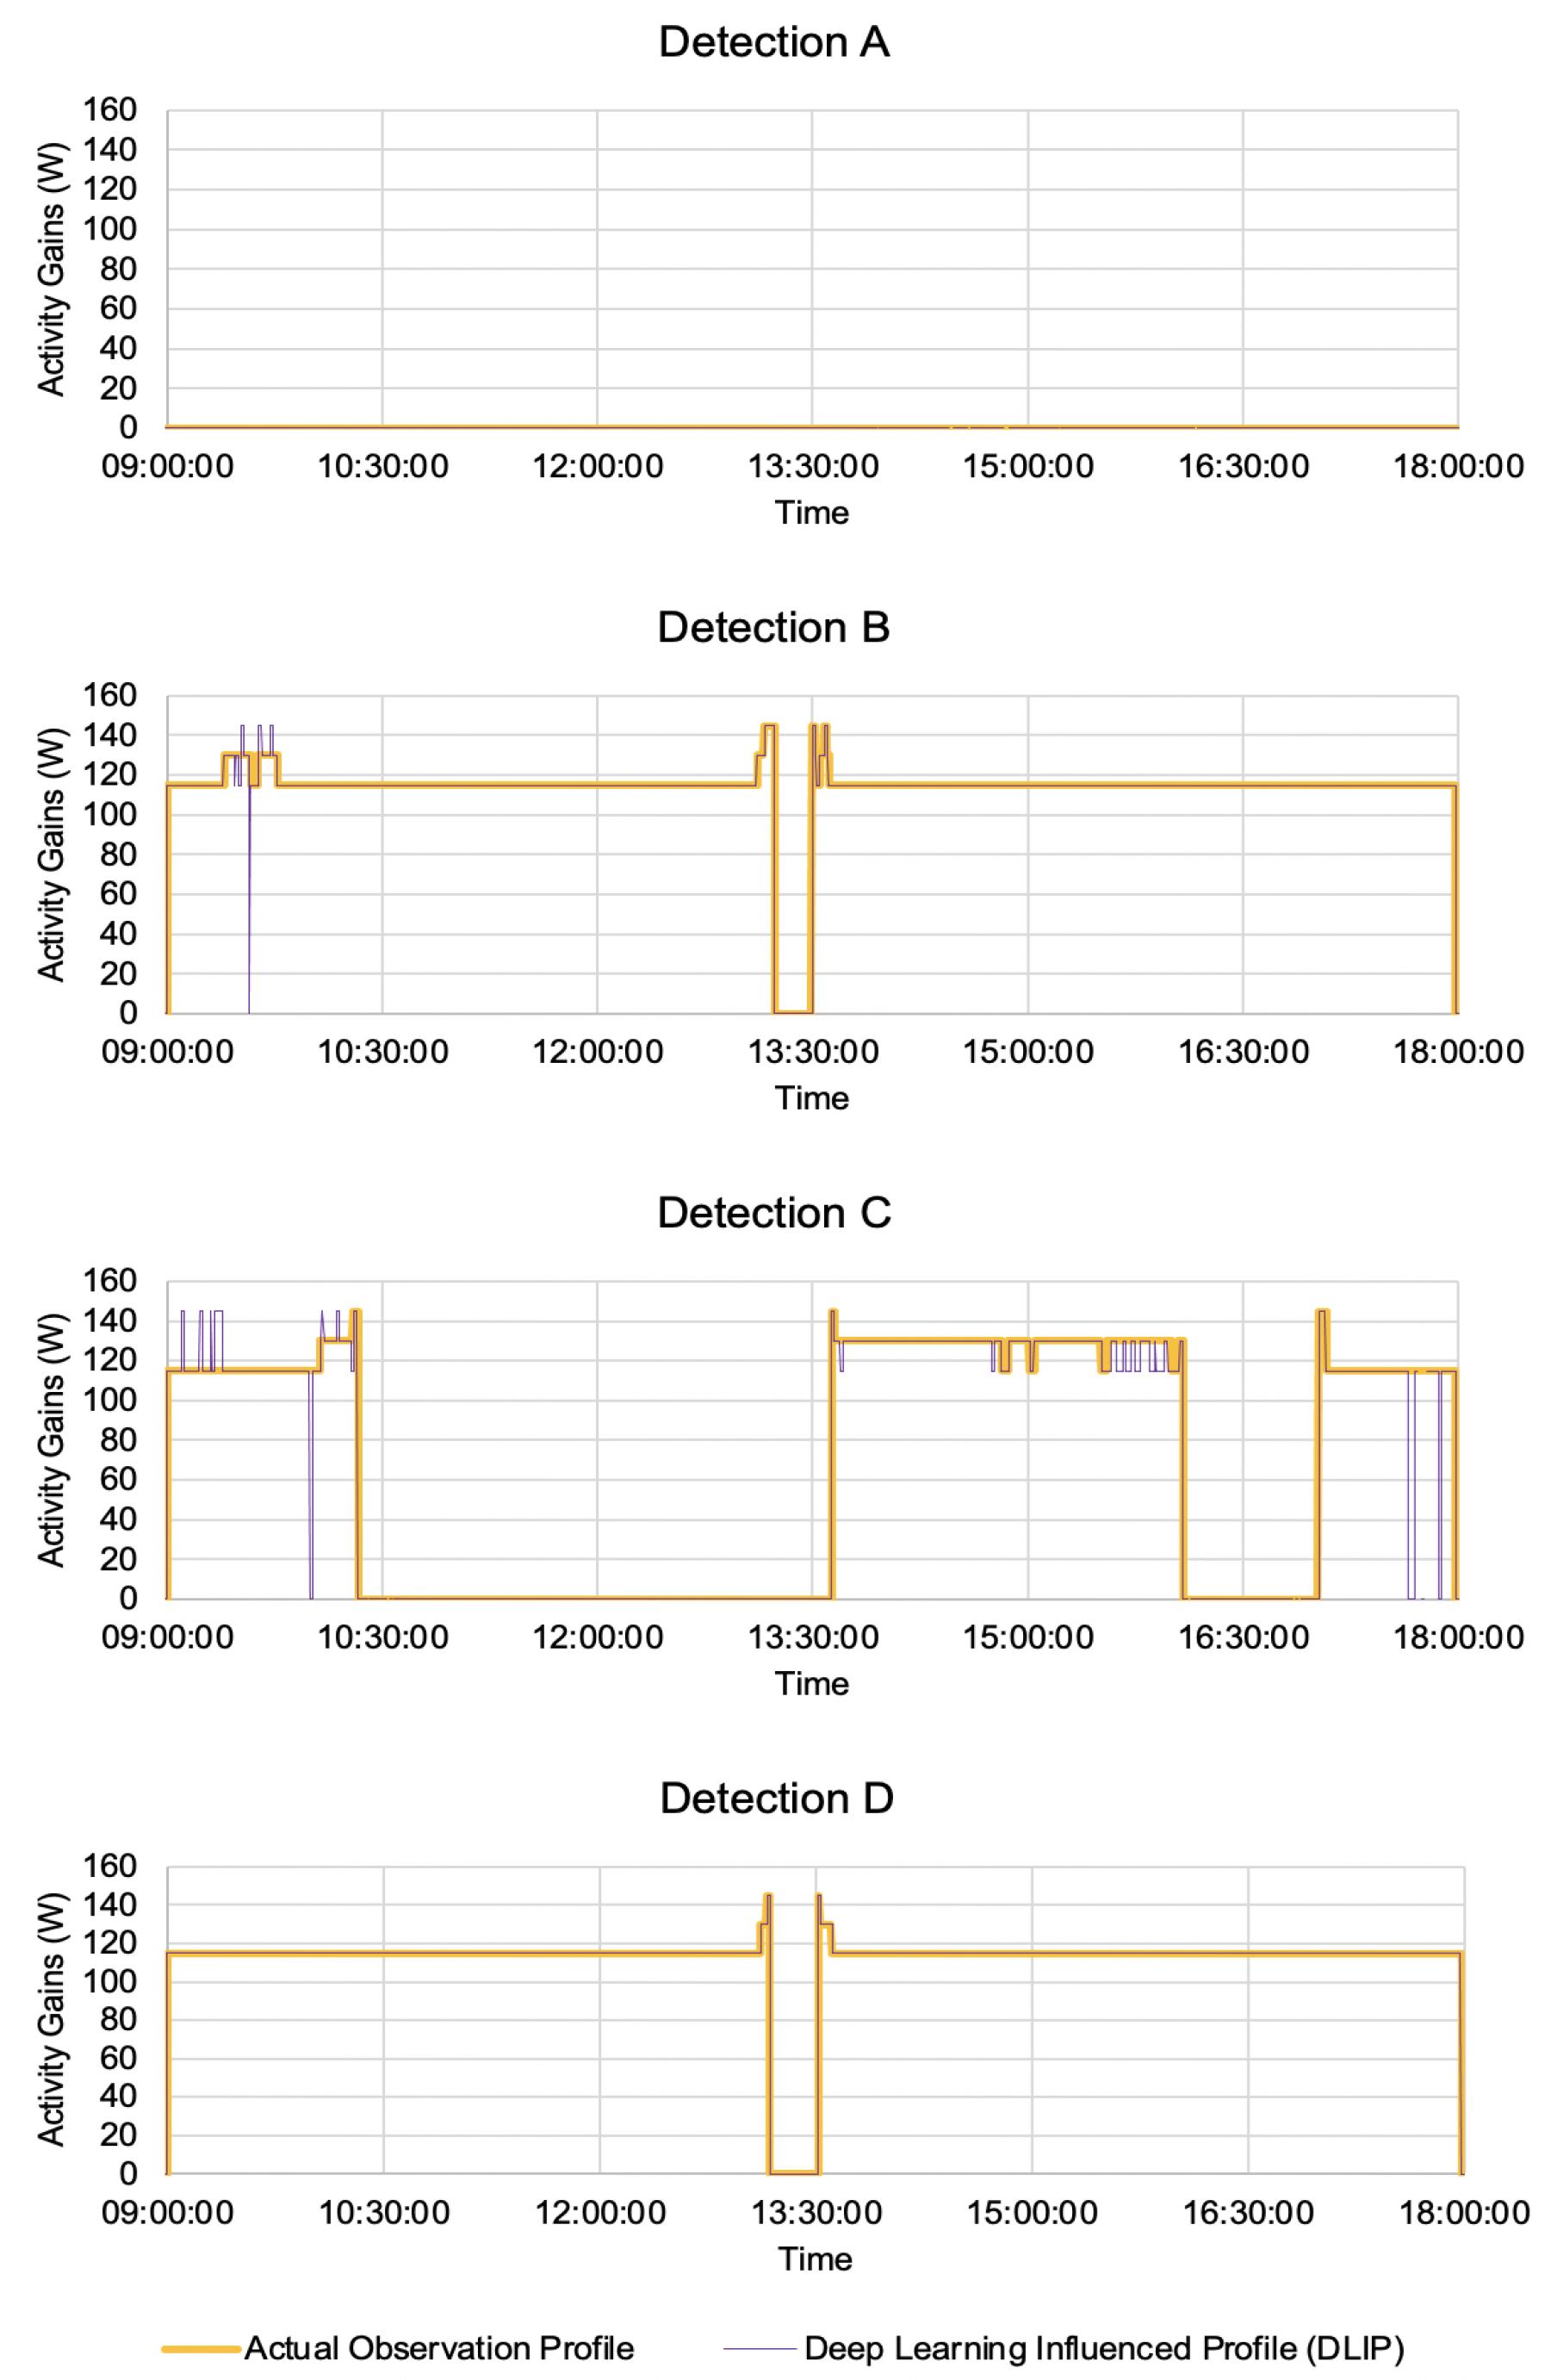
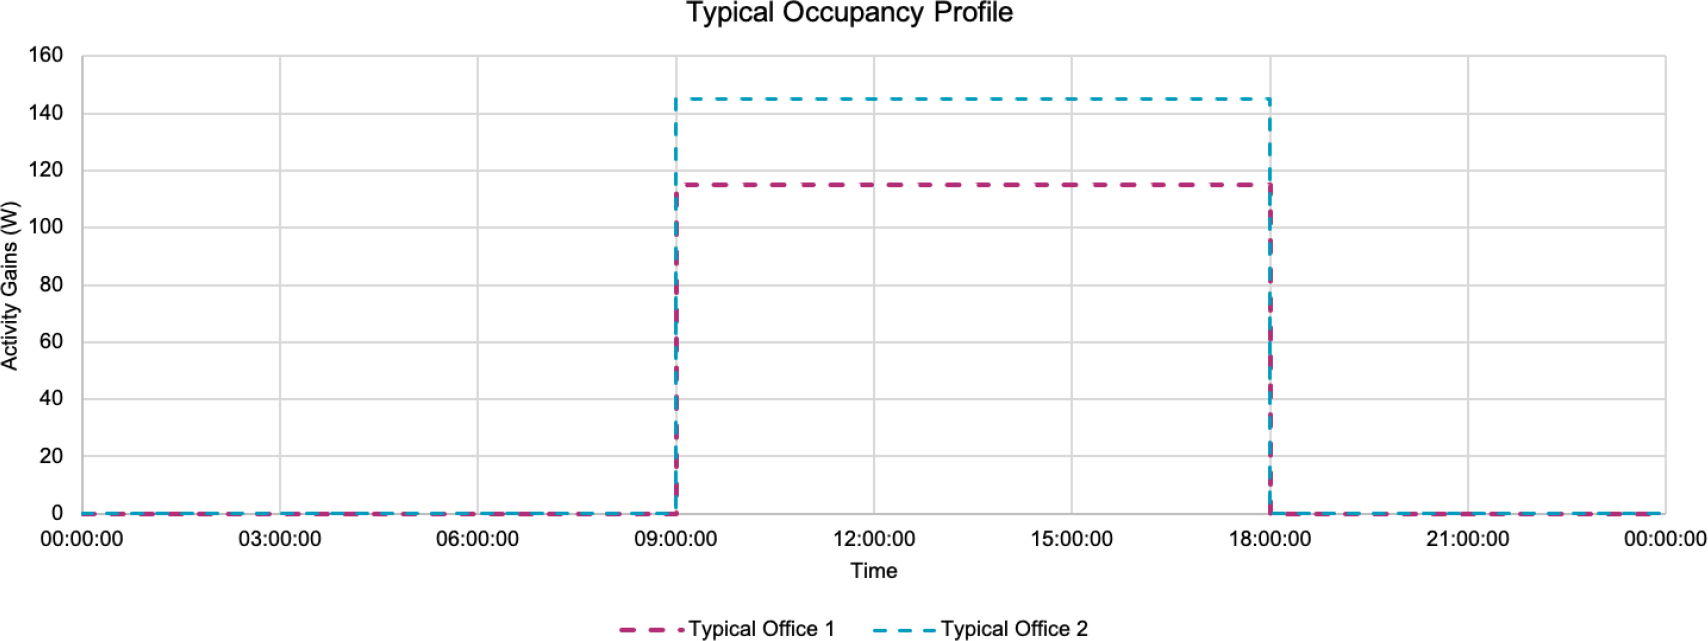
Figure 14 presents two static occupancy profiles typically used in HVAC system operations and in building energy simulations to assume the occupancy patterns in building spaces. Both occupancy profiles were formed assuming that there was constant occupancy in the building spaces and fixed values for occupant internal heat gains. Typical Office 1 represents the average heat gain by a sitting person (115 W). Typical Office Profile 2 represents the average heat gain by a walking person (145 W). During the detection period, there was a 37.38% and 50.25% difference between the Typical Office Profiles 1 and 2 and the Actual Profile. Hence, a large discrepancy between the true occupancy activities performed within the building spaces and the scheduled occupancy profiles can be expected.
Two static occupancy profiles; Typical Office 1 (sitting) and Typical Office 2 (walking)
The following section provides an analysis of the impact of the proposed deep learning activity detection approach on building energy consumption during a typical winter working day. The generated DLIPs are compared with the static scheduled profiles in Figure 14.
Figure 15 presents the building energy simulation (BES) results of the occupancy sensible and latent gains. Typical office 1 and 2 results followed the assigned static scheduled occupancy profiles (Figure 14). Based on the simulated conditions, it can be observed that the typical office profiles over predicted the occupancy heat gains within the room.
The DLIP results provided a better estimation of the occupancy internal heat gains. The occupancy heat gains were high from 09:00 10:00 when there was an increase in activity movement in the space. Lower occupancy heat gains were observed between 13:15 13:30 as most of the occupants had left the office space during this time. This shows the potential of the deep learning method in providing a more accurate estimation of the internal heat gains. Additionally, Figure 15b shows the predicted latent heat gains. The accurate prediction of the latent heat gains is important for the estimation of the required dehumidification load and can further reduce unnecessary energy usage. This is important for buildings located in tropical or humid climates as it can lead to heavy usage of air-conditioning systems. The method should be further evaluated by incorporating it into buildings with different climates.
Occupancy heat gains within the office space during the detection period of 09:00 18:00: sensible heat gains (a); latent heat gains (b)
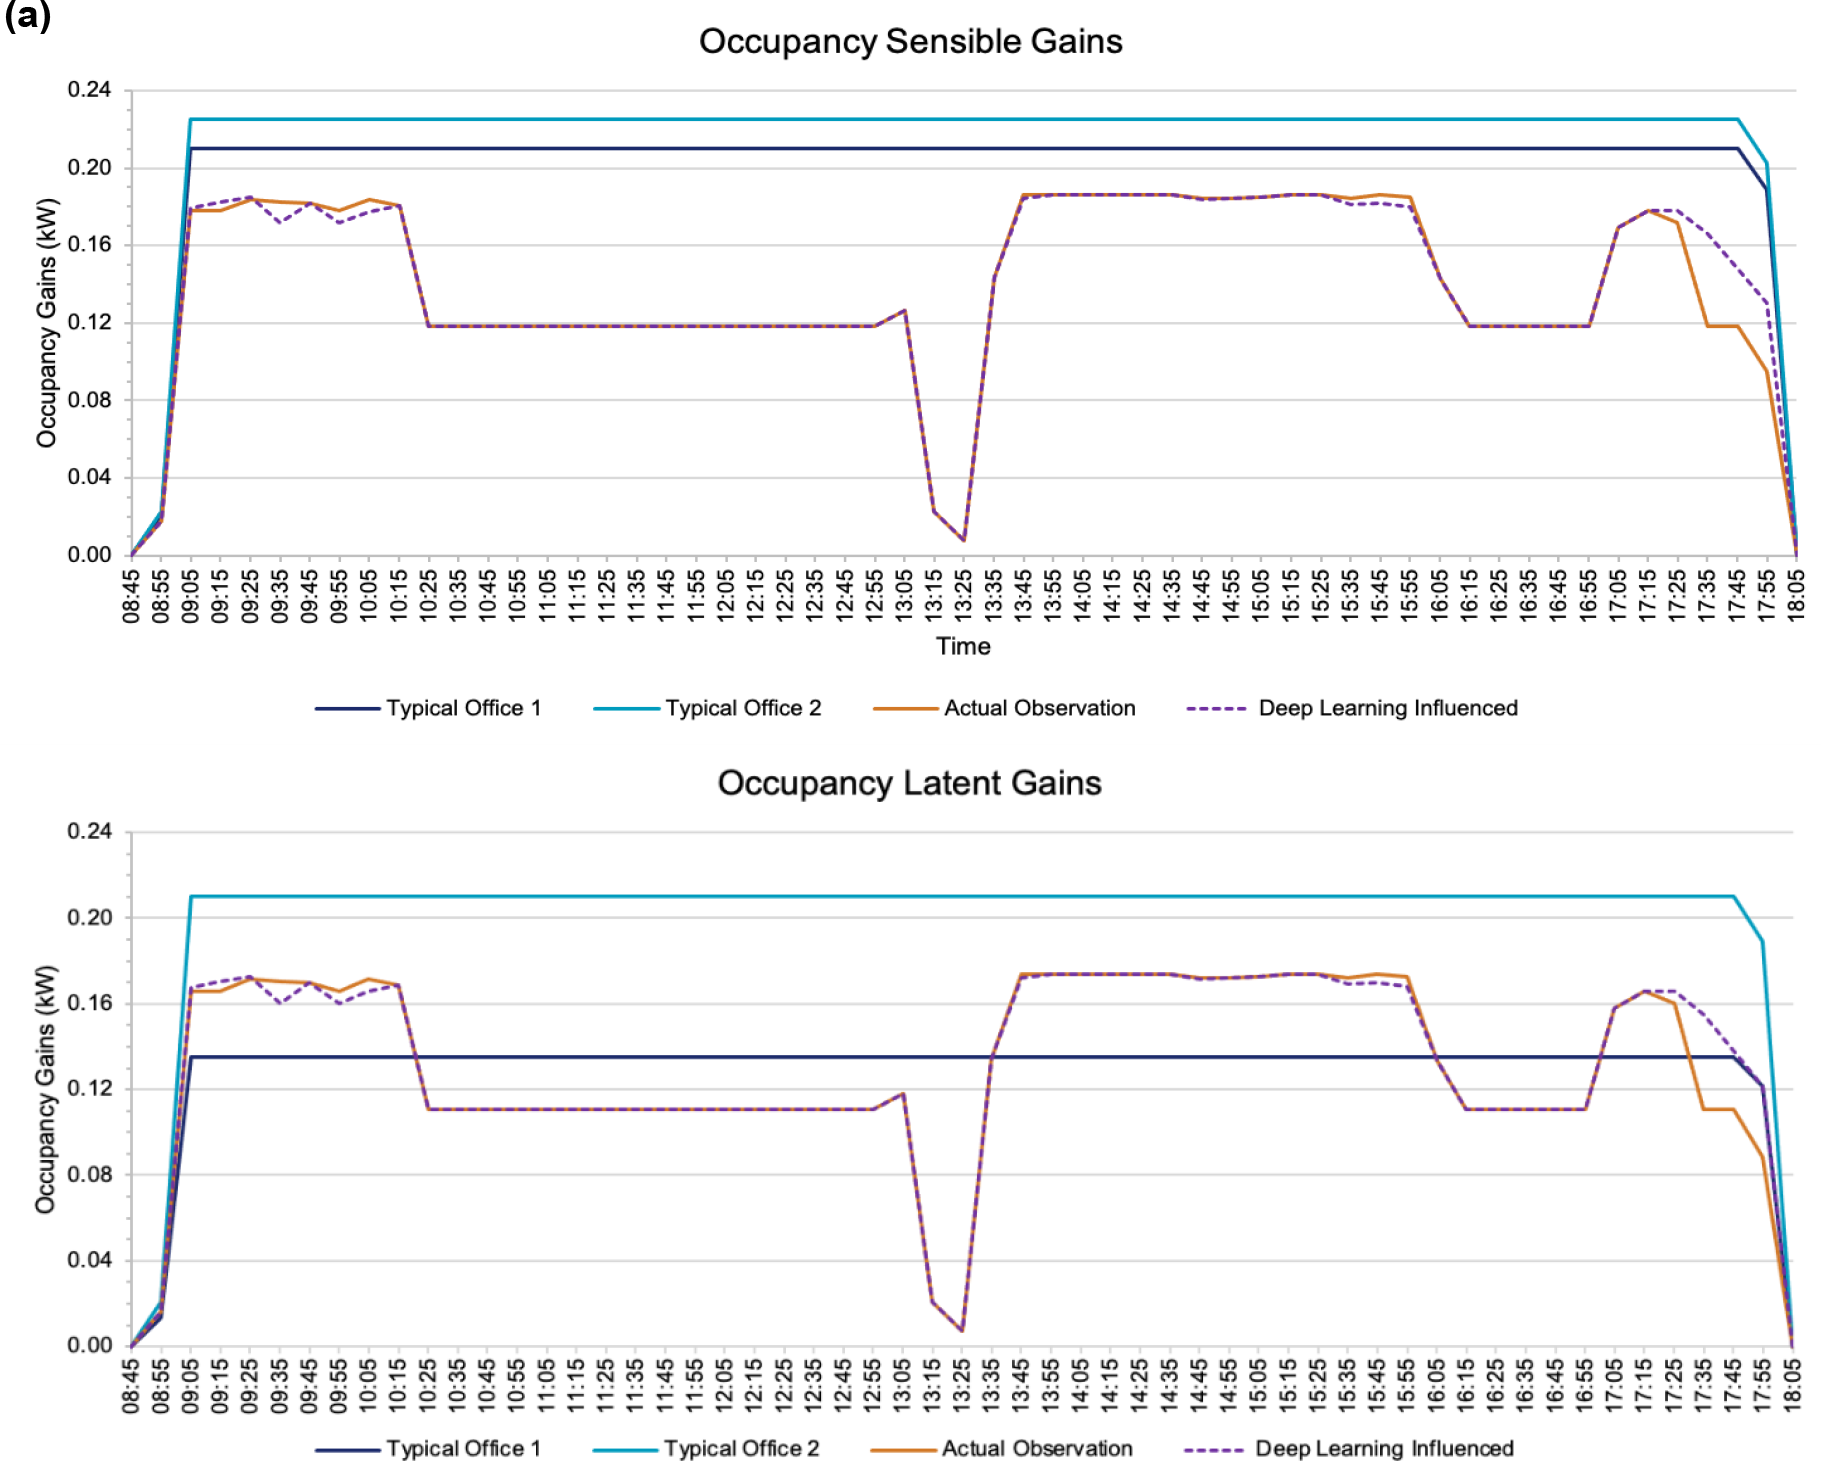
Figure 16 presents a summary of the total sensible and latent occupancy heat gains. Based on the simulated conditions, the occupancy heat gains predicted by using the Typical Office 1 and 2 profiles suggests an overestimation by 22.9% and 54.9% as compared with the Actual Observations. This is equivalent to 83.2 kWh and 199.8 kWh. In comparison, there was a 1.13% (4.1 kWh) difference between the DLIP method and Actual Observations.
Comparison of the total occupancy heat gains achieved using the deep learning approach in comparison with the different typical occupancy schedules
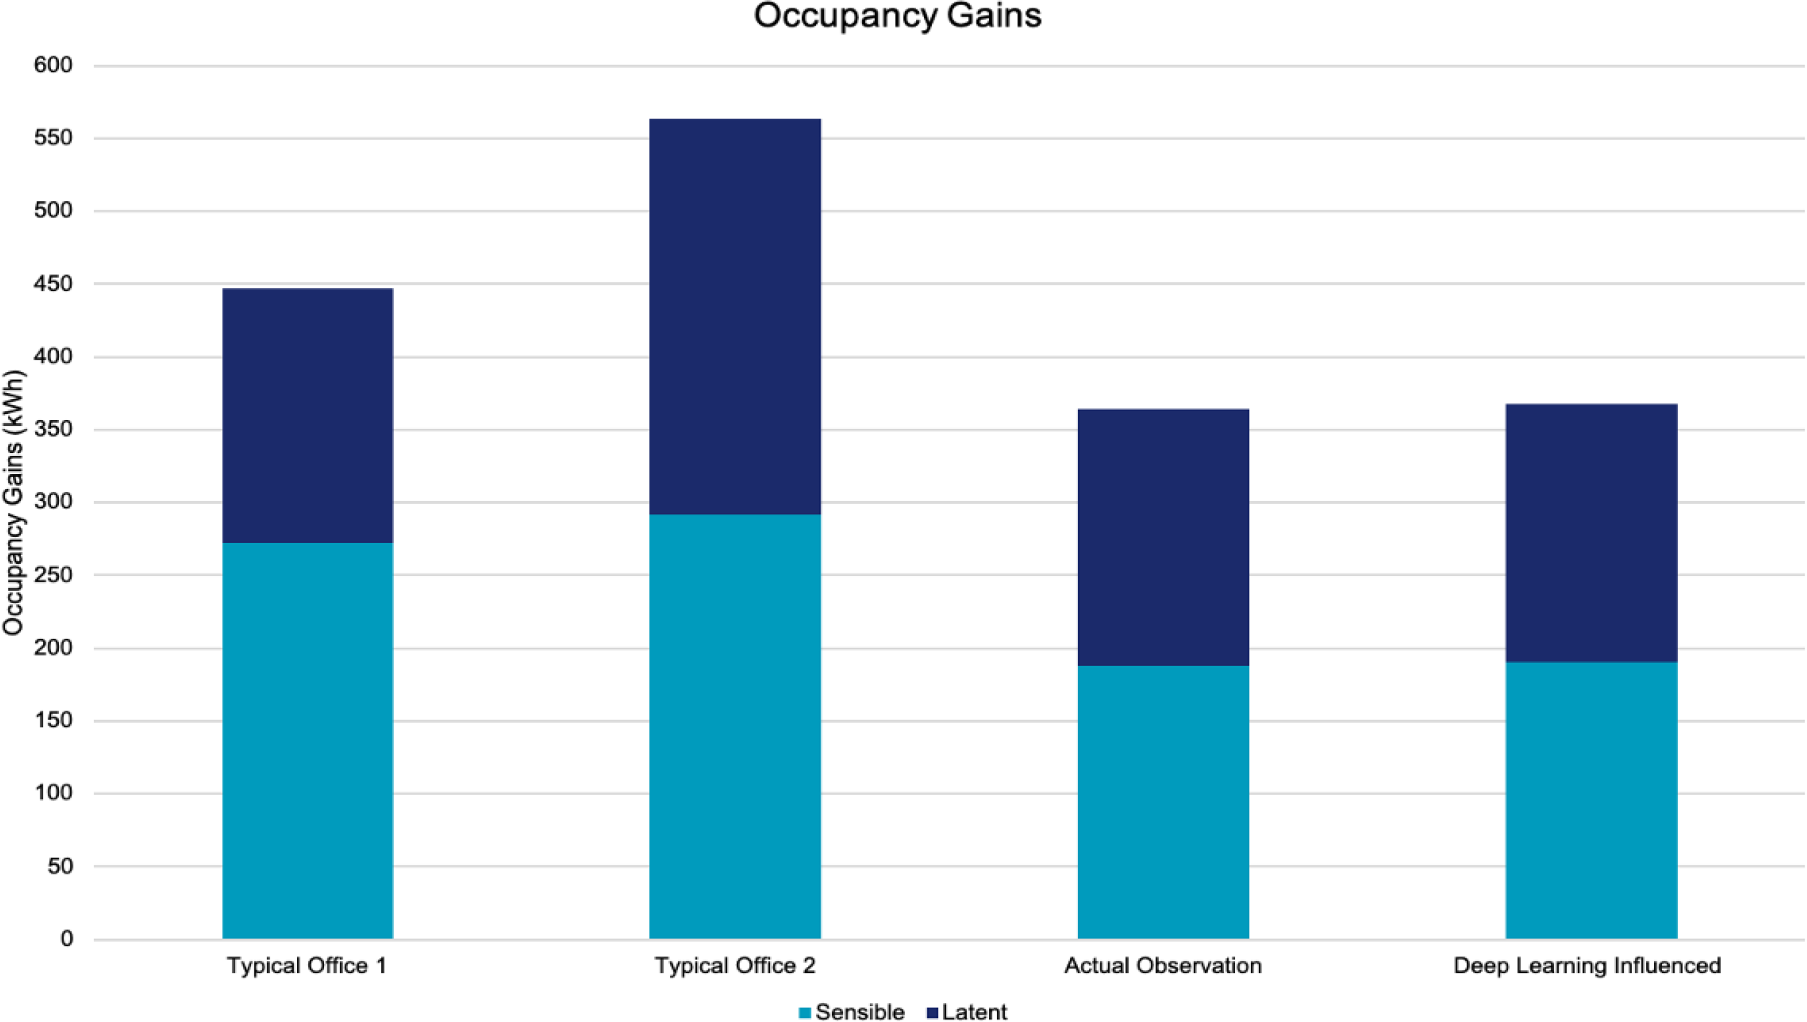
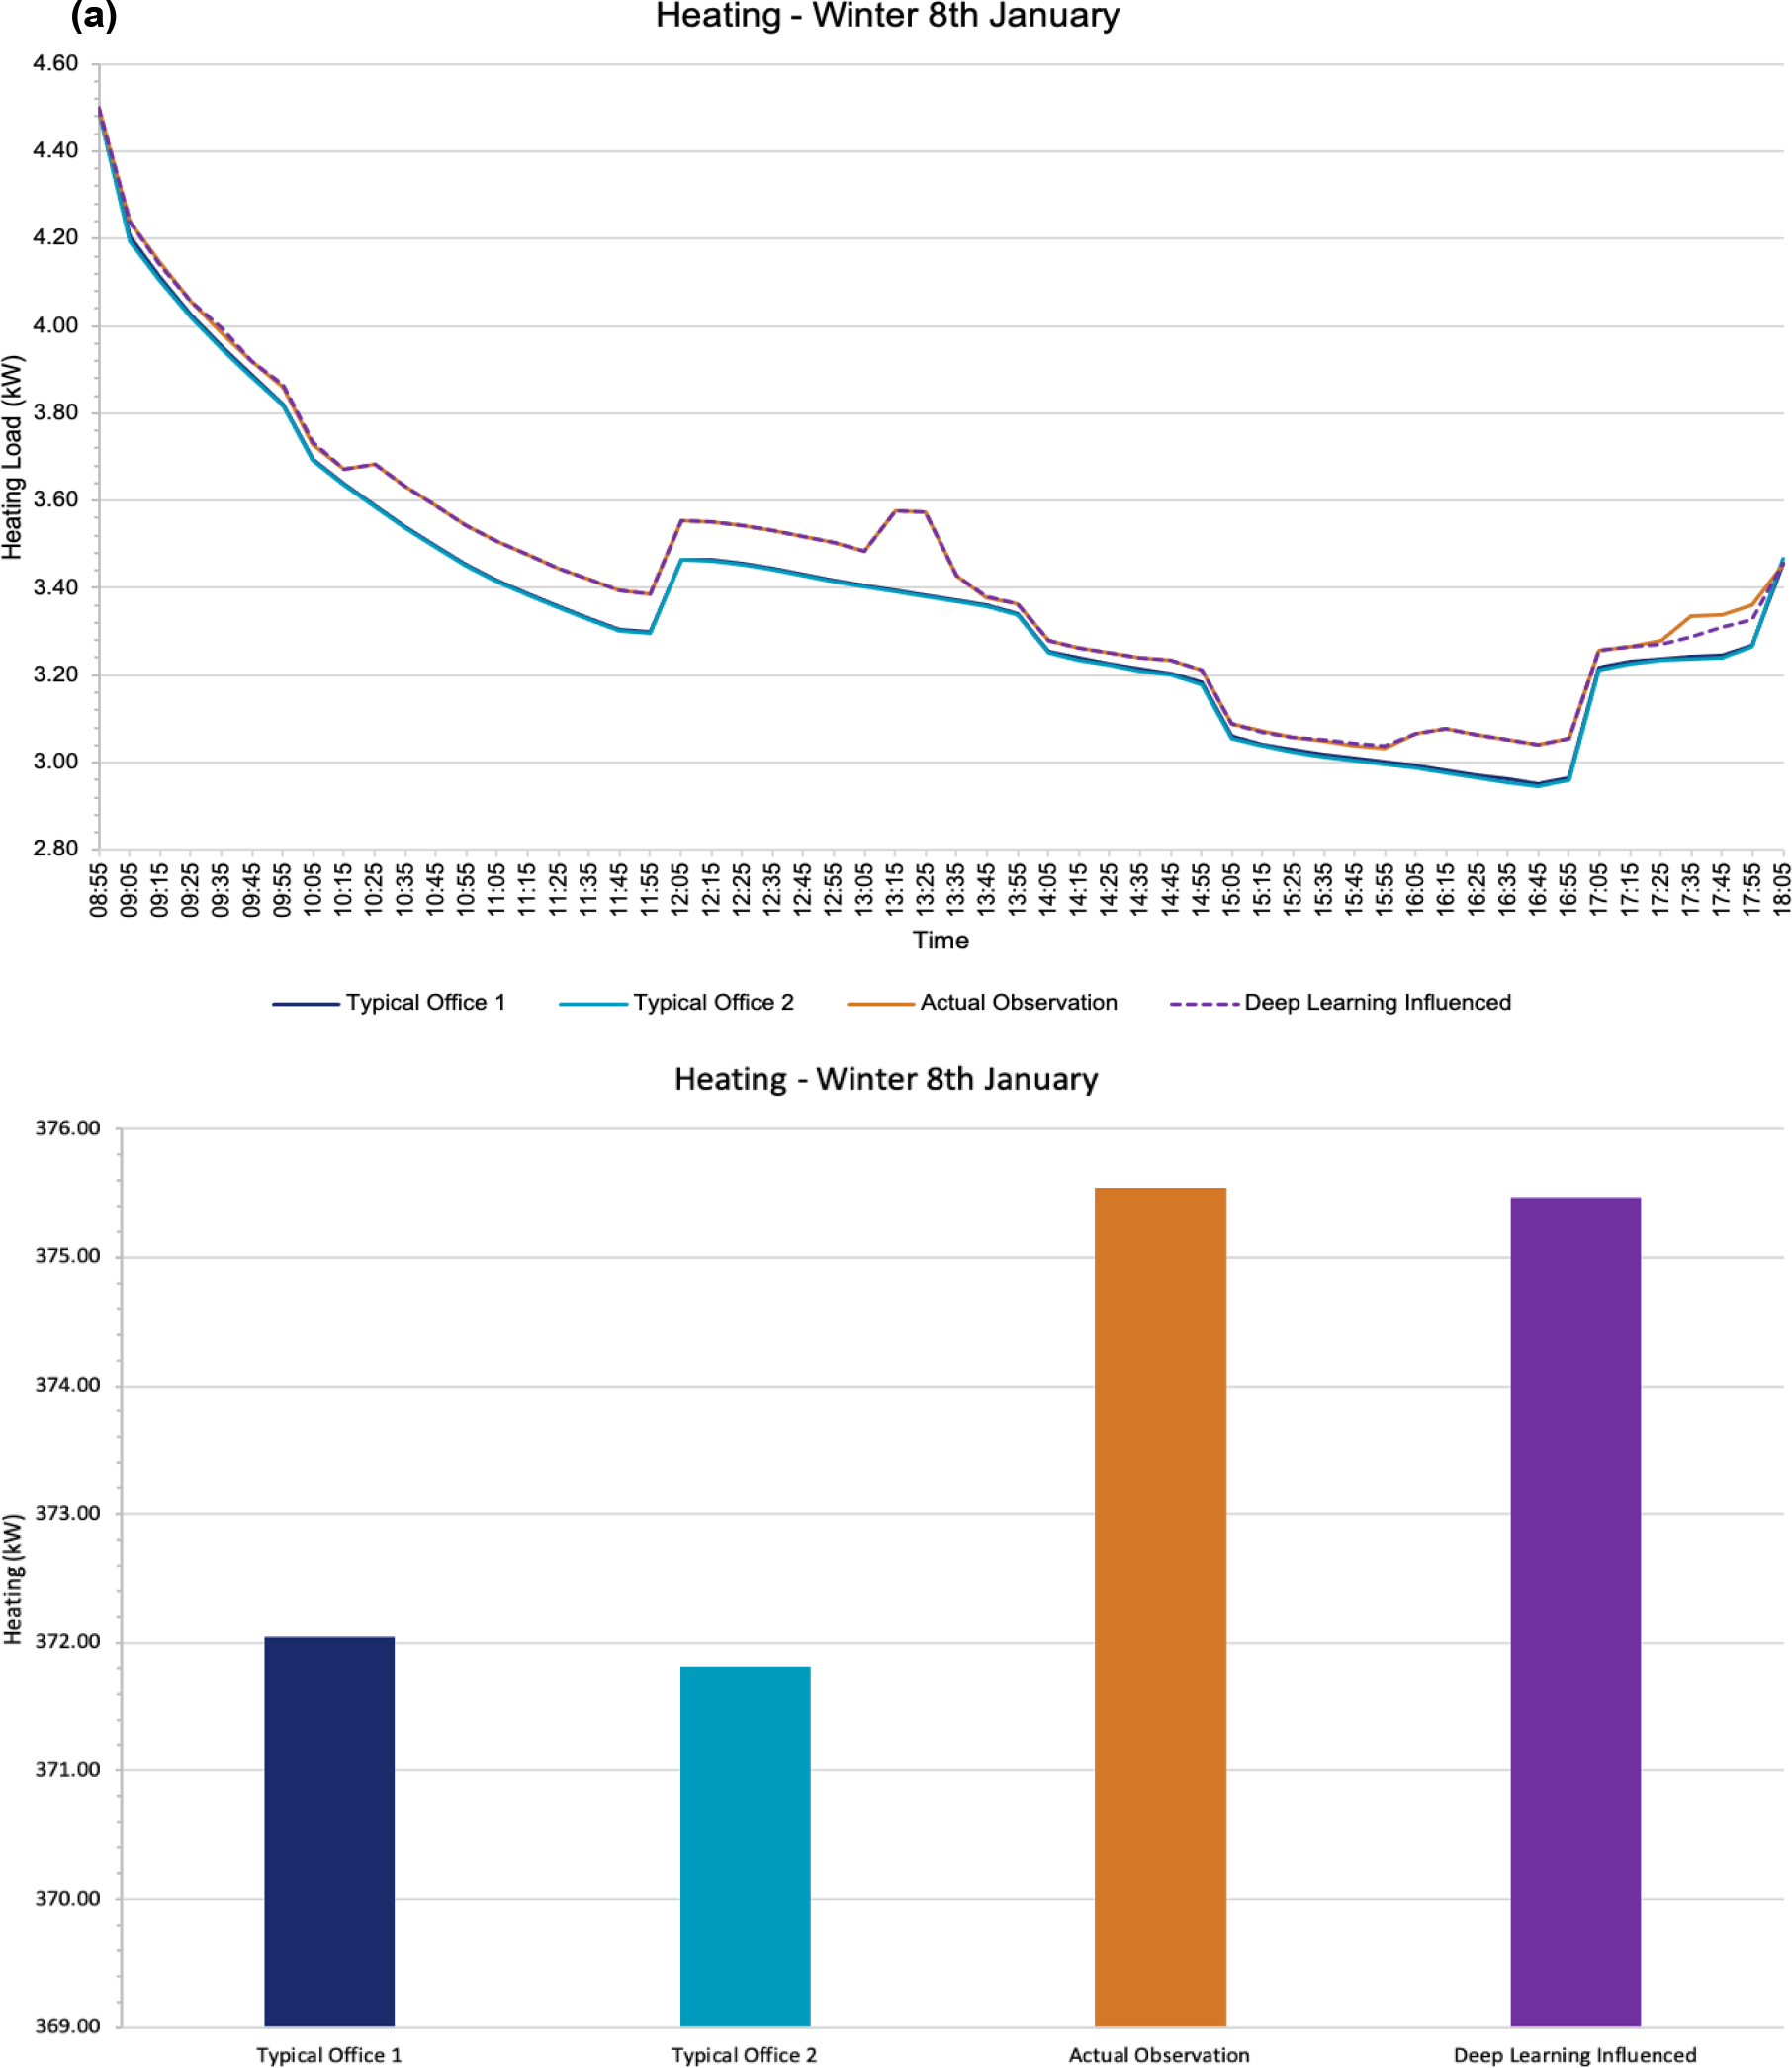
Figure 17 shows the heating demand of the office space during a typical cold period in the UK, comparing the simulation results of the BES model with different occupancy profiles. Figure 17a presents the heating load across time, and Figure 17b compares the total heating loads for the selected day. The predicted heating load for the model with the DLIP profile was 375.5 kW and was very similar as compared to the Actual Observation profile. While the model with Typical Office 1 and 2 profiles had a heating load of 372.0 kW and 371.8 kW. As expected, the DLIP and actual heat gains in the space were lower than static profiles, which assumed constant activities in the space, and hence the heating requirement will be higher in order to provide comfortable indoor conditions.
Heating load across time (a); total heating load for a selected typical cold period based on the assignment of the different forms of occupancy profiles static profiles of Typical Office 1 and 2, true' Actual Observation and the use of the deep learning activity detection approach (b)
The study develops a deep learning vision-based activity detection and recognition approach to enable the generation of real-time data. The data can inform building energy management systems and controls of an HVAC system to make adjustments based on the actual building conditions while minimising unnecessary loads. For the real-time detection and recognition of the common occupancy activities within an office space, a faster region-based convolutional neural network (Faster R-CNN) was developed, trained and deployed towards an AI-powered camera.
For the initial analysis, an experimental test was performed within an office space of a selected case study building. The detection provided correct detections for the majority of the time (97.32%). Average detection accuracy of 92.20% was achieved for all given activities. Higher accuracy was achieved for sitting (97.22%), as compared to standing (87.02%) and walking (95.83%). This is due to the similarity between the action of standing and walking. Hence, it is important to further develop the model and enhance accuracy for all activity detections and enable the provision of an effective occupancy detection approach for demand-driven systems.
The deep learning detection approach provides real-time data which can be used to generate a Deep Learning Influenced Profile (DLIP). As compared with the actual observation of the occupancy activities performed, a difference of 0.0362% was observed between actual and DLIP. Furthermore, results suggest that the use of static or scheduled occupancy profiles currently used in most building HVAC systems operations and in building energy modelling and simulations presents an over or underestimation of the occupancy heat gains. Based on the initial BES results and set conditions, a difference of up to 55% was observed between DLIP and static occupancy heat gain profiles, this is equivalent to 8.33 kW.
Occupancy behaviour and actions are unpredictable, so the results achieved in this present study cannot be entirely used for all buildings and office spaces. Since the detection results were only based on a selected period within a small office space and a limited number of occupants, a series of tests within different types of buildings would be conducted in future studies to verify the feasibility of the approach in a diverse range of indoor environments. Furthermore, factors such as the position of cameras and the room environmental conditions, including obstruction and lighting conditions, would have an effect on the detection accuracy. Hence, the impact of these will be further investigated via the consideration in seeking solutions to improve the model and to adapt with all environmental settings to provide an effective approach used in various building spaces. Moreover, continuous development towards the formation of the most effective occupancy detection method will be conducted. This includes the increase in the number of images located within the model's image datasets, changes towards the model configuration for training purposes and along with tests applied with the performance of various models selected for training. Moreover, other object detection models used for training would be explored and compared with the current model to provide greater insights on selecting and developing a proposed detection method for effective building energy management and optimisation.
This work was supported by the Department of Architecture and Built Environment, University of Nottingham and the PhD studentship from EPSRC,Project Reference: 2100822 (EP/R513283/1).
- , , The Intergovernmental Panel on Climate Change, AR5 Climate Change 2014: Mitigation of Climate, 2014
- , , Transition to Sustainable Buildings: Strategies and Opportunities to 2050, 2013
- ,
Thermal comfort and building energy consumption implications A review ,Applied Energy , Vol. 115 ,pp 164-173 , 2014, https://doi.org/https://doi.org/10.1016/j.apenergy.2013.10.062, 2014/02/15 - ,
Ten questions concerning occupant behavior in buildings: The big picture ,Building and Environment , Vol. 114 ,pp 518-530 , 2017, https://doi.org/https://doi.org/10.1016/j.buildenv.2016.12.006, 2017/03/01/ - , , Standard 55 - Thermal environmental conditions for human occupancy, 2017
- , , ANSI/ASHRAE/IES Standard 90.1-2019 - Energy Standard for Buildings Except Low-Rise Residential Buildings, 2019
- ,
Rethinking HVAC temperature setpoints in commercial buildings: The potential for zero-cost energy savings and comfort improvement in different climates ,Building and Environment , Vol. 155 ,pp 350-359 , 2019, https://doi.org/https://doi.org/10.1016/j.buildenv.2019.03.062, 2019/05/15 - ,
Occupancy-Based HVAC Control with Short-Term Occupancy Prediction Algorithms for Energy-Efficient Buildings ,Energies , Vol. 11 (9),pp 2427 , 2018https://www.mdpi.com/1996-1073/11/9/2427 - ,
A study of the importance of occupancy to building cooling load in prediction by intelligent approach ,Energy Conversion and Management , Vol. 52 (7),pp 2555-2564 , 2011, https://doi.org/https://doi.org/10.1016/j.enconman.2011.02.002, 2011/07/01/ - ,
The impact of occupants behaviours on building energy analysis: A research review ,Renewable and Sustainable Energy Reviews , Vol. 80 ,pp 1061-1071 , 2017, https://doi.org/https://doi.org/10.1016/j.rser.2017.05.264, 2017/12/01/ - ,
Occupancy learning-based demand-driven cooling control for office spaces ,Building and Environment , Vol. 122 ,pp 145-160 , 2017, https://doi.org/https://doi.org/10.1016/j.buildenv.2017.06.010, 2017/09/01 - ,
The dark side of occupants behaviour on building energy use ,Energy and Buildings , Vol. 42 (2),pp 173-177 , 2010, https://doi.org/https://doi.org/10.1016/j.enbuild.2009.08.009, 2010/02/01 - ,
An agent-based stochastic Occupancy Simulator ,Building Simulation , Vol. 11 (1),pp 37-49 , 2018, https://doi.org/https://doi.org/10.1007/s12273-017-0379-7, 2018/02/01 - ,
Building Energy Management: Integrated Control of Active and Passive Heating, Cooling, Lighting, Shading, and Ventilation Systems ,IEEE Transactions on Automation Science and Engineering , Vol. 10 (3),pp 588-602 , 2013, https://doi.org/https://doi.org/10.1109/TASE.2012.2205567 - ,
Energy performance of a ventilation system for an apartment according to the Italian regulation ,International Journal of Energy and Environmental Engineering , Vol. 7 (3),pp 353-359 , 2016, https://doi.org/https://doi.org/10.1007/s40095-014-0159-4, 2016/09/01 - ,
The impact of shading design and control on building cooling and lighting demand ,Solar Energy , Vol. 81 (3),pp 369-382 , 2007, https://doi.org/https://doi.org/10.1016/j.solener.2006.06.015, 2007/03/01 - ,
Importance of occupancy information for building climate control ,Applied Energy , Vol. 101 ,pp 521-532 , 2013, https://doi.org/https://doi.org/10.1016/j.apenergy.2012.06.014, 2013/01/01 - , , Occupancy based demand response HVAC control strategy, presented at the Proceedings of the 2nd ACM Workshop on Embedded Sensing Systems for Energy-Efficiency in Building, 2010
- ,
A robust occupancy detection and tracking algorithm for the automatic monitoring and commissioning of a building ,Energy and Buildings , Vol. 77 ,pp 270-280 , 2014, https://doi.org/https://doi.org/10.1016/j.enbuild.2014.03.069, 2014/07/01 - ,
Development of an occupancy learning algorithm for terminal heating and cooling units ,Building and Environment , Vol. 93 ,pp 71-85 , 2015, https://doi.org/https://doi.org/10.1016/j.buildenv.2015.06.009, 2015/11/01 - ,
Occupancy measurement in commercial office buildings for demand-driven control applicationsA survey and detection system evaluation ,Energy and Buildings , Vol. 93 ,pp 303-314 , 2015, https://doi.org/https://doi.org/10.1016/j.enbuild.2015.02.028, 2015/04/15 - ,
Occupant centered lighting control for comfort and energy efficient building operation ,Energy and Buildings , Vol. 94 ,pp 100-108 , 2015, https://doi.org/https://doi.org/10.1016/j.enbuild.2015.02.053, 2015/05/01 - ,
Estimating the inputs of gas transport processes in buildings ,IEEE Transactions on Control Systems Technology , Vol. 5 (5),pp 480-489 , 1997, https://doi.org/https://doi.org/10.1109/87.623034 - ,
Towards a sensor for detecting human presence and characterizing activity ,Energy and Buildings , Vol. 43 (2),pp 305-314 , 2011, https://doi.org/https://doi.org/10.1016/j.enbuild.2010.09.014, 2011/02/01 - ,
Towards occupant activity driven smart buildings via WiFi-enabled IoT devices and deep learning ,Energy and Buildings , Vol. 177 ,pp 12-22 , 2018, https://doi.org/https://doi.org/10.1016/j.enbuild.2018.08.010, 2018/10/15 - ,
A vision-based deep learning approach for the detection and prediction of occupancy heat emissions for demand-driven control solutions ,Energy and Buildings , Vol. 226 ,pp 110386 , 2020, https://doi.org/https://doi.org/10.1016/j.enbuild.2020.110386, 2020/11/01 - ,
Vision-based detection and prediction of equipment heat gains in commercial office buildings using a deep learning method ,Applied Energy , Vol. 277 ,pp 115506 , 2020, https://doi.org/https://doi.org/10.1016/j.apenergy.2020.115506, 2020/11/01 - ,
Finding and tracking people from the bottom up, in 2003 IEEE Computer Society Conference on Computer Vision and Pattern Recognition, 2003 ,Proceedings , Vol. 2 ,pp II-II , 2003, https://doi.org/https://doi.org/10.1109/CVPR.2003.1211504, 18-20 June 2003 - ,
Occupancy detection in the office by analyzing surveillance videos and its application to building energy conservation ,Energy and Buildings , Vol. 152 ,pp 385-398 , 2017, https://doi.org/https://doi.org/10.1016/j.enbuild.2017.07.064, 2017/10/01 - ,
Real-time occupancy prediction in a large exhibition hall using deep learning approach ,Energy and Buildings , Vol. 199 ,pp 216-222 , 2019, https://doi.org/https://doi.org/10.1016/j.enbuild.2019.06.043, 2019/09/15 - ,
Convolutional neural networks: an overview and application in radiology ,Insights into Imaging , Vol. 9 (4),pp 611-629 , 2018, https://doi.org/https://doi.org/10.1007/s13244-018-0639-9, 2018/08/01 - ,
A survey of the recent architectures of deep convolutional neural networks ,Artificial Intelligence Review , Vol. 53 (8),pp 5455-5516 , 2020, https://doi.org/https://doi.org/10.1007/s10462-020-09825-6, 2020/12/01 - ,
Deep Convolutional Neural Networks for Image Classification: A Comprehensive Review ,Neural Computation , Vol. 29 (9),pp 2352-2449 , 2017, https://doi.org/https://doi.org/10.1162/neco_a_00990 - ,
Faster R-CNN: Towards Real-Time Object Detection with Region Proposal Networks ,IEEE Transactions on Pattern Analysis and Machine Intelligence , Vol. 39 (6),pp 1137-1149 , 2017, https://doi.org/https://doi.org/10.1109/TPAMI.2016.2577031 - ,
Face image manipulation detection based on a convolutional neural network ,Expert Systems with Applications , Vol. 129 ,pp 156-168 , 2019, https://doi.org/https://doi.org/10.1016/j.eswa.2019.04.005, 2019/09/01 - , , Convolutional neural networks in APL, presented at the Proceedings of the 6th ACM SIGPLAN International Workshop on Libraries, Languages and Compilers for Array Programming, 2019
- , , Computer Vision for Assistive Healthcare, 2018
- , , Handbook of Medical Image Computing and Computer Assisted Intervention, 2020
- ,
Deep learning ,Nature , Vol. 521 (7553),pp 436-444 , 2015, https://doi.org/https://doi.org/10.1038/nature14539, 2015/05/01 - ,
Empirical evaluation of rectified activations in convolutional network ,arXiv ,pp 1505.00853v2 , 2015 - ,
Spatial Correlation and Value Prediction in Convolutional Neural Networks ,IEEE Computer Architecture Letters , Vol. 18 (1),pp 10-13 , 2019, https://doi.org/https://doi.org/10.1109/LCA.2018.2890236 - , Flexible, High Performance Convolutional Neural Networks for Image Classification, presented at the Proceedings of the Twenty-Second International Joint Conference on Artificial Intelligence, IJCAI-2011, 2011
- ,
Deep Learning Applications with Practical Measured Results in Electronics Industries ,Electronics , Vol. 9 (3),pp 501 , 2020https://www.mdpi.com/2079-9292/9/3/501 - , https://www.mathworks.com/content/dam/mathworks/tag-team/Objects/d/80879v00_Deep_Learning_ebook.pdf
- , https://www.coursera.org/lecture/machine-learning/model-selection-and-train-validation-test-sets-QGKbr
- , https://github.com/tzutalin/labelImg
- , , Comparison between search terms: pytorch, tensorflow and keras between February 2015 - 2020
- , , Performance comparison of deep learning frameworks in image classification problems using convolutional and recurrent networks, presented at the 2017 IEEE Colombian Conference on Communications and Computing (COLCOM), 2017
- , https://www.tensorflow.org/
- ,
Window opening model using deep learning methods ,Building and Environment , Vol. 145 ,pp 319-329 , 2018, https://doi.org/https://doi.org/10.1016/j.buildenv.2018.09.024, 2018/11/01 - ,
Fusing TensorFlow with building energy simulation for intelligent energy management in smart cities ,Sustainable Cities and Society , Vol. 45 ,pp 243-257 , 2019, https://doi.org/https://doi.org/10.1016/j.scs.2018.11.021, 2019/02/01 - ,
Intelligent smart home energy efficiency model using artificial TensorFlow engine ,Human-centric Computing and Information Sciences , Vol. 8 (1),pp 9 , 2018, https://doi.org/https://doi.org/10.1186/s13673-018-0132-y, 2018/04/26 - ,
, Speed/accuracy trade-offs for modern convolutional object detectors , 2016 - ,
Object Detection Using Convolutional Neural Networks ,TENCON 2018 - 2018 IEEE Region 10 Conference ,pp 2023-2027 , 2018, https://doi.org/https://doi.org/10.1109/TENCON.2018.8650517, 28-31 Oct. 2018 - ,
Objects Talk - Object Detection and Pattern Tracking Using TensorFlow ,2018 Second International Conference on Inventive Communication and Computational Technologies (ICICCT) ,pp 1216-1219 , 2018, https://doi.org/https://doi.org/10.1109/ICICCT.2018.8473331, 20-21 April 2018 - ,
Deep convolutional neural networks with ensemble learning and transfer learning for capacity estimation of lithium-ion batteries ,Applied Energy , Vol. 260 ,pp 114296 , 2020, https://doi.org/https://doi.org/10.1016/j.apenergy.2019.114296, 2020/02/15 - , https://github.com/tensorflow/models/blob/master/research/object_detection/g3doc/tf1_detection_zoo.md
- ,
A light and faster regional convolutional neural network for object detection in optical remote sensing images ,ISPRS Journal of Photogrammetry and Remote Sensing , Vol. 141 ,pp 208-218 , 2018, https://doi.org/https://doi.org/10.1016/j.isprsjprs.2018.05.005, 2018/07/01 - ,
An automatic traffic density estimation using Single Shot Detection (SSD) and MobileNet-SSD ,Physics and Chemistry of the Earth, Parts A/B/C , Vol. 110 ,pp 176-184 , 2019, https://doi.org/https://doi.org/10.1016/j.pce.2018.12.001, 2019/04/01 - ,
YOLO based Human Action Recognition and Localization ,Procedia Computer Science , Vol. 133 ,pp 831-838 , 2018, https://doi.org/https://doi.org/10.1016/j.procs.2018.07.112, 2018/01/01 - ,
Comparative Research on Deep Learning Approaches for Airplane Detection from Very High-Resolution Satellite Images ,Remote Sensing , Vol. 12 (3),pp 458 , 2020https://www.mdpi.com/2072-4292/12/3/458 - , Microsoft COCO: Common Objects in Context, 2015
- ,
Review Paper on Object Detection using Deep Learning- Understanding different Algorithms and Models to Design Effective Object Detection Network ,International Journal for Research in Applied Science & Engineering Technology , Vol. 7 (3), 2019, https://doi.org/https://doi.org/10.22214/ijraset.2019.3313 - ,
Going deeper with convolutions ,2015 IEEE Conference on Computer Vision and Pattern Recognition (CVPR) ,pp 1-9 , 2015, https://doi.org/https://doi.org/10.1109/CVPR.2015.7298594, 7-12 June 2015 - ,
Rethinking the Inception Architecture for Computer Vision ,2016 IEEE Conference on Computer Vision and Pattern Recognition (CVPR) ,pp 2818-2826 , 2016, https://doi.org/https://doi.org/10.1109/CVPR.2016.308, 27-30 June 2016 - , , Inception-v4, inception-ResNet and the impact of residual connections on learning, presented at the Proceedings of the Thirty-First AAAI Conference on Artificial Intelligence, 2017
- ,
Faster R-CNN with Inception V2 for Fingertip Detection in Homogenous Background Image ,Journal of Physics: Conference Series , Vol. 1196 ,pp 012017 , , https://doi.org/https://doi.org/10.1088/1742-6596/1196/1/012017, 2019/03 2019 - , https://www.iesve.com/
- , , CIBSE Guide A Table 6.3, 2015
- ,
Advanced personal comfort system (APCS) for the workplace: A review and case study ,Energy and Buildings , Vol. 173 ,pp 689-709 , 2018, https://doi.org/https://doi.org/10.1016/j.enbuild.2018.02.008, 2018/08/15 - ,
Analysis of the Thermal Comfort and Energy Performance of a Thermal Chair for Open Plan Office ,J. sustain. dev. energy water environ. syst , Vol. 8 (2),pp 373-395 , 2020, https://doi.org/https://doi.org/10.13044/j.sdewes.d7.0298