


Water scarcity is such an intense source of concern for modern society that the issue became one of the Sustainable Development Agenda objectives established by the United Nations for the year 2030 [1]. Indeed, the way to be travelled to ensure water availability and sanitation for all people must undergo management action, scientific development revision, and changes in consumption profiles. In the technological field, potable reuse, a route that makes it possible to use domestic effluents as a source for drinking water production, appears as a promising alternative to equate the problem.
The technical literature on potable reuse is vast and varied; however, the most recent publications could be distributed generically on three axes: management aspects, technological developments, and topics related to sustainability. Studies focusing on management aspects describe, evaluate, identify limitations and suggest improvements in water recycling programs designed for implementation in urban centres. These are the cases of Chalmers et al. [2] and Luthy et al. [3] for the US state of California, and Gile et al. [4], who restricted their research to the city of Monterrey (US-CA). It also integrates Cureau and Ghisi's [5] research on greywater reuse practices as a water and bl n ectricity saving strategy in Joinville's (BR-SC) water supply and residential sewage treatment systems. Studies that propose standards for the use of recovered water in public supply [6], and those that estimate the risk of infection of the population by pathogens when it consumes (or exposes itself to) water obtained from direct and indirect drinking water reuse [7], are also part of this group. Management studies also cover academic productions that evaluate the population's resistance to the consumption of water produced by direct and indirect reuse. Examples include the analyses carried out by Mukhejee et al. [8] for drinking water reuse systems installed in the US and Australia, Nel and Jacobs [9] regarding greywater sources, their collection and treatment methods, and perceived risks for a suburban population of Cape Town (ZA), and Scruggs et al. [10] for arid inland communities in the state of California. Goodwin et al. [11] also discussed the governance of a non-potable water reuse scheme to be installed in London.
Technological developments in drinking water reuse have invested in alternatives that improve treatment efficiency, reducing the levels of chemical and biological contaminants present in wastewater to virtually non-existent levels. Recently, Hooper et al. [12] proposed to replace a reverse osmosis (RO) unit with a biological filter arrangement, in which ozone (O3) additions occur in several stages. Mangalgiri et al. [13] proposed a scheme for optimal use of hydrogen peroxide (H2O2) standard photo oxidizer in Advanced Oxidative Processes (AOP) technologies and chloramines (bio-inhibitors that reduce AOP efficiency). Kamaz et al. [14] investigated the use of bioreactor membrane (MBR) to remove atrazine to levels that enable direct drinking use. Following this line, Vaidya et al. [15] compared the technical performance of granular active carbon, ultrafiltration membranes, RO, and AOPs in indirect drinking water reuse systems. Jung et al. [16] evaluated the application of biofilters for pathogen removal, while Bakare et al. [17] examined the use of a horizontal roughing filtration system for treating domestic greywater.
The economic dimension is a constant presence in studies in which potable reuse is assessed from the sustainability perspective. In this field, Scales et al. [18] funded compliance testing and validation of processes to remove pathogens and chemicals from water obtained from direct reuse, and Singh et al. [19] analyzed the cost-benefit of using coalbed methane in drinking water reuse. Yerri et al. [20] compared the costs and monetary benefits of decentralized greywater reuse systems in the US context.
Life Cycle Assessment (LCA) is frequently adopted in checks on the environmental sustainability of potable reuse. This has occurred with Hsien et al. [21] in assessing the environmental impacts of using water from multiple sources in both drinking and non-drinking water reuse systems for public supply in Singapore. Opher et al. [22] examined through LCA the sustainability of wastewater use recovered from households for toilet flushing and garden irrigation. Hadjikakou et al. [23] proposed a structure based on LCA, costs, social impacts, and multi-criteria decision analysis (MCDA) to assess alternatives for drinking water reuse to supply two US water utilities. Zanni et al. [24] compared the environmental impacts from greywater reuse and rainwater collection with those generated by conventional treatment sources, while Rezaei et al. [25] designed possible scenarios for water reuse and evaluated different types of end-use based on the Triple Bottom Line.
Research such as the ones that analyse the environmental aspects of potable reuse is not frequent in Brazil [26]. Hence, this study proposes another contribution to this field by analysing the environmental performance of integrating conventional and upgraded technologies for water production to expand the water supply of large metropolis of the country. Initially, the impacts of obtaining drinking water both by consolidated treatments and from potable reuse were individually addressed through the application of the LCA technique. The research was carried out for the Metropolitan Region of São Paulo (RMSP), which comprises 39 municipalities and 22 million inhabitants, including the state capital, São Paulo (12 million inhabitants) [27]. Based on these results, the study discusses alternatives of associating water processed by regular practices with the obtained through reuse, so the demand is met with reduced environmental impact. In this case, the pairs were simulated for different water supply ratios, thereby making it possible to perform trend analyses. In doing so, the study makes its main contributions by offering environmentally viable proposals to public managers to address potential water scarcity in densely populated areas of the country and corroborating goal n.6 of the UN 2030 Sustainable Development Agenda [1].
The method applied herein encompasses the following steps: (i) define quality standards that allow the specification of raw water, domestic effluent and drinking water; (ii) describe a route to obtain drinking water from potable reuse in terms of technological approaches and operational conditions, as well as resource consumption and emissions; (iii) design mathematical models to represent each stage of this process from the data and information obtained in the previous step; (iv) select, specify and scale conventional strategies to obtain drinking water from raw water also in terms of their consumptions and emissions; (v) apply the LCA technique to lead an environmental diagnosis of each treatment technology for Primary Energy Demand, Global Warming Potential and Water Depletion; (vi) elaborate a Global Performance Indicator correlating the individual impact contributions of each arrangement; (vii) set Combined Performance Indicators for estimating environmental effects resulting from the integration of each classic arrangement with drinking reuse; and (viii) carry out a critical analysis of the obtained results.
The Brazilian Ministry of Health Decree n. 2914/2011 [28] constitutes the most recent legal arbitration instrument on the potability of drinking water in Brazil. However, simply complying with the quality standards established by this regulation does not always guarantee that the treated water is, in fact, in consumption condition due to the successive appearance of new chemical and microbiological pollutants. This indicates that conventional unit processes may no longer be sufficient to remove a wide variety of pollutants from various sources. More recent, complete, and selective technologies have emerged as possible solutions to solve the problem. Therefore, it was decided to compare the environmental performance of the drinking water route from effluents to those of the conventional route (chemistry) and other variants comprising the biological route and treatment by ultrafiltration. Although still underexplored, the latter options are promising.
Table 1 describes the quality standards for different raw material sources (surface water and domestic effluent) used by the different treatments and characterizes their product (drinking water). The indices referring to surface water were obtained from Resolution n. 357/2005 stipulated by the National Council on the Environment [29], which establishes a classification for Brazilian water bodies and sets environmental guidelines for their frameworks.
For this verification, it was recognized that surface water would be collected from Class 3 water bodies, which becomes fit for consumption only after being subjected to conventional or advanced treatment. The requirements from CONAMA Resolution n. 430/2011 [30] served to specify the domestic effluent, while Decree n. 2914/2011 was adopted for drinking water characterization. The data for Biochemical Oxygen Demand (BOD), Total Suspended Solids (TSS), and phosphates (PO43-) for domestic effluents are not arbitrated by Resolution n. 430/2011, as they are specific to each region. Consequently, these parameters were obtained from a sewage treatment plant located in the state of São Paulo. All other values displayed in Table 1 refer to the maximum tolerable limits for each parameter.
Legal limits: surface water, effluent, and drinking water
Parameter |
Surface water [29] |
Drinking Water [28] |
||||
Dissolved O2 [min. % sat] |
4.00 |
70.0 |
||||
BOD5 [mg/L] |
10.0 |
185–574 |
2.50 |
|||
PO43- [mgP/L] |
4.80–17.0 |
Total Suspended Solids [mg/L] |
196–720 |
|||
Turbidity [NTU] |
100 |
5.00 |
||||
Inorganic compounds [mg/L] |
||||||
Al |
0.20 |
0.20 |
||||
As |
0.033 |
0.50 |
0.010 |
|||
Ba |
1.00 |
5.00 |
0.70 |
|||
Cd |
0.010 |
0.20 |
0.005 |
|||
Pb |
0.033 |
0.50 |
0.010 |
|||
CN- |
0.022 |
1.00 |
0.070 |
|||
Cl- |
250 |
250 |
||||
Cu |
0.013 |
2.00 |
||||
Cr (II) + Cr (IV) |
0.050 |
0.050 |
||||
F- |
1.40 |
10.0 |
1.50 |
|||
Hg |
0.002 |
0.10 |
0.001 |
|||
NO3- (as N) |
0.010 |
0.010 |
||||
NO2 (as N) |
0.001 |
0.001 |
||||
Na |
200 |
|||||
Total dissolved solids |
100 |
|||||
SO42- |
250 |
250 |
||||
Zn |
0.005 |
5.00 |
0.50 |
|||
Organic compounds [mg/L] |
||||||
1,1-dichloroethene |
0.030 |
1.00 |
0.030 |
|||
1,1,2-Trichloroethene |
0.030 |
1.00 |
0.020 |
|||
1,2-dichlorobenzene |
1.00 |
0.010 |
||||
Benzene |
0.005 |
1.20 |
0.005 |
|||
Carbon tetrachloride |
0.003 |
1.00 |
0.004 |
|||
Ethylbenzene |
0.84 |
0.20 |
||||
Pentachlorophenol |
0.009 |
0.009 |
||||
Styrene |
0.070 |
0.020 |
||||
Tetrachloroethene |
0.010 |
0.040 |
||||
Toluene |
1.20 |
0.17 |
||||
Vinyl chloride |
0.002 |
|||||
Xylene (total) |
1.60 |
0.30 |
||||
For the current analysis, potable reuse technology (REU) is feasible from the association between MBR and RO. Meng et al. [31] warn, however, that the MBR will reach its full efficiency (η ≈ 97%) of removing the total Chemical Oxygen Demand present in the feed stream of that system only if the effluent is subjected to preliminary treatments. This intervention takes place through grate operations, applied for coarse solid removal and filtration, for sand extraction. The gratings consist of a bundle of iron (or steel) bars placed in the transverse plane, perpendicular or inclined to the bottom of the channel from which the effluent flows. The spacing between the grids must be designed to avoid significant load losses during the flow. Sand extraction seeks to protect pumps and abrasion equipment and prevent silting. The sandbox size must be selected so as to prevent the retention of sedimentable organic solids [31].
For the REU system assessed herein, the preliminary treatments consist of a grid comprising a mechanical cleaning system and a sandbox coupled to a rotary sieve and helical conveyer thread. The average electricity consumption for the railing was estimated at 1.71 Wh/m3 drinking water, while the separation process involving the litter box and its coupled devices totalled 13.8 Wh/m3.
MBR is a combination of conventional biological wastewater treatment and submerged membrane filtration. The conceptual approach is technically similar to that applied in a traditional wastewater treatment plant, except for the separation of activated sludge and treated wastewater. Replacing sedimentation that would take place in a clarification tank, this operation occurs in a membrane of the MBR unit [32]. Given its characteristics, the MBR unit holds the largest electric consumption of the whole arrangement, of 534 Wh/m3 [33].
After leaving that stage, the effluent follows for disinfection via ultraviolet radiation. Low-pressure mercury vapor lamps produce UV radiation at λ = 254 nm, the optimal wavelength for disinfection and ozone destruction. The UV lamp never comes into contact with the water, as it is housed in a quartz glass sleeve inside the water chamber, and its specific electricity consumption is about 6.42 Wh/m3. Some ultrapure water systems also use λ = 185 nm UV units to reduce Total Organic Carbon [34].
RO is a technology that uses a permeable membrane to remove particles, molecules, and even ions from drinking water. According to this approach, pressure is applied to overcome the osmotic pressure driven by chemical potential solvent differences. RO can remove different types of dissolved and suspended chemical species and biological ones (i.e., bacteria) from industrial and potable water. The effect is that the solute is retained on the pressurized side of the membrane, and the purified solvent (water) passes to the other side [35]. The RO unit designed for REU demands 686 Wh/m3. The treatment is completed with a new application of UV radiation, which is performed alongside hydrogen peroxide (H2O2) to complete water oxidation. The UV/H2O2 system must act as an Advanced Oxidative Process and, therefore, this intervention requires an energy expenditure of 151 Wh/m3 [33], [36].
The REU design was carried out considering the quality specifications of the domestic effluent and drinking water (Table 1) for a total product flow of 3600 m3/h. In addition, it was admitted that the removal of organic matter would occur through nitrification. For modelling the phenomena that occur during the process, equations, stoichiometric constants, and kinetic coefficients obtained from Warsinger et al. [37] and Henze et al. [38] were used. The grid was specified as a set with bars with thickness t = 15.0 mm and spacing s = 2.00 mm, to be installed at an θ = 80° inclination relative to the bottom of the effluent flow channel. In addition, concerning preliminary treatments, a 2.00 mm mesh aperture was defined for the rotating sieve [36].
The MBR tanks were designed considering Purch PSH-1800 type modules from Koch Membrane Systems Inc, with S = 1800 m2 of the individual area [36]. It was estimated that 100 filtration modules are required for the permeate flow treatment. For this context, sludge recirculation flow of QS = 310 m3/h was also calculated. The air consumption of an MBR unit is expressive. According to Tchobanoglous et al. [39] and Cassano and Basile [40] the submerged membrane system makes use of Ωm = 0.25 m3/h·m2, at the same time as a further Фa = 5.30 m3/h·m3 is consumed for aeration of the biological reactor. Under the study conditions, the association of these performances resulted in a total air flow Qa,t = 143 m3/h (at 20°C), which will be maintained by rotary blowers from VentBras Ltda of the R500 type, at ω = 2,250 rpm, pressure drop ΔP = 40.0 kPa and installed power Eae = 3.40 kW. The premise that the slurry recirculation pump must exceed a manometric head of hmt = 5.00 m resulted in an operating power for this equipment of Erp = 1.00 kW. The tailings from this treatment step will be pressed before proceeding to final disposal in an industrial landfill [36].
The RO operation was modelled using the Water Application Value Engine WAVE®, a freeware design software conceived and distributed by DuPont de Nemours Inc. [41]. To this end, it was assumed that the liquid flow would cross the membrane only once. The effluent enters the unit at T = 25°C and P = 370 kPa and acidity index pH = 7.0. The membranes selected to act in RO are thin-film composite [42], with dimensions of ϕ = 20.3 cm and L = 1.00 m and pore diameter of ϕp < 0.001 µm. These elements are made of polyamide and are, therefore, resistant to extreme pH (2.012) oscillations; conversely, the material is poorly tolerant to chlorine (Cl < 0.10 ppm). The system operates at a pressure P = 1500 kPa, and the total active filtration area is S = 343,370 m2. Under these conditions, the RO reached expressive water recovery (η = 80%) and salt and silica rejection (ψsalt ≈ ψSiO2 > 99%) rates [36].
The Basic Sanitation Utility Company of the State of São Paulo (SABESP) holds the public services concession for water production and sewage treatment in the region. Most of the 119 m3/s of drinking water it generates comes from chemical treatment. However, during the last decade, SABESP has made significant investments in biological and ultrafiltration techniques to expand water supply with adequate quality standards for RMSP [43]. These arguments have led to selecting such technologies as the conventional processes for water production assessed in this study.
Coagulation occurs from a dosage of aluminium sulphate (Al2(SO4)3(s)), which acts as a fluidity reducer when creating available Al3+ ions. If dispersed in an aqueous medium, the electrolyte associates with hydroxylates (OH-), producing a colloidal solution. The solid organics present in the raw water adhere to the solution by electronic affinity, being further removed by decantation [44]. Considering the raw water characteristics adopted for modelling the treatment routes (Table 1), an addition of 40.2 g Al2(SO4)3/m3 was admitted to the coagulation step. Residual amounts of suspended material are removed by filtration.
The filter medium consists of materials with different granulometry, from gravel to fine sand, and the latter should be replaced periodically [45]. The replacement rate of this bed was estimated as 1.50 g/m3. An adjustment of the acid content of the water is performed immediately after filtration to avoid pipe corrosion by adding lime (6.20 g/m3) and sodium silicate (1.44 g/m3). Water disinfection occurs by the addition of chlorine gas (Cl2(g)). Although it presents dangers (explosion, corrosion, potential to produce HCl) and occupational problems (dermatitis, burn, visual disturbances, bronchial lesions, pulmonary irritation) during preparation and handling, chlorine is still used for this purpose due to its high oxidation potential [46].
According to the Brazilian Ministry of Health, drinking water delivered to the consumer must contain a minimum concentration of 0.20 ppm residual Cl [43]. In the present case, an administration of 2.02 g Cl2/m3 was considered at this stage of the process. Organic matter and microorganism removal are completed by the addition of 41.3 g/m3 of Oxygen (O2(g)) which, like chlorine, acts as an oxidant for these contaminants when it turns into ozone (O3).
At the end of the process, the water receives complementary treatment to remove pollutants that give it colour, turbidity, odour, and taste, and fluoride is also added to prevent tooth decay. The withdrawal of organoleptics was represented in the model by an activated carbon bed, which must be 661 mg/m3 due to saturation [39]. The fluoridation intensity varies according to local conditions (e.g., climate and temperature). However, the Ministry of Health recommends a residual content of 0.7 ppm F in drinking water [43]. In addition to chemicals, the process makes use of electrical energy to drive and move equipment. The overall consumption of this utility was estimated at 323 Wh/m3 [39].
The other BIO treatment stages and their sequencing are similar to those that make up the chemical process. The amounts of reagents and assets adopted to build this model are the following: Al2(SO4)3 63.6 g/m3; sand 1.15 g/m3; lime 5.42 g/m3; O2(g) 1.74 g/m3; and activated charcoal 227 mg/m3. The need for oxygen pumping to the filters and the circulation of volatile suspended solids cause the electricity consumption for the system to be higher than its counterpart, reaching 693 Wh/m3 [48].
To achieve satisfactory efficiency indexes even when operating water containing high suspended solid contents (typical raw surface water available in many Brazilian regions), ultrafiltration should be preceded by a chemical pre-treatment promoting fluid disinfection. The pre-treatment modelling considered O2(l) (34.3 g/m3) and sodium hypochlorite (NaClO: 4.02 g/m3). It was further admitted that the filter medium would consist of a hollow fibre membrane made from polyvinyl n-fluoride [(CH2CHF)n]. The electrical demand for ultrafiltration was calculated as 372 Wh/m3 [41], [52].
The operations that integrate each of the analyzed procedural schemes are depicted in Table 2. The method used for classification was based on the conventional ordering of water treatment plant stages (preliminary, primary, secondary, and tertiary treatments). The exception was the ultrafiltration operation, whose pre-treatment acts simultaneously as primary and secondary treatments. Table 2 also specifies the scenarios established for performing the study.
Description of the operations of each treatment and the study scenarios; symbols (+) refer to the operations that make up each arrangement
Stage |
Operation |
REU |
CHE |
BIO |
UFT |
Preliminary treatment |
Preliminary treatment |
(+)1 |
|||
Pre-treatment |
(+) |
||||
Pumping/whirling |
|||||
Primary treatment |
Coagulation |
(+) |
(+) |
||
Settling |
(+) |
(+) |
|||
Secondary Treatment |
Filtration |
(+) |
|||
Biologic filtration |
(+) |
||||
MBR |
(+) |
||||
Disinfection |
(+) |
(+) |
(+) |
||
Reverse osmosis |
(+) |
||||
Oxidation |
(+) |
(+) |
(+) |
||
Chemical treatment |
|||||
Ultrafiltration |
(+) |
||||
Tertiary Treatment |
Final treatment |
(+) |
(+) |
The elaboration of the diagnoses followed the methodological guidelines established by the ISO 14044 standard [53] for attributional-type LCA applying a 'cradle-to-gate' application scope. The analyses were carried out considering the production of 1.0 m3 of drinking water according to quality standards set by the legislation. The Product Systems that define each treatment were described schematically in Figure 1. The REU modelling was based on primary data collected for the 20162017 period in a unit located in the state of São Paulo. The models that represent the environmental performances of the other treatment alternatives were constructed using literature data (secondary data), taking into account the average production technology, parameters, and operating conditions practiced in the state of São Paulo. No multifunctional situations were identified in any of the investigated arrangements.
The Life Cycle Impact Assessment (LCIA) was developed from two perspectives. The first quantified resource consumption by each process in terms of Primary Energy Demand (PED) and Water Depletion (WD). The PED results were described by the Cumulative Energy Demand (CED), v. 1.13 method [54], which makes it possible to classify such depletions as to their origin in terms of renewable (biomass; solar, wind and geothermal; and water) and non-renewable (fossil; nuclear; and biomass) energies. The PED indicator was selected due to the known energy-intensive nature of the analyzed processes.
Conversely, impacts related to WD were estimated using the ReCiPe Midpoint (H), v. 1.12 method [55], which totals decreases in raw water from various sources (river, lake, ocean, and underground). The inclusion of this impact category allows for the verification of the amount of raw water spent in each system to produce 1.0 m3 drinking water. The consumption sets up the yield achieved by each technology from a life cycle perspective. The second perspective took into account environmental impacts associated with emissions. To perform this analysis, the Global Warming Potential (GWP) categories were applied, accounting for their effect magnitudes via the method proposed by the Intergovernmental Panel on Climate Change in 2013 [56]. GWP is one of the most important environmental problems to be faced by modern society. Therefore, proposals concerning improvement actions that aim to reduce impacts in this domain must consider GWP when they are planned.
The LCIs that composed the conventional treatments were originated from the following datasets present in the Ecoinvent database [57], [58]: CHE: Tap water {RoW}| tap water production, conventional treatment | Alloc Def, U'; BIO: Tap water {RoW}| tap water production, conventional with biological treatment | Alloc Def', U'; and UFT: Tap water {RoW}| tap water production, ultrafiltration treatment | Alloc Def, U'.
These data sets were selected considering technological similarities between the processes they portray and their counterparts currently in operation in the state of São Paulo. The (few) cases presenting heterogeneities were the object of LCI adaptation procedures to Brazilian systems conditions. Maintenance of the criteria established for the modelling was a constant concern during this process. In the specific cases of the treatments that operate from surface water (CHE, BIO, and UFT), the energy consumed to pump the raw water fed to the systems was estimated considering an average distance of L = 500 m between the river and the treatment. For UFT, the shelf life of each ultrafiltration unit module was set at 10 years.
The preliminary treatments and the MBR system were disregarded for the purpose of preparing the LCI for the REU. This decision was made due to a methodological circumstance linked to the LCA technique. Although technologically necessary to compose the arrangement, the interventions carried out by these steps, especially MBR, on domestic effluents seek to reduce their contamination levels up to (at most) the limits provided for in Brazilian legislation for disposal in water bodies. As wastewater treatment is a compulsory activity in the country, the environmental loads generated in these stages must, therefore, be attributed to the fulfilment of the function 'disposing of effluents in the environment with quality standards consistent with the relevant legislation', which is different from that assessed by the study. Potable reuse is effectively configured only after disinfection provided by UV radiation, followed by the transformations carried out by RO and reduction of Total Organic Carbon, with a second dosage of UV rays. Although disregarded by the REU performance evaluation, the preliminary treatments and the MBR system were designed in detail so that the contamination levels of the wastewater upstream of the REU were known, without which inaccurate stage specification and dimensioning would occur. Another adjustment made to the inventory that describes the REU was to take into account only electricity consumption.
The environmental loads resulting from the manufacture, use, and disposal of chemicals consumed in the process (i.e., O3 and H2O2) were also disregarded (Figure 1). These contributions were below the standard of 1.0% of the cumulative mass contribution adopted as a general cut-off criterion for modelling product systems [53]. Conversely, the stages of transportation and final disposal of solid residues in industrial landfills were considered for the purpose of inventory construction.
Although the RO and MBR units were modelled by different computational resources, care was taken to harmonize the results of these stages' design through the preparation of material and energy balances. This procedure also extended to the preliminary treatments and disinfection and oxidation stages that also comprise the arrangement. The environmental charges originated from electricity generation were computed from secondary data taking into account the national grid (BR grid) composition for 2016 [59]. According to this scenario, the hydroelectric source provides 68% of all energy generated in the country, followed by natural-gas fuelled thermoelectric plants (9.1%), biomass (8.2%), coal (4.2%), and oil derivatives (2.4%), as well as wind generation (5.4%) and nuclear (2.6%).
Product System Schemes for the scenarios under analysis in the present study
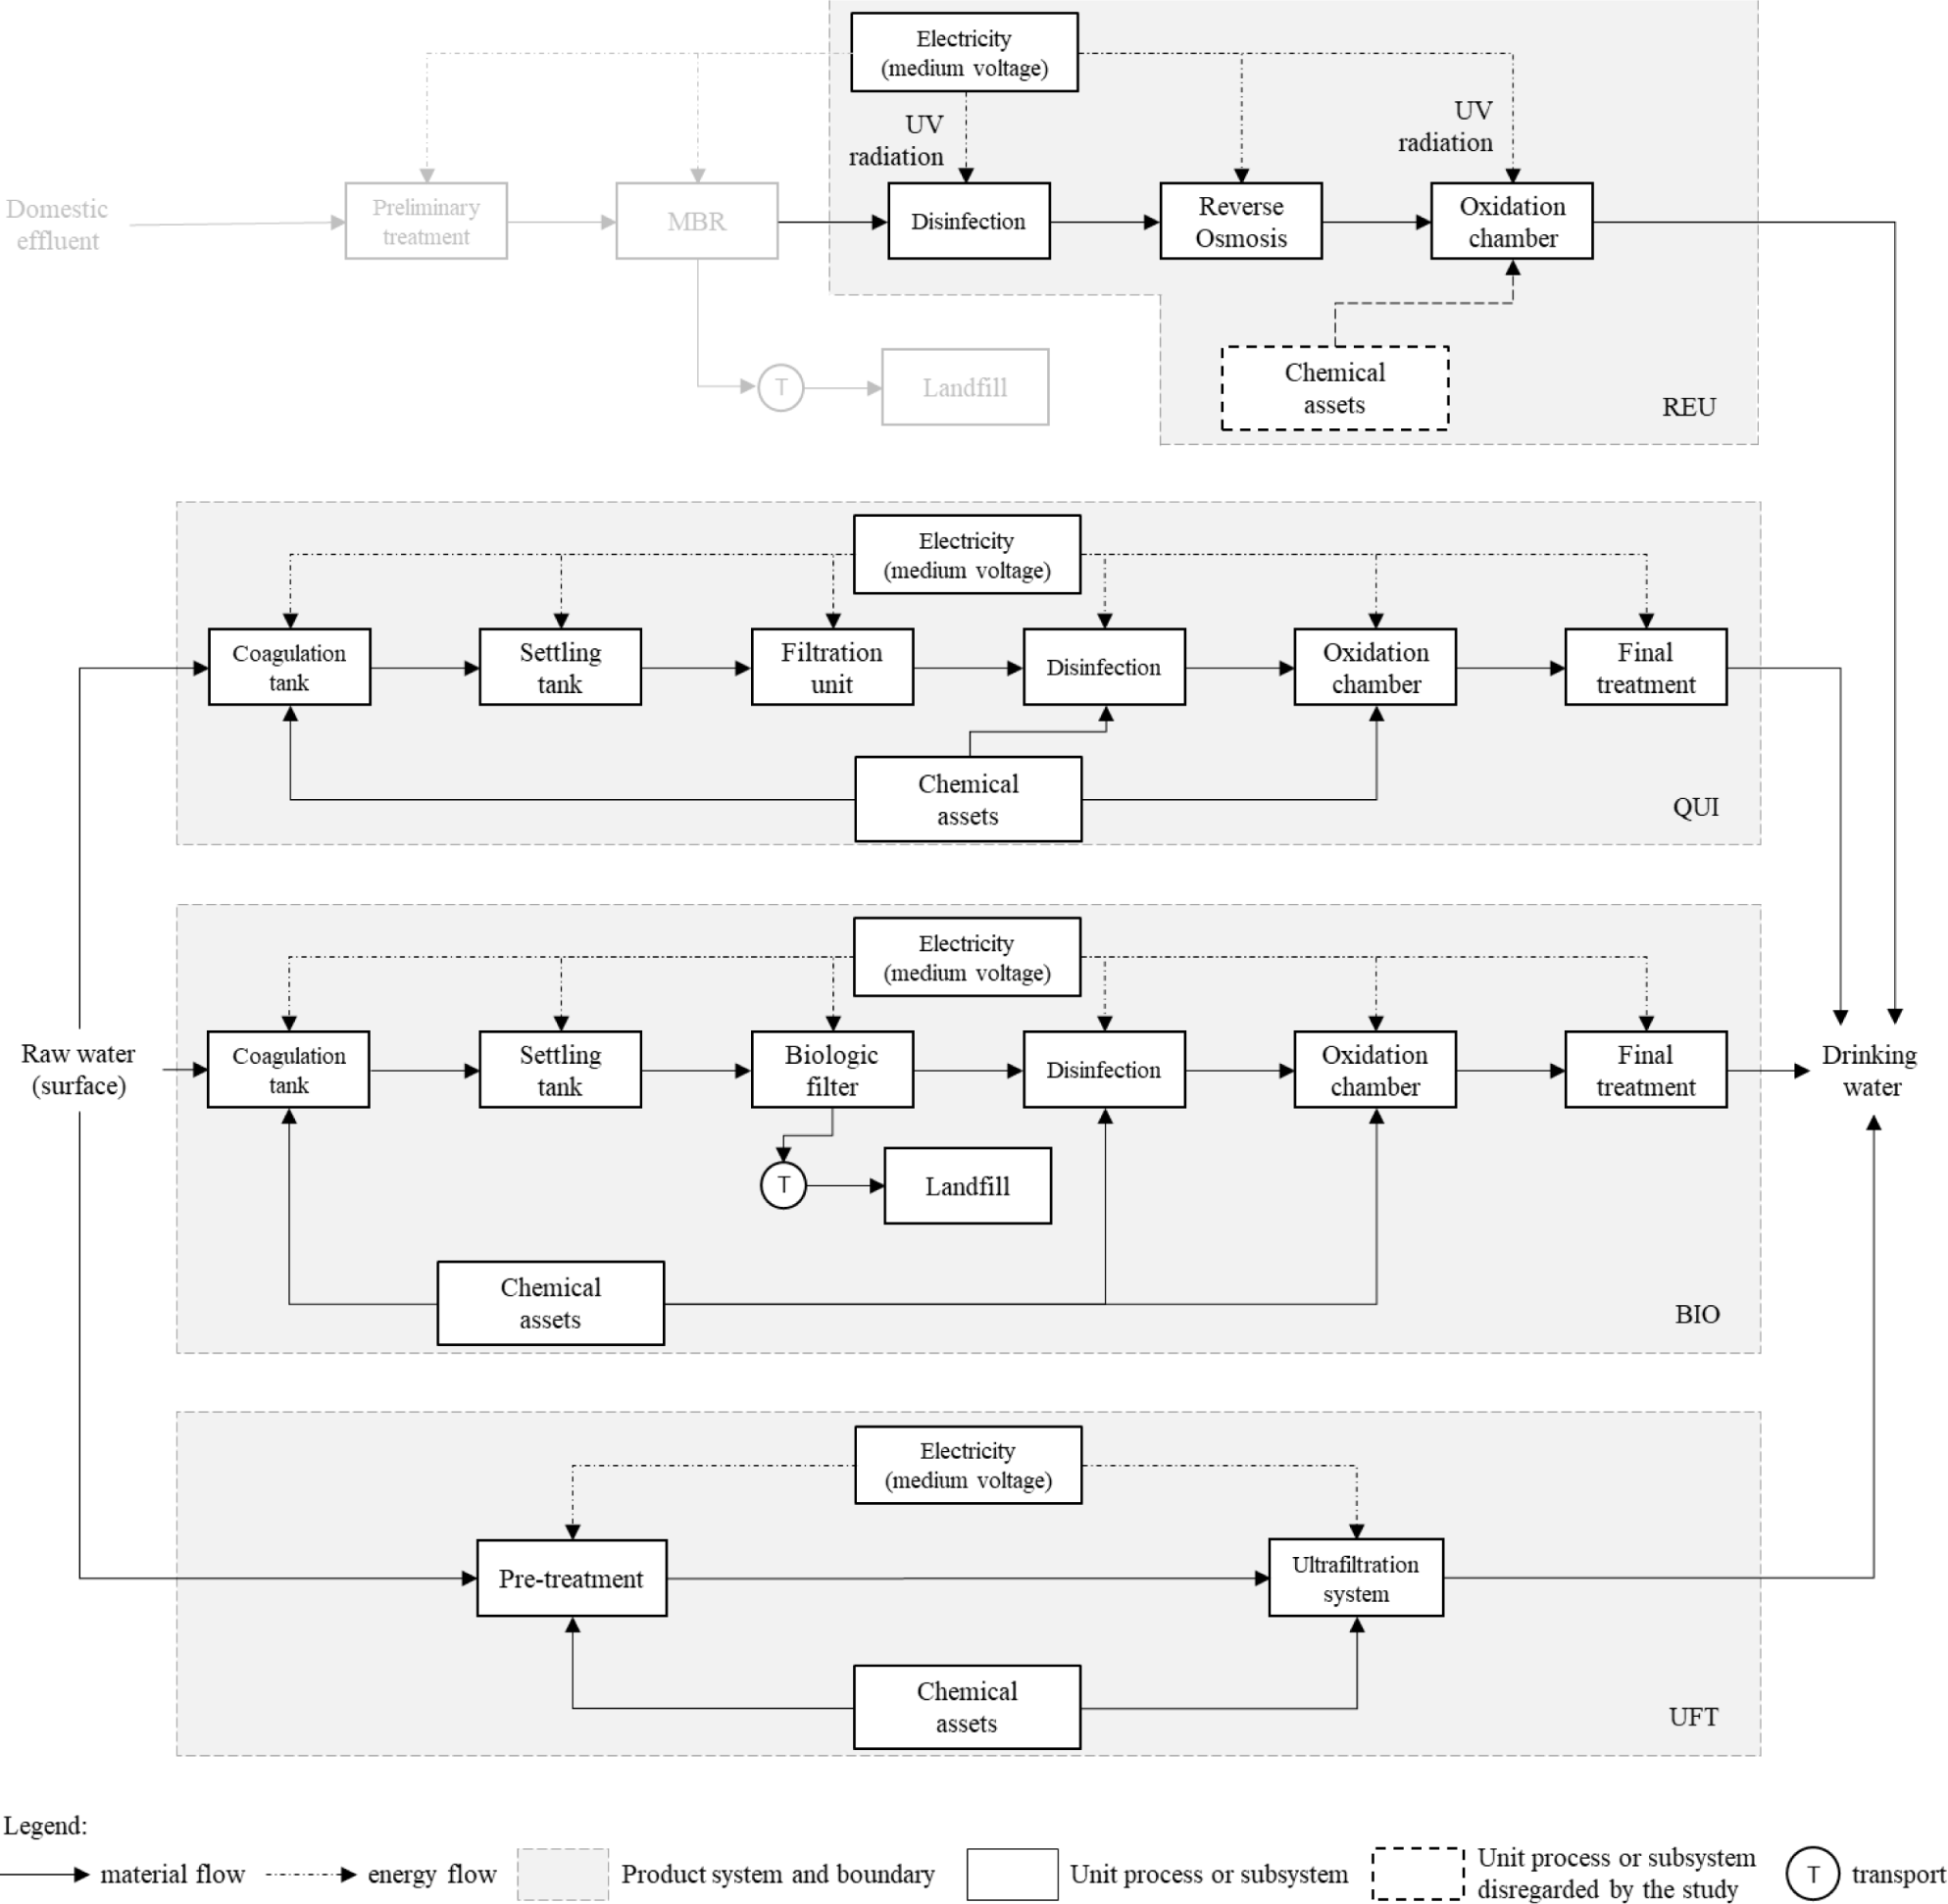
Table 3 displays the environmental diagnoses of the arrangements to obtain 1.0 m3 of potable water. The results indicate that no alternative surpassed another in all analyzed impact categories. Likewise, none of the examined schemes could be disregarded entirely as a water processing route for consumption, as they display inferior performance than their congener.
Chemical treatment (CHE) presents the best results of the series concerning Primary Energy Demand (PED) and Global Warming Potential (GWP). At the same time, as expected, potable reuse (REU) is noteworthy concerning Water Depletion (WD). The biological route (BIO) presents similar impacts of PED as REU, but its performance in terms of GWP can be classified as intermediate. The ultrafiltration (UFT) is at the same level of impact then REU and BIO concerning Primary energy demand but, at the same time, was the less recommended alternative from a GWP perspective.
Environmental performance of systems to produce 1.0 m3 potable water
Impact category |
Unit |
REU |
CHE |
BIO |
UFT |
Primary Energy Demand |
[MJ/m3] |
4.76 |
2.70 |
4.68 |
4.30 |
Global Warming Potential |
[g CO2 eq/m3] |
155 |
99.0 |
169 |
184 |
Water Depletion |
[L/m3] |
3.98 |
1,020 |
994 |
1,016 |
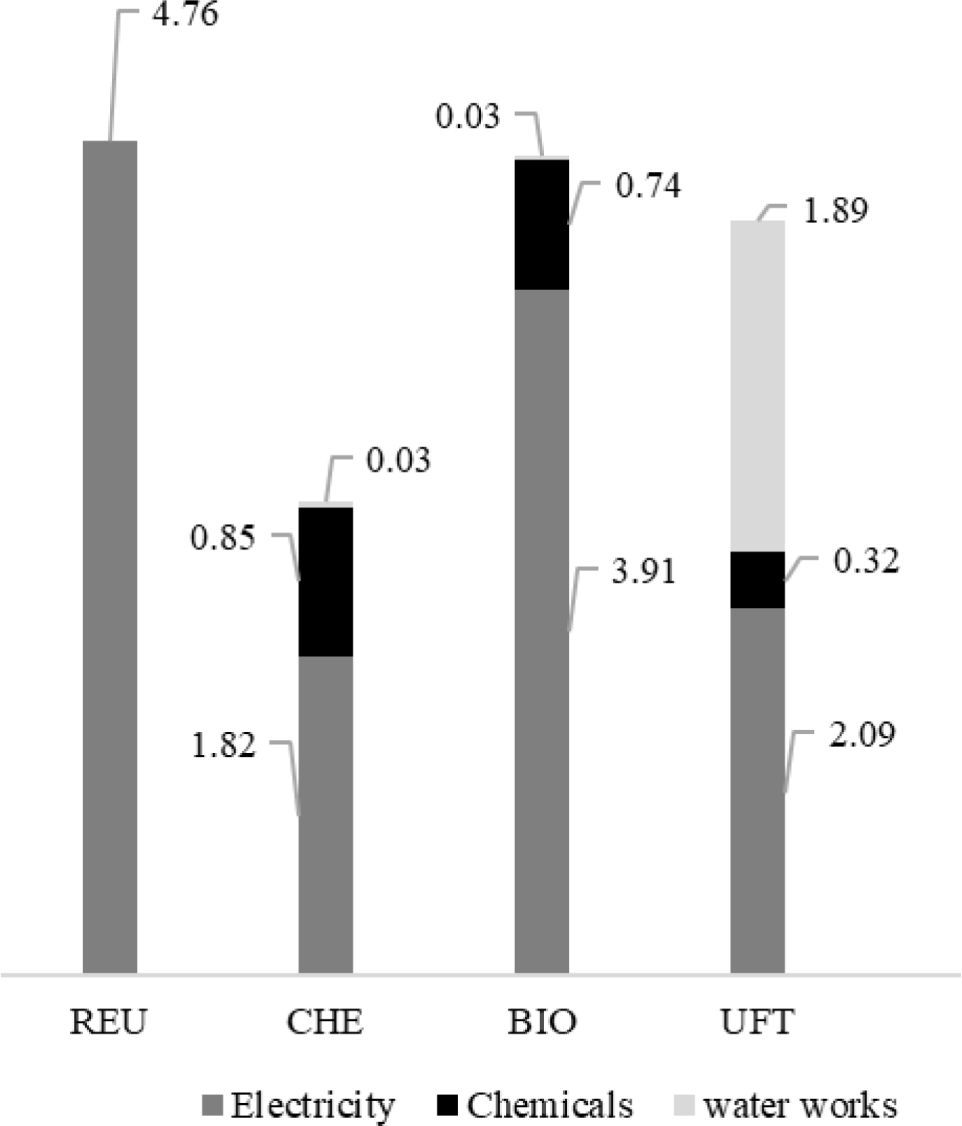
According to the results described in Figure 2, electricity consumption represents the main source of PED impacts for all treatments. Contributions ranged from 48% of the total for the category, as in the UFT case, to 100% observed for REU. The relationship between this contribution (PEDEl) for the total Primary Energy Demand for each scenario and the electricity consumption of the respective treatment unit is imminent. Treatments with low electricity requirements, such as CHE (323 Wh/m3) or UFT (372 Wh/m3), registered the lowest PEDEl values among the analyzed options. In contrast, this index was significant enough in treatments with high requirements i.e., BIO (694 Wh/m3) and REU (844 Wh/m3) to result in energy demand as the primary individual impact cause in the category.
Contributions of each treatment for PED [MJ/m3] discretized by type (or class) of precursors
As in all situations, electricity is provided by the BR grid of 2017, and it was possible to establish a direct correlation between the global energy demand of each system and its impacts share for the category. The result of 5.63 MJ/kWh is compatible with that obtained for the Norwegian matrix (3.86 MJ/kWh), for which, as in the case of the BR grid, the primary energy generation source (~ 95%) in 2017 was hydropower [60].
On the other hand, the BR grid proved to be less impactful in terms of PED than the energy mixes of China (10.9 MJ/kWh), Germany (11.2 MJ/kWh), Japan (11.4 MJ/kWh), France (12.0 MJ/kWh) and the United States (12.4 MJ/kWh). In those energy mixes, fossil sources represented 8893% of the total electricity during the same period [60]. However, even though non-renewable sources contributed only 19% of the Brazilian matrix, this share represented about 40% of the PED impacts. This is because hard coal, raw natural gas, and crude oil the natural resources from which energy sources are obtained exhibit high specific energy values of 30.7 MJ/kg, 38.3 MJ/m3, and 45.8 MJ/kg, respectively [54].
Chemical consumption also has an impact on PED. For CHE, such effects are mainly associated with Al2(SO4)3 (309 J/m3) and O2(l)(330 J/m3). The Al2(SO4)3 is produced from aluminium hydroxide [Al(OH)3], whose synthesis requires natural gas (5.06 MJ/kg) to meet thermal needs. O2 processing occurs with cryogenics, a technology that presents an appreciable electrical demand (1.42 kWh/kg) to achieve high separation efficiencies. For the BIO treatment, PED inputs are due to the manufacture of NaOH (57.4 J/m3), which requires 1.33 kWh/kg when being carried out by electrolysis and, once again, via Al2(SO4)3, whose production, in this case, affects the category at 490 J/m3.
Finally, for the UFT, contributions derived from chemicals are manifested through O2(l) (274 J/m3) and sodium hypochlorite NaClO (45.9 J/m3). NaClO synthesis from chlorination of soda demands 1.62 MJ/kg of heat for being endothermic. Obtaining potable water by ultrafiltration deserves closer attention to PED impacts due to waterworks, which involve structural system aspects. In this segment, the highlights are glass fibre and epoxy resin, regularly used in the manufacture (or for maintenance) of UFT units. Their PED throughout the production is 1.31 MJ/m3 and 549 J/m3, respectively. Such performances are due to the consumption of heat (glass fibre: 14.4 MJ/kg; epoxy resin: 2.91 MJ/kg) resulting from natural gas burning and electricity (glass fibre: 1.61 kWh/kg; epoxy resin: 333 Wh/kg).
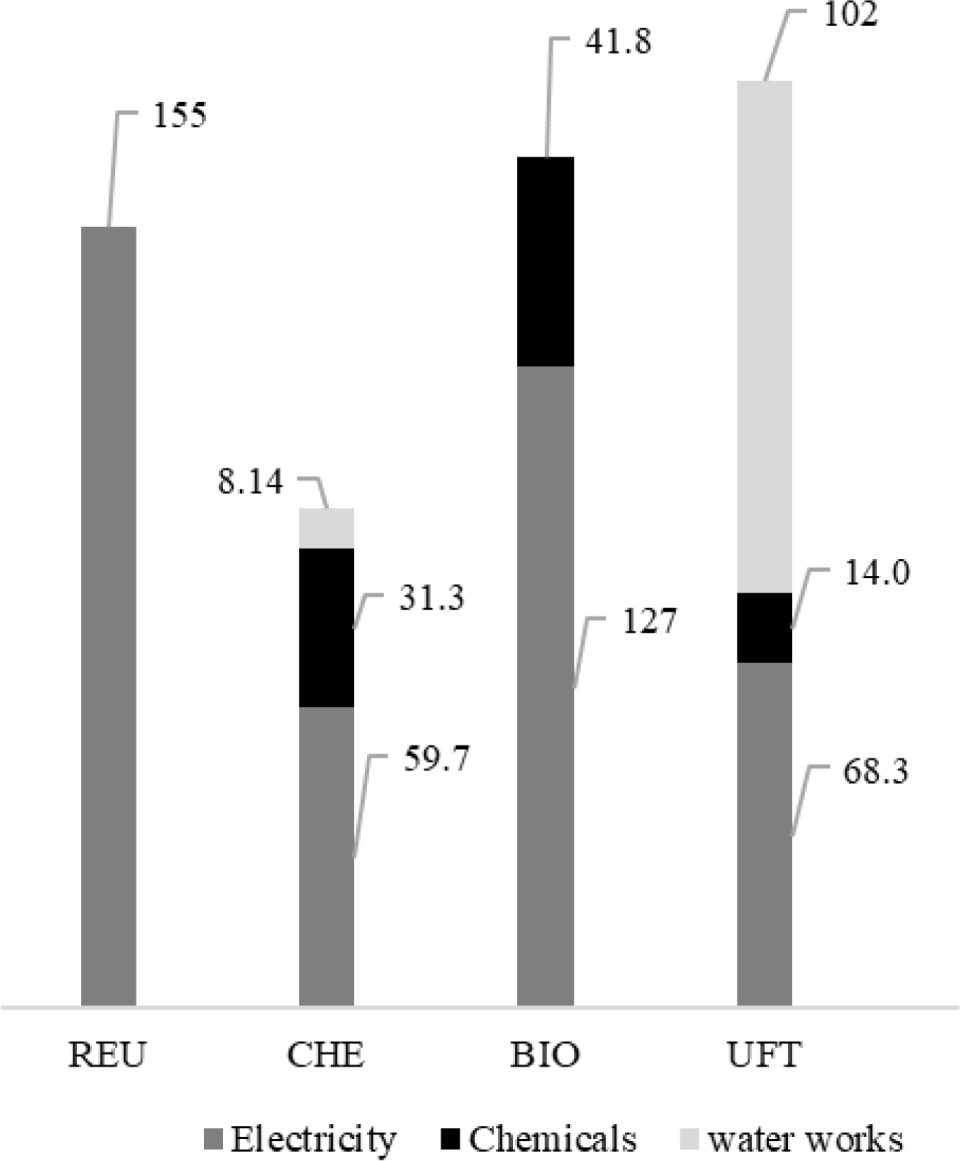
GWP contributions described a behaviour similar to that observed for PED for all the analyzed arrangements, also due to the influence of electricity consumption. REUs performance clearly defines the degree of intensity of this interference since electricity consumption is the only source of impact for the category. CO2 of fossil origin (CO2, f) appears as the primary impact precursor for the scheme, representing about 63% of its contributions to the GWP. Its emissions are mainly due to the combustion of natural gas (44.6 g/m3), coal (35.0 g/m3), and oil products (17.6 g/m3) in thermoelectric plants. Methane (CH4) emissions are due to losses that occurred during the extraction, processing, and transportation of natural gas (1.52 g/m3) and coal mining (135 mg/m3), representing 33% of GWPREU impacts.
About 60% of GWP impacts from the CHE life cycle are due to the power consumption of the treatment itself. A further 10.8 gCO2 eq/m3 are assigned to this treatment due to CO2,f emissions during O2 liquefaction, so that it will be transported and stored in conventional treatment before being used as an oxidizing agent. Other 12.6 g/m3 of CO2,f are also emitted due to the heat generation to be used in the Al2(SO4)3 processing. In addition, another 5.56 kg and 2.17 CO2 eq/m3 are attributed to CHE due to the use of lime (CaO) and chlorine (Cl2 (g)). GWP impacts associated with lime originate from CO2,f emissions from limestone (CaCO3), decomposition, a process regularly applied to obtain this compound. The endothermic character of the reaction (Δh298°C = 182.1 kJ/mol CaO) predisposes the internal temperature of the calcination furnaces to be maintained above 900 °C [61]. This generally occurs through natural gas burning, which generates 292 g CO2,f /kg CaO as a combustion by-product. Another 786 g CO2,f/kg CaO are also released into the atmosphere due to the calcination of the CaCO3 itself. Chlorine production occurs through electrolysis, which consumes between 414500 kJ/kg Cl2,(g) [62]. If generated from the BR grid of 2017, this amount of electricity provides 1.742.10 g CO2,f/m3.
Also, the electricity consumption of the BIO unit was responsible for the main GWP contributions (~ 75%). As with CHE, the processing of Al2(SO4)3 and lime are significant sources of contribution to the category among the chemicals used in the process due to CO2, f emissions, in this case totalling 16.5 and 4.82 g/m3, respectively. Fossil carbon dioxide releases were also identified in the manufacturing cycles of sodium phosphate (Na3PO4: 2.87 g/m3), sodium hypochlorite (NaClO: 2.20 g/m3), sodium hydroxide (NaOH: 1.78 g/m3) and activated silica (SiO2: 1.66 g/m3).
Similar to what was observed for Primary Energy Demand, epoxy resin (28.0 g CO2eq/m3) and glass fibre (73.7 g CO2eq/m3) used for waterworks appear as the most significant foci of GWP for ultrafiltration. As in the previous cases, CO2,f is also the primary impact precursor. From the technical documents that describe sizing and maintenance actions in pressure vessels of RO units operating with seawater, Althaus et al. [57] estimated the average consumption of fiberglass and epoxy resin at 52.1 and 4.07 mg/m3 in UFT plants, at an operational life span of 15 years. Glass fiber production emits on average 34.4 g/m3 of fossil carbon dioxide due to its specific energy consumption of 1.61 kWh electricity and 14.4 MJ heat per 1 kg product.
Contributions of each treatment for GWP [g CO2eq/m3] distributed by type (or class) of precursors
The remainder of CO2,f emissions (24.9 g/m3) recorded by this production cycle comes from the processing of raw materials, such as Nylon 6 (33%), boric acid (27%), aluminium oxide (5.2%), and silica (2.9%) [57]. The most common epoxy resins are obtained by reacting epichlorohydrin with bisphenol A. The product of this interaction is treated to recover the epichlorohydrin, and filtered to increase the purity of the epoxy, which in this stage is in the liquid phase. Althaus et al. [57] reported the total energy (electricity and heat) demand of the process as 141 MJ/kg resin. These utilities generate CO2 emissions, which, together with those resulting from syntheses of epichlorohydrin and bisphenol A, total 24.1 g/m3. The unit's electrical demand completes the GWP impact load, accumulating 37% of the contributions to that category.
Impacts in the form of WD can be considered performance indicators for conventional systems, as they verify the degree of water resources required for each treatment. From this perspective, UFT is slightly better (~ 3.0%) than CHE and BIO, registering almost full yields in converting raw water into potable water. For UFT, this performance can be attributed to the ultrafiltration capacity to separate suspended and dissolved matter from the liquid fraction.
The REU's impact regarding WD is restricted to water consumption to replace regular drains in thermoelectric (purging and evaporation) and nuclear (evaporation) plants. As these sources represented 24% and 2.6% of the electricity generated in Brazil in 2017, respectively, the associated specific consumption of raw water was 4.71 L/kWh. When analyzed alongside the individual energy demand of each treatment, this performance explains the impact fractions related to this utility (Table 4).
CHE and UFT recorded the most significant WD impacts associated with chemicals. In both cases, this is due to using O2(l) in each technology, which corresponds to 41.3 and 34.3 kg/m3, respectively. The process to obtain O2 generally occurs through cryogenics which, according to Althaus et al. [57], accumulates a water consumption of 354 L/kg O2 to replace evaporative losses generated in the cooling tower.
The estimate was based on real-life data collected in a small air separation unit (1.02.0 t/h) and extrapolated to larger systems. In this case, the cooling water demand (circulating) ranged between 120160 L/kg of liquefied product [63], and the makeup accounted for 1.03.0%w/w of the circulating flow [64]. According to Recknagel et al. [65], a maximal makeup of 3.0 kg/h of water is required to cool 1.0 kJ/s of produced waste heat. Althaus et al. [57] applied the allocation procedure based on the economic criterion to distribute the environmental loads associated with the cryogenic process for O2, N2, and Argon (Ar). Thus, O2(l) was responsible for about 31% of the consumption and emissions generated up to that life cycle stage. This decision projected an overall demand of 914 L raw water/kg O2.
Performance of the systems as Water Depletion to obtain 1.0 m3 potable water
WD [L/m3] |
||||
REU |
CHE |
BIO |
UFT |
|
Raw water |
1,033 |
1,032 |
1,003 |
|
Electricity |
3.98 |
1.53 |
3.27 |
1.75 |
Chemicals |
14.8 |
2.43 |
12.4 |
|
Waterworks |
1.67 |
|||
Unpolluted wastewater |
29.3 |
43.7 |
2.98 |
|
Total |
3.98 |
1,020 |
994 |
1,016 |
Of this total, about 560 L/kg O2 are released to the environment as a liquid effluent from the process. However, except for temperature (~ 40 °C), none of the characteristics or properties of this stream were altered by the cooling process. This condition causes the eviction to be treated as 'credit' to CHE and UFT in terms of WD, which must, therefore, be charged against the full consumption of raw water.
Table 4 also highlights the unpolluted wastewater that corresponds to process outlets due to leaks in the pumping of raw or treated water, tanks and filter drainage, equipment washing, and internal system losses. These streams can be used in different functions, provided they receive some level of treatment. Therefore, instead of effluents, LCA considers them as by-products of potable water production technologies.
This status causes unpolluted wastewaters to be affected by the allocation procedures applied to share the environmental burdens generated up to their production. Conversely, as with the liquid water discharged from the cooling tower during cryogenic O2 processing, unpolluted wastewater receives a credit for saving raw water, which should also be discounted from the global demand of each treatment. In this context, CHE and BIO exhibited expressive results, reducing their water depletion by 29.3 and 43.7 L/m3, respectively. BIO performance was sufficient enough that raw water consumption was lower than the produced potable water volume.
The fact that direct result comparisons did not identify a prevailing treatment only reinforces the importance of elaborating a Global Performance Index (GIi) to associate all the impacts verified by the analysis for each alternative. This conduct to define GIi has already been adopted in other situations, as in Hansen et al. [66] who compared different polystyrene processing routes, Donke et al. [67] in the analysis of a multi-purpose ethanol processing plant, and Guerra et al. [68] during a thermodynamic and environmental analysis of scaling up a cogeneration unit. In the field of water reuse, Sakamoto et al. [62] adopted the same approach to evaluate the partial closure of an oil refinery's water circuit. Similarly, Ronquim et al. [69] applied a kind of global performance indicator to increase water conversion in RO membranes of a system designed under a zero-liquid discharge concept. It consists of normalizing those dimensions, defining a reference scenario among the schemes. Given that the common purpose of all treatments is to produce potable water, the baseline scenario was selected as the one accumulating the highest raw water consumption to exercise this function. This criterion led to the choice of CHE (Table 1). The Normalized Impact Index for each scenario was estimated by applying the following equation:
(1)
where: NIik describes the Normalized Impact Index for the impact category k of arrangement i, EIik refers to the Environmental Impact k for scenario i, and EICHEk denotes the Environmental Impact k for the baseline scenario (CHE). The Global Performance Index value of the treatments was estimated by multiplying their respective NIik to measure the intensity of potential synergy (or conflicts) among the analyzed dimensions. Such estimates were made as follows:
(2)
where GIi is the Global Performance Index for scenario (i).
Table 5 describes individual results of NIik and the corresponding GIi for each treatment. It follows from the comparison between GIi values that REU is the less impactful option for the production of 1.0 m3 of potable water among the options considered by this study. Although its individual contributions for Primary Energy Demand (NIREUPED) and Global Warming Potential (NIREUGWP) were 76% and 57% higher than those of the baseline scenario, respectively, its performance in terms of Water Depletion (NIREUWD) significantly reduced those deviations. In addition, REU has already shown better total performance than BIO and UFT even before considering raw water consumption.
NIik and GIi for each treatment alternative under analysis
Normalized Index (NIik) |
REU |
BIO |
CHE |
UFT |
Primary Energy Demand |
1.76 |
1.00 |
1.73 |
1.59 |
Global Warming Potential |
1.57 |
1.00 |
1.71 |
1.86 |
Water Depletion |
0.0039 |
1.00 |
0.97 |
1.00 |
Global Performance Index (GIi) |
0.011 |
1.00 |
2.88 |
2.95 |
Nevertheless, the standard deviation calculated for the NIREUk indices (sdREU = 0.79) demonstrated a high degree of dispersion among those results. This disparity results from the essence of potable reuse. On the one hand, more energy resources are consumed to purify domestic wastewater compared to approaches that use raw water. On the other hand, reuse technology avoids (or at least restricts) impacts in the form of Water Depletion, which are inherent to conventional routes. In this context, and as expected, the normalized impact indexes of conventional treatments exhibited a low degree of dispersion (sdBIO = 0.35; and sdUFT = 0.36). Finally, it should be noted that NIBIOWD 1.0. Although slightly lower than those obtained by CHE, such results can be seen as indicators of the high efficiency of those arrangements compared to the baseline scenario, especially if viewed from a perspective of the water needs of large metropolises.
Even though REU presented the best environmental performance among the analyzed options, it is difficult for this treatment technology to be applied exclusively to supply the demand of densely populated areas. In addition to not being able to provide the water volume required by many cities, potable reuse practices are regulated by legal provisions in the state of São Paulo [70]. Thus, this option is likely to be applied together with a conventional technology used for potable water production. The context caused an analysis for the investigation, at the trend level, of the effects that arose from these integrations. Thus, a Combined Global Performance Indicator (CIREUi) was developed. The magnitude of CIREUi varies according to the REU Global Performance Indices and the associated treatment, as well as the water participation from potable reuse (fREU) produced from this consumer good. Therefore, GIREU, GIi and fREU are related to compose CIREUi and are described as follows:
(3)
where: CIREUi is the Combined Global Performance Indicator for the combination of REU and technology i; GIREU refers to the Global Performance Index for REU; GIi is the Global Performance Index for the technology i; and fREU represents the relative water contribution rate obtained via REU for the total amount of consumed water.
Taking into account some restrictions on the application of potable reuse in São Paulo [70], it was decided that fREU would be analyzed within a domain ranging from 0 to 70%. The upper limit of the range corresponds to the recommended limit rate for REU participation in arrangements of this nature [70].
Figure 4 presents the behaviour trends for CIREUi = F (GIREU; GIi; fREU) or each possible association. As expected, due to the data presented in Table 5, CIREUi decreases with increasing fREU for any of the analyzed combinations, so much so that the angular coefficients of the first-degree curves that relate CIREUi to fREU are negative. The composition between REU and CHE presented the lowest combined impacts for the variation range of fREU. Consequently, the best performance among all analyzed scenarios, of CIREUCHE = 0.308, was obtained for the maximum rate of water substitution from chemical treatment with that originating from potable reuse (fREU = 70%).
Contributions of each treatment for GWP distributed by type (or class) of precursors
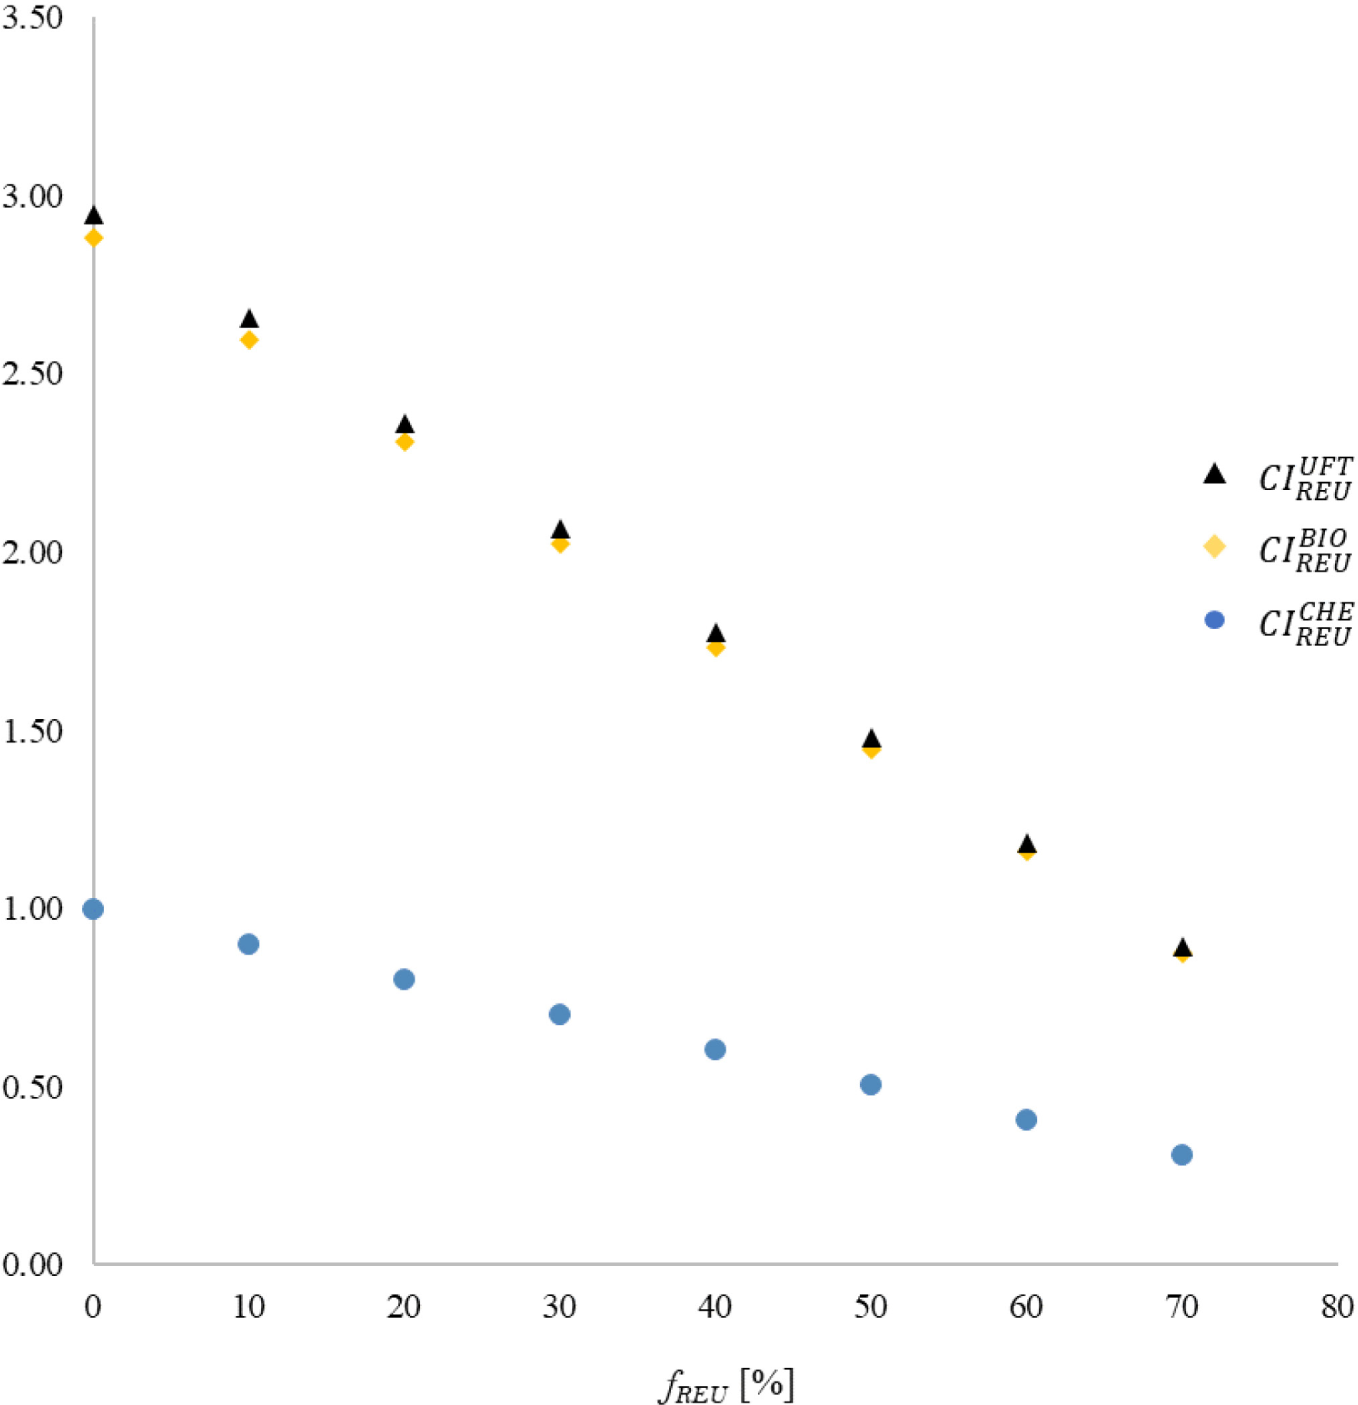
The fact that CIREUBIO ≈ CIREUUFT for the entire range of reused water variation suggests that the association of this approach with biological or ultrafiltration treatments results in equivalent performances, at least concerning environmental effects. In addition, the replacement of any of these traditional technologies with domestic effluent reuse is now considered an effective alternative for the purpose of water management in situations where fREU ≥ 60%. This condition is justified by the similarities between the CIREUBIO and CIREUUFT performances for that level of reuse intervention, and the results recorded by CIREUCHE when fREU ≤ 20%.
This study analyzed the environmental performance of integrating conventional and upgraded technologies for water production. The evaluation considered potable reuse and the traditional technologies used to produce drinking water of chemical, biological, and ultrafiltration processes. Attributional LCA was applied for the impact categories of Primary Energy Demand (PED), Global Warming Potential (GWP), and Water Depletion (WD), and considering the production of 1.0 m3 of potable water in consumption condition.
The results suggest that potable reuse may be an environmentally promising alternative for the production of drinking water. In addition to registering (predictably) a much lower impact than that obtained by the other analyzed technologies in terms of WD (3.98 L/m3), its performances concerning PED (4.76 MJ/m3) and GWP (155 g CO2eq /m3) were equivalent, if not better, than those of traditional treatments. The fact that potable reuse is energy-dependent (844 Wh/m3) conditioned its PED and GWP results to the characteristics of the Brazilian electrical matrix, represented in the study by the 2017 BR grid, composed of 81% renewable sources. An argument in favour of reuse is that projections for the future indicate the BR grid will continue to maintain this rate of renewable sources.
The absence of a technology surpassing the other analyzed scenarios in all dimensions motivated the introduction of the Global Performance Indicator that associates the effects of the analyzed impacts. According to this approach, potable reuse is established as a less aggressive alternative. This result was greatly influenced by the performance of the process in terms of WD. The Combined Global Performance Indicator was created to investigate the effects of integrating reused water with that obtained from conventional technologies. The best results were obtained by the arrangement gathering potable reuse and chemical treatment, with performances 65 to 67% lower than the other assessed compositions, depending on the water rate from potable reuse in the mix.
The findings of this research can support strategy proposals for management mechanisms and public policies capable of ensuring the availability and sustainable management of water and sanitation for the Brazilian population. It would corroborate the expectations of the Brazilian government agencies concerned with meeting goal n.6 of the UN 2030 SD Agenda.
This study was funded in part by the Coordenação de Aperfeiçoamento de Pessoal de Nível Superior Brazil (CAPES) Finance Code 001.
- , , 2017
- ,
A New Water Source for Southern California: The Regional Recycled Water Program ,J. AWWA , Vol. 112 (12),pp 619 , 2020, https://doi.org/https://doi.org/10.1002/awwa.1628, Dec. - ,
Urban Water Revolution: Sustainable Water Futures for California Cities ,J. Environ. Eng. , Vol. 146 (7),pp 04020065 , 2020, https://doi.org/https://doi.org/10.1061/(ASCE)EE.1943-7870.0001715, Jul. - ,
Integrated Water Management at the Peri-Urban Interface: A Case Study of Monterey, California ,Water , Vol. 12 (12),pp 3585 , 2020, https://doi.org/https://doi.org/10.3390/w12123585, Dec. - ,
Electricity savings by reducing water consumption in a whole city: A case study in Joinville, Southern Brazil ,J. Clean. Prod. , Vol. 261 ,pp 121194 , 2020, https://doi.org/https://doi.org/10.1016/j.jclepro.2020.121194, Jul. - ,
AWWA Standards for Water Reuse ,J. AWWA , Vol. 112 (9),pp 3842 , 2020, https://doi.org/https://doi.org/10.1002/awwa.1575, Sep. - ,
Pathogen infection risk to recreational water users, associated with surface waters impacted by de facto and indirect potable reuse activities ,Sci. Total Environ. , Vol. 722 ,pp 137799 , 2020, https://doi.org/https://doi.org/10.1016/j.scitotenv.2020.137799, Jun. - ,
Making water reuse safe: A comparative analysis of the development of regulation and technology uptake in the US and Australia ,Saf. Sci. , Vol. 121 ,pp 514 , 2020, https://doi.org/https://doi.org/10.1016/j.ssci.2019.08.039., Jan. - ,
Investigation into untreated greywater reuse practices by suburban households under the threat of intermittent water supply ,J. Water, Sanit. Hyg. Dev. , Vol. 9 (4),pp 627634 , 2019, https://doi.org/https://doi.org/10.2166/washdev.2019.055., Dec. - ,
Direct potable water reuse in five arid inland communities: an analysis of factors influencing public acceptance ,Manag. , Vol. 63 (8),pp 14701500 , 2019, https://doi.org/https://doi.org/10.1080/09640568.2019.1671815 - ,
Collaboration on risk management: The governance of a non-potable water reuse scheme in London ,J. Hydrol. , Vol. 573 ,pp 10871095 , 2019, https://doi.org/https://doi.org/10.1016/j.jhydrol.2017.07.020., Jun. - ,
Pilot testing of direct and indirect potable water reuse using multi-stage ozone-biofiltration without reverse osmosis ,Water Res. , Vol. 169 ,pp 115178 , 2020, https://doi.org/https://doi.org/10.1016/j.watres.2019.115178., Feb. - ,
Optimizing Potable Water Reuse Systems: Chloramines or Hydrogen Peroxide for UV-Based Advanced Oxidation Process? ,Environ. Sci. Technol. , Vol. 53 (22),pp 1332313331 , 2019, https://doi.org/https://doi.org/10.1021/acs.est.9b03062., Nov. - ,
Atrazine Removal from Municipal Wastewater Using a Membrane Bioreactor ,Int. J. Environ. Res. Public Health , Vol. 17 (7),pp 2567 , 2020, https://doi.org/https://doi.org/10.3390/ijerph17072567., Apr. - ,
Pilot Plant Performance Comparing Carbon-Based and Membrane-Based Potable Reuse Schemes ,Environ. Eng. Sci. , Vol. 36 (11),pp 13691378 , 2019, https://doi.org/https://doi.org/10.1089/ees.2018.0559., Nov. - ,
Biofilters as effective pathogen barriers for greywater reuse ,Ecol. Eng. , Vol. 138 ,pp 7987 , 2019, https://doi.org/https://doi.org/10.1016/j.ecoleng.2019.07.020., Nov. - ,
Pilot study of a horizontal roughing filtration system treating greywater generated from a peri-urban community in Durban, South Africa ,J. Water Reuse Desalin. , Vol. 9 (3),pp 330337 , 2019, https://doi.org/https://doi.org/10.2166/wrd.2019.055., Sep. - ,
A critical control point approach to the removal of chemicals of concern from water for reuse ,Water Res. , Vol. 160 ,pp 3951 , 2019, https://doi.org/https://doi.org/10.1016/j.watres.2019.05.035., Sep. - ,
Potable Reuse of Coalbed Methane-Produced Waters in Developing Country ContextsCould the Benefits Outweigh the Costs to Facilitate Coal Transitions? ,Energies , Vol. 13 (1),pp 154 , 2019, https://doi.org/https://doi.org/10.3390/en13010154., Dec. - ,
Decentralized water reuse planning: Evaluation of life cycle costs and benefits ,Resour. Conserv. Recycl. , Vol. 141 ,pp 339346 , 2019, https://doi.org/https://doi.org/10.1016/j.resconrec.2018.05.016., Feb. - ,
Life cycle assessment of water supply in Singapore A water-scarce urban city with multiple water sources ,Resour. Conserv. Recycl. , Vol. 151 ,pp 104476 , 2019, https://doi.org/https://doi.org/10.1016/j.resconrec.2019.104476, Dec. - ,
Comparative life cycle sustainability assessment of urban water reuse at various centralization scales ,Int. J. Life Cycle Assess. , Vol. 24 (7),pp 13191332 , 2019, https://doi.org/https://doi.org/10.1007/s11367-018-1469-1., Jul. - ,
A flexible framework for assessing the sustainability of alternative water supply options ,Sci. Total Environ. , Vol. 671 ,pp 12571268 , 2019, https://doi.org/https://doi.org/10.1016/j.scitotenv.2019.03.288., Jun. - ,
Modeling for sustainability: Life cycle assessment application to evaluate environmental performance of water recycling solutions at the dwelling level ,Sustain. Prod. Consum. , Vol. 17 ,pp 4761 , 2019, https://doi.org/https://doi.org/10.1016/j.spc.2018.09.002., Jan. - ,
A multi-criteria sustainability assessment of water reuse applications: a case study in Lakeland, Florida ,Environ. Sci. Water Res. Technol. , Vol. 5 (1),pp 102118 , 2019, https://doi.org/https://doi.org/10.1039/C8EW00336J - ,
A bibliometric overview of Brazilian LCA research ,Int. J. Life Cycle Assess. , Vol. 21 (12),pp 17591775 , 2016, https://doi.org/https://doi.org/10.1007/s11367-016-1132-7., Dec. - Estimates of The Population Living in Brazil and Federation Units, 2019, https://sidra.ibge.gov.br/tabela/6579
- , , Ministry of Health of Brazil, Provides on the procedures for control and surveillance of water quality for human consumption and its standard of potability, 2011
- , , Provides on the classification of water bodies and environmental guidelines for their framing, as well as establishes the conditions and standards for effluent discharge, and makes other provisions, 2005
- , , Provides on the conditions and standards of discharge of effluents, 2005
- ,
A comprehensive study on membrane fouling in submerged membrane bioreactors operated under different aeration intensities ,Sep. Purif. Technol. , Vol. 59 (1),pp 91100 , 2008, https://doi.org/https://doi.org/10.1016/j.seppur.2007.05.040., Feb. - ,
Avaliação do tratamento preliminar da estação de tratamento de efluentes do campus de São Cristóvão da Universidade Federal de Sergipe ,Sci. Plena, (in Portuguese) , Vol. 13 (10), 2017, https://doi.org/https://doi.org/10.14808/sci.plena.2017.109903., Nov. - Water Technologies & Solutions, 2017, https://my.suezwatertechnologies.com, 2017. GEA32879
- ,
The biofilm membrane bioreactor (BF-MBR)a review ,Desalin. Water Treat. , Vol. 37 (13),pp 288295 , 2012, https://doi.org/https://doi.org/10.1080/19443994.2012.661283., Jan. - , , American Water Works Association, 2008
- ,
Partida operacional de biorreator com membranas (MBR): EPAR CAPIVARI II ,REEC - Rev. Eletrônica Eng. Civ., (in Portuguese) , Vol. 8 (1), 2014, https://doi.org/https://doi.org/10.5216/reec.v8i1.25423., Feb. - ,
Energy efficiency of batch and semi-batch (CCRO) reverse osmosis desalination ,Water Res. , Vol. 106 ,pp 272282 , 2016, https://doi.org/https://doi.org/10.1016/j.watres.2016.09.029., Dec. - ,
Activated Sludge Models ASM1, ASM2, ASM2d and ASM3 ,Water Intell. Online , Vol. 5 ,pp 97817804023699781780402369 , 2015, https://doi.org/https://doi.org/10.2166/9781780402369., Dec. - , , Wastewater Engineering: Treatment and Resource Recovery, 2014
- , , Advanced membrane science and technology for sustainable energy and environmental applications, 2011
- ,
, WAVE Water Application Value Engine , 2019 - ,
Scale formation and control in high pressure membrane water treatment systems: A review ,J. Memb. Sci. , Vol. 383 (12),pp 116 , 2011, https://doi.org/https://doi.org/10.1016/j.memsci.2011.08.054., Nov. - , https://site.sabesp.com.br/site/
- , , Principles and applications of membrane bioreactors in water and wastewater treatment, 2011
- ,
Comparative life cycle assessment of water treatment plants ,Desalination , Vol. 284 ,pp 4254 , 2012, https://doi.org/https://doi.org/10.1016/j.desal.2011.08.035., Jan. - ,
Environmental Performance Evaluation of a Drinking Water Treatment Plant: A Life Cycle Assessment Perspective ,Environ. Eng. Manag. J. , Vol. 18 (2),pp 513522 , 2019, https://doi.org/https://doi.org/10.30638/eemj.2019.048 - ,
A review of biological drinking water treatment technologies for contaminants removal from polluted water resources ,J. Water Process Eng. , Vol. 33 ,pp 101035 , 2020, https://doi.org/https://doi.org/10.1016/j.jwpe.2019.101035., Feb. - ,
Environmental life cycle comparison of conventional and biological filtration alternatives for drinking water treatment ,Environ. Sci. Water Res. Technol. , Vol. 4 (10),pp 14641479 , 2018, https://doi.org/https://doi.org/10.1039/C8EW00272J - , , Advances in Membrane Technologies for Water Treatment, 2015
- ,
Drinking water treatment with membrane ultrafiltration ,IOP Conf. Ser. Earth Environ. Sci. , Vol. 444 ,pp 012002 , 2020, https://doi.org/https://doi.org/10.1088/1755-1315/444/1/012002., Feb. - , 2013, https://www.funasa.gov.br, (in Portuguese)
- , , Microfiltration and Ultrafiltration Membranes for Drinking Water - Manual of Water Supply Practices - M53, 2005
- Genève, 2006, https://www.iso.org/obp/ui/#iso:std:iso:14044:en, [Online]. Available:
- ,
Cumulative Energy Demand As Predictor for the Environmental Burden of Commodity Production ,Environ. Sci. Technol. , Vol. 44 (6),pp 21892196 , 2010, https://doi.org/https://doi.org/10.1021/es902870s., Mar. - Dübendorf, 2007, https://inis.iaea.org/collection/NCLCollectionStore/_Public/41/028/41028089.pdf, [Online]. Available:
- Cambridge, 2013, https://archive.ipcc.ch/report/ar5/authors.php, [Online]. Available:
- Dübendorf, 2007, https://db.ecoinvent.org/reports/08_Chemicals.pdf, [Online]. Available:
- Zurich, 2014, https://ecoinvent.org/wp-content/uploads/2021/09/Change-Report-v3.8.pdf, [Online]. Available:
- , , Brazilian Energy Balance Year book 2017. (in Portuguese), 2017
- , , Key World Energy Statistics 2019, 2020
- ,
Estudo termogravimétrico do efeito da temperatura e da atmosfera na absorção de dióxido de enxofre por calcário ,Quim. Nova , Vol. 29 (6),pp 12441249 , 2006, https://doi.org/https://doi.org/10.1590/S0100-40422006000600019., Dec. - ,
Environmental Performance of Effluent Conditioning Systems for Reuse in Oil Refining Plants: A Case Study in Brazil ,Energies , Vol. 12 (2),pp 326 , 2019, https://doi.org/https://doi.org/10.3390/en12020326., Jan. - , 2001, https://www.cosmodyne.com
- , , Reference Document on the application of Best Available Technologies to Industrial Cooling Systems, 2000
- , , Pocketbook for heating and air-conditioning technology, including hot water and refrigeration technology, (in Germany), 1997
- ,
Evaluation of the environmental performance of alternatives for polystyrene production in Brazil ,Sci. Total Environ. , Vol. 532 ,pp 655668 , 2015, https://doi.org/https://doi.org/10.1016/j.scitotenv.2015.06.049., Nov. - ,
Environmental and Energy Performance of Ethanol Production from the Integration of Sugarcane, Corn, and Grain Sorghum in a Multipurpose Plant ,Resources , Vol. 6 (1),pp 1 , 2016, https://doi.org/https://doi.org/10.3390/resources6010001., Dec. - ,
Thermodynamic and environmental analysis of scaling up cogeneration units driven by sugarcane biomass to enhance power exports ,Energies , Vol. 11 (1),pp 73 , 2018, https://doi.org/https://doi.org/10.3390/en11010073 - ,
Eco-efficiency analysis of desalination by precipitation integrated with reverse osmosis for zero liquid discharge in oil refineries ,J. Clean. Prod. , Vol. 250 ,pp 119547 , 2020, https://doi.org/https://doi.org/10.1016/j.jclepro.2019.119547., Mar. - , , Disciplines the direct reuse of non-potable water, for urban purposes, from sewage treatment plants and makes correlated arrangements. (in Portuguese), 2017