


Supply of energy and energy security are two important issues that should be considered in the energy field [1]. Concerns including changes in fossil fuel prices, uneven distribution of fossil fuels, increase in energy consumption and demand, uncertainties in oil and gas supplies caused by geopolitical problems and global warming have made governments think through alternative solutions [2]. According to the IEA, residential and commercial sectors consumed 31% of World total final energy in 2013 [3]. Moreover, more than 60 percent of the energy used in the buildings was related to the heating and cooling systems [4]. Buildings are not efficient in most developing countries, designing and constructing efficient buildings plays an important role in energy studies [5]. Nowadays, the use of renewable energy is mentioned as one of the main steps towards sustainable development [6]. Alternative renewable energies can provide constant energy at a reasonable cost if they have managed properly [7]. In recent years, many renewable related jobs have been developed in third-world countries [8]. To reduce external costs and greenhouse gasses (GHG) emission, some researches have been done on supplying a part of buildings energy demand with renewable sources [9].
It is seen that to achieve the optimal energy flows in a green building and reduce GHG emission having energy storage is essential [10]. With the purpose of optimizing system design, building environmental impacts and costs, a life-cycle assessment approach and a multi-objective optimization model are investigated [11]. A micro combined heat and power (MCHP) system is implemented to supply part of the heat and electricity demand in an office and also a residential building [12]. The main part of this study is to anticipate the electricity demand of each user. This ability makes MCHP economic and it depends on self-consumption electricity of users. The MCHP size is characterized by the thermal load. The results show that using MCHP can have a better environmental, economic and energy outcome and also reduces the need for external grid energy.
The Net Zero Energy Building (NZEB) idea is one of the solutions to achieve efficient and sustainable building design [13].
Researches show that NZEB has been applied to different building types, and commercial buildings are one of the main areas that should be taken under consideration [14]. Herpetarium is one of these commercial buildings type, in which different kinds of reptiles are kept. As these animals need different habitat, providing a suitable heating and cooling system is vital.
Based on EU Directive 2009/28/EC, NZEB is a very high energy performance building that uses renewable resources producing on-site or nearby to supply its demand at a very significant level. Indeed, from 2019, all newly EU constructed buildings occupied or owned by public authorities must qualify the NZEB standards and from 2020 all other new buildings following suit from 2020 [15].
Based on the work of Bucking et al. in 2013, it is difficult to reach high levels of decarburization in the energy market neglecting the innovative green buildings [16]. Solar energy is the most favourable renewable energy resource in buildings to achieve NZEBs [17]. More than 40 NZEB projects have been conducted by IEA solar heating and cooling (SHC) [18]. The American Association of Energy Conservation in Building and Community Systems (ECBCS) have also been defined around 50 projects with core title of “Toward Net Zero Energy Solar Buildings” [19].
Katalinic et al. identified and applied architectural and planning solutions to reduce heat loss through the building of the building envelope [20]. Roumi et al. studied using new insulation (expanded polystyrene and hollow silica nanospheres) in building external walls to reduce energy loss and reduce air pollution [21]. The potential contribution of the NZEB principle towards achieving smart cities in Europe is presented in [22]. Also, D׳Agostino presented a summary of the European countries towards the implementation of NZEBs [23]. The main open issues are presented together with classifications, definitions, and calculation methods. Yousefi et al. investigated the effect of city council legislation on renewable energy utilization in Tehran city. The result indicated that 10-20% renewable energy utilization in the under-construction buildings in Tehran can prevent 3045 tone CO2 emission, annually [24].
Along with the above researches, studies have been done for planning and operation of stand-alone power supplies as an independent distribution network [25]. In [26], [27] the energy optimization for a residential building equipped with PV panels has been inspected. Bagheri et al. developed a framework for the optimal planning of urban renewable systems. They considered 3 supply strategies (100% natural gas, natural gas and renewables and 100% renewables). The result indicated that the Levelized Cost of Electricity (LCOE) was more sensitive to the capital cost of batteries than solar panels [28].
PV panels and wind turbines were modelled for urban areas in [29]. This model explored the technical requirements for the installation of wind turbines and PV panels and then investigates the economic feasibility of the proposed system.
Some studies used HOMER software to obtain optimum based on optimal cost and renewable energy source size, minimum GHG emission, etc. Homer is a power optimization program that simplifies the task of calculating power system applications. It offers capabilities for evaluating different configurations by several optimization techniques [30]. Homer provides an optimum possible arrangement of modules that provide a specific thermal and electrical load. For optimal result, Homer can consider some variables including PV module size, wind turbines type, inverters size and the number of required batteries [31].
A hybrid energy system including PV, wind, diesel generator and battery units has been used to meet load demand in [32]. After obtaining the optimal size of the components, the hourly operation of each component for one week period has been investigated for ensuring efficient energy management. Mohammadi et al. studied 100% renewable energy system considering levels of capacity shortage based on cost minimization and reliability constraint [33]. Mehrpooya et al. presented an optimal planning model of a hybrid renewable energy system to supply a real load with a combination of photovoltaic panels, diesel generators and batteries using HOMER software. A technical, economic and environmental assessment was conducted for optimal planning of the hybrid energy system and the impact of diesel fuel price fluctuation on the economic competitiveness of proposed hybrid renewable energy systems in providing off-grid electrical load demand was investigated [34].
This research is to calculate loads for a Herpetarium and to find optimal energy supply based on renewable energy resources available on the site plan. For computing load demand, at first, the heating and cooling loads are calculated by Carrier HAP4.51 software. Next, the total electricity consumption is obtained by considering cooling and heating energy demand and other electrical loads. Finally, the best combination of PV panels and micro wind turbines have been explored by HOMER and an economic-environmental comparison is made between this optimal renewable energy supplies.
This work is to investigate an optimal energy system for a specific commercial building, Herpetarium. The case study for this research is a Herpetarium building located in Nazhvan, Isfahan, Iran. The current Herpetariums locates on 32° 38′ N, 51° 37′ E. It is the only private Herpetarium in Iran. It is a tourist attraction building showing different reptiles around the world.
Due to the different heating and cooling requirements, the building consists of 25 large and 12 small-sized vivariums with different temperatures and humidity levels. As an example, while required temperature for African Peyton is between 24 °C - 30 °C, Rattlesnakes prefer a temperature range between 27 °C and 32 °C and Komodo like extreme heat (almost 35 °C) [35]-[37].
All the studied area are air-conditioned by LG Split Units throughout the year (COP 3.33 for cooling and EER 3.09 for heating). Cooling and heating capacities of the air condition system are 9.3 kW and 11.4 kW, respectively. Therefore, the outputs of Carrier should be modified to equal loads as electrical loads. The other electrical loads such as lighting, pumps, fans, etc. are added to the modified load (as an electrical load). Then, two renewable sources including wind and solar energies are used to supply the required load. Also, when the system is not capable of supplying electricity demand, the needed power will be supplied by the grid. The optimized system is calculated by the Homer software. The purpose of this optimization is to obtain the ideal size of the renewable resources so that the cost is minimized per unit of energy.
LCOE is considered in this study to compare different scenarios. By considering costs to build and operate a generator over a timespan, LCOE compares electricity generation options. eq. (1) demonstrates the procedure to calculate LCOE:
(1)
Based on [38], a reliable power generation system can supply the load demand through a specific amount of time. Therefore, such a system has a little loss of power supply probability (LPSP). The LPSP factor is important for the system because the less grid-dependent the system is, the greater the reliability of the proposed system.
Three scenarios are discussed in this research. In the first scenario, the solar power capacity is considered as zero and the system is supplied with wind energy and the grid. In the next scenario, the load demand is provided with solar power and the grid. Finally, both wind and solar energy sources are used in the last scenario.
Reptiles are cold-blooded animals, and their well-being is sensitive to temperature. The status quo of the cooling and heating loads in the Herpetarium have been simulated with Carrier HAP4.51. HAP4.51 is a commercial software that calculates the cooling/heating demand on an hourly basis and assists engineers in designing heating, ventilation and air conditioning systems for different kind of buildings [39].
In the next step, other electrical loads including lights, fans, water pumps, etc. are added to split units’ electricity consumption, which determines the total load demand of the system. The needed electricity throughout the year is presented in Figure 1.
Load profile of the herpetarium
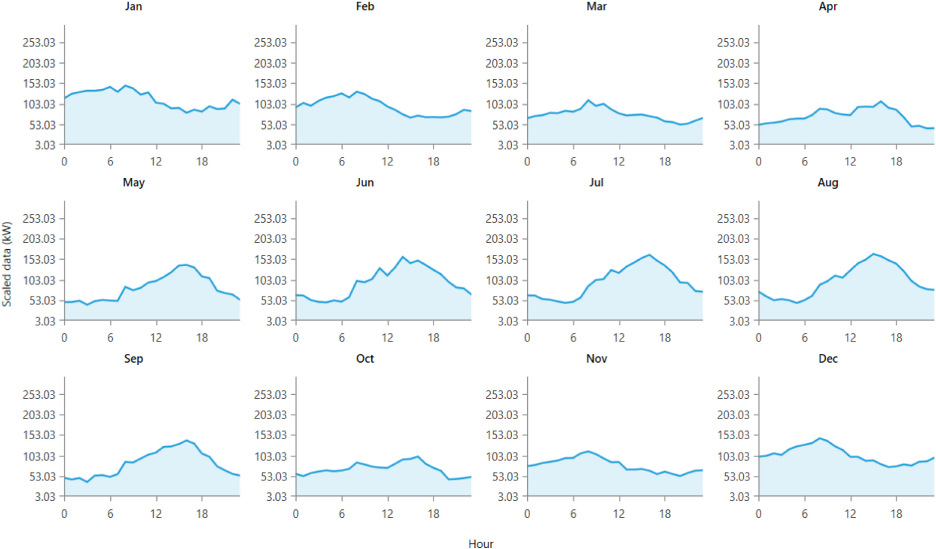
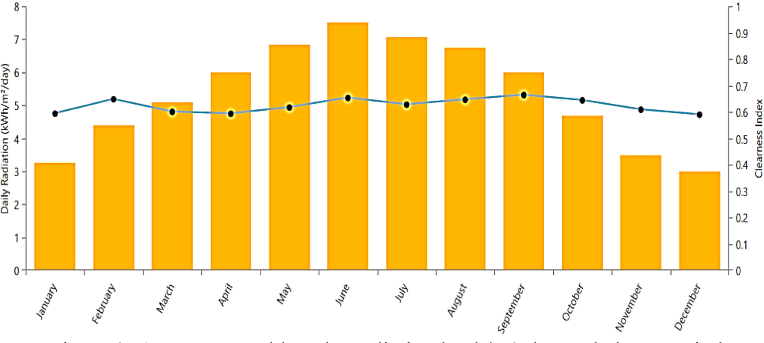
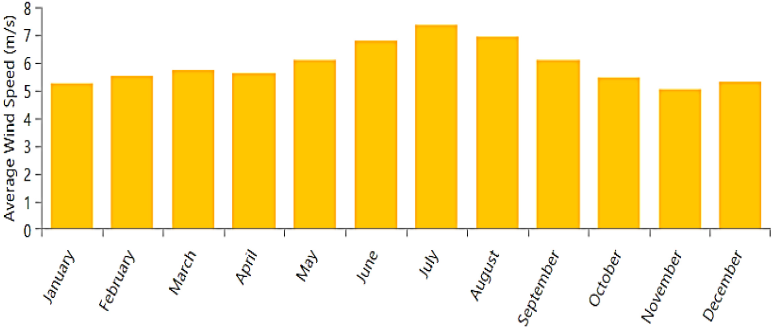
The solar irradiation data is taken from NASA Surface Meteorology and Solar Energy database. Average daily radiation in this region is 4.84 kWh/m2 day (Figure 2). The monthly wind speed data is presented in Figure 3.
Average monthly solar radiation kWh/m2 day and clearness index
Other wind turbine limitations considered in this research were a low average capacity factor, seasonal availability, low reliability, though wind forecasting because of few measuring stations, etc. [40]
Average monthly wind speed
The PV tab in HOMER allows you to enter the cost, performance characteristics and orientation of an array of PV panels as well as choosing among the sizes user wants HOMER to consider as the optimal system.
Considering the available space for placing the PV panels, power intervals for PV panels are 0, 100, 200, 300, 400, 500 kW. Investment cost is considered 1420.7 $/kW, replacement cost and operation and maintenance cost are set 1420.7 $/kW and 30.20 $/year, respectively [33].
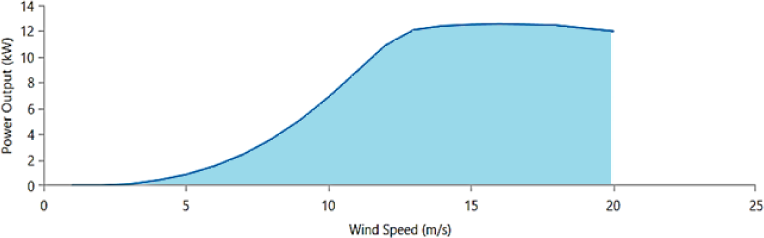
To evaluate the wind power output, the main variable that affects the performance is a wind speed on the hub height of the wind turbines. [33] contains the price of wind turbines itself and have free shipping to Iran. Power interval for wind turbines are 10, 20, 30, 40, 50, 60, 70, 80, 90 and 100 kW. Investment cost is considered 1,097 $/kW, replacement cost and operation and maintenance cost are set 1,097 $/kW and 10.97 $/kW yr, respectively. Figure 4 shows the wind turbine power curve relating to wind speed.
Wind turbine power curve
Any system that contains both AC and DC elements requires a converter and the converters in the proposed system are 40, 50, 60, 70, 80, 90, 100 kW.
Converter price is 600 $/kW and the replacement cost of 600 $/kW and the operation and maintenance of 30 $/kW yr. The efficiency of inverter and rectifier is set to 90 percent and 85 percent [41]. The component’s initial and annual costs and lifetime are presented in Table 1.
Component |
Investment cost[$/kW] |
Annual operation and maintenance cost [$/kW] |
Replacement cost [$/kW] |
Lifetime |
|---|---|---|---|---|
PV |
1420.7 |
30.2 |
1420.7 |
20 years |
Wind turbine |
1097 |
10.97 |
1097 |
15000 hrs |
Converter |
600 |
30 |
600 |
15 years |
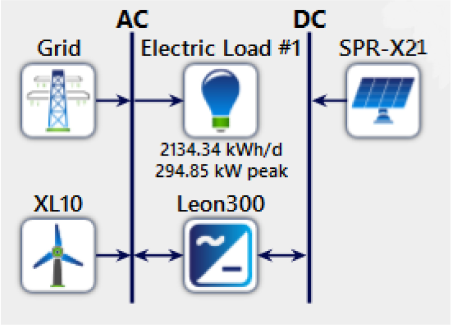
The system lifetime is assumed 25 years, while the interest rate considered 20%. The system is modelled in HOMER software. Investigating an optimal combination of renewable resources based on minimum cost is the first objective of this study. In this section, the optimal number of micro wind turbines, converter, and finally the number of PV panels is determined for the case study (Figure 5). Based on the specific geographical location of the case study and number of devices used, HOMER calculates the generated electricity in each scenario. The electricity shortage is supplied by the grid and excessive electricity is sold to the grid.
System configuration with renewable energy resources in HOMER
The grid power price is assumed 0.1 $/kWh and the grid sell back price is 0.13$/kWh. By considering the mentioned components and assumptions in the previous section, results are as follows:
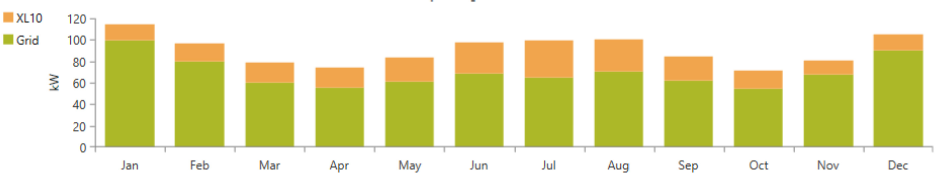
In the first scenario, the solar power capacity is zero and the system is supplied with wind energy and the grid. Although the LCOE in this scenario is 0.0976 $/kWh, a great amount of the energy demand in scenario 1 is provided by the grid and the renewable and LPSP factor are 23.3% and 76.7%, respectively (Figure 6). Therefore, the reptile garden cannot be considered as NZEB because the energy sold to the grid is way less than energy purchased from it. It is worthwhile to say that, in Figure 6, Figure 7 and Figure 8, XL10 and SPR-X21 represent the electricity provided by wind turbines and PV systems, respectively.
Monthly average electricity production in the 1st scenario
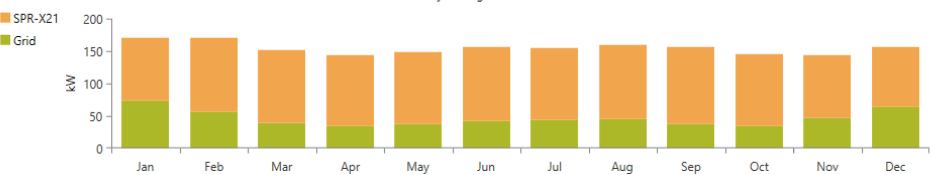
In the second scenario, the load demand is provided with solar power and the grid. In this case, the LCOE is equal to 0.111 and renewable and LPSP factors are 66.6% and 34%, respectively. In this scenario, despite the higher cost of the LCOE compared to the first scenario, the supplied energy by renewable resources is increased, and it shows the reliability of the suggested system (Figure 7).
Monthly average electricity production in the 2nd scenario
Based on the two previous scenarios the reptile garden cannot be considered as an NZEB if it is just supplied by the wind turbines and the LCOE is high while using only solar panels. The third scenario is modified by considering a combination of both renewable energies to supply a reptile garden as an NZEB and minimize the LCOE. According to the HOMER results in this scenario 2 wind turbines and 400 solar panels would be utilized. The calculations show that the LCOE is 0.1083 USD per kWh, which is higher than the first scenario and lower than the second one. Also, the renewable and LPSP factor is 64.9% and 35.1% (Figure 8).
Monthly average electricity production in the 3rd scenario
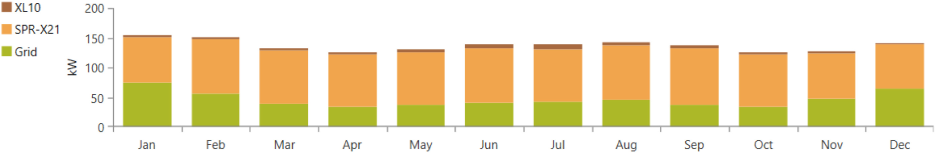
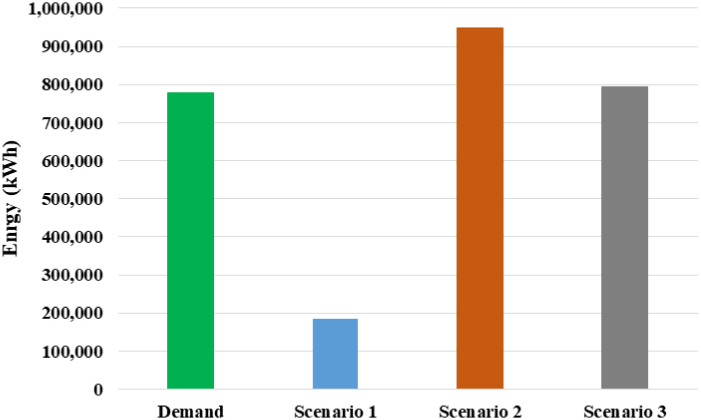
Figure 9 illustrates the reptile garden energy demand and energy production of each scenario.
Energy demand by the reptile garden and energy production in 3rd scenario
The result of all scenarios is demonstrated in Table 2. In this table, the supplying energy demand of the reptile garden by the grid (without any renewable sources) is considered as “Scenario 0”. Although the initial cost of scenario 0 is zero, the net present cost of this option is considerable because of the great amount of energy which must be bought from the grid system.
As it is obvious, the LCOE in the first scenario is the least and the initial cost of this scenario is much lower than other scenarios, however, the dependency on the grid is completely considerable while we are only using wind energy. As previously mentioned, the reptile garden cannot be considered as NZEB because the energy sold to the grid is way less than energy purchased from it.
Net Present Cost [$] |
Initial cost [$] |
LCOE [$/kWh] |
Renewable factor [%] |
Energy purchased from the grid [kWh] |
Energy old to the grid [kWh] |
|
|---|---|---|---|---|---|---|
Scenario 0 |
598,128 |
0 |
0.103 |
0 |
779,035 |
0 |
Scenario 1 |
576,691 |
109,700 |
0.0976 |
23.3 |
607,790 |
13,815 |
Scenario 2 |
1,010,000 |
890,350 |
0.111 |
66.6 |
407,426 |
442,375 |
Scenario 3 |
923,338 |
770,220 |
0.1083 |
64.9 |
423,643 |
428,643 |
The initial cost in the second scenario is much higher in comparison with the first scenario and the cost of electricity is 0.111 $/kWh. Although solar power can supply 66.6% of the reptile garden demand, the excess electricity production is more the needed electricity. This fact can classify a reptile garden as an NZEB.
Also, when both wind and sun power are considered for optimal energy supply, the LCOE can reduce to 0.1083 $/kWh and energy production is slightly more than electricity demand.
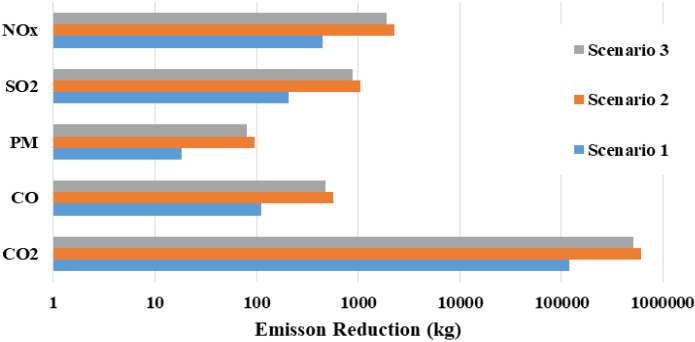
Another aspect of this research is to calculate the amount of greenhouse gasses and air pollutant which can be prevented from emitting to the air by not needing the grid electricity. Based on the HOMER results, the logarithmic result of reduced air pollutant emission by each scenario is illustrated in Figure 10. The second scenario is potent to reduce more greenhouse gasses and air pollutants comparing with two other scenarios throughout the project lifetime.
Emission reduction by each scenario
In summary, this study contributes to broadening current knowledge of the renewable energy potential by investigating an optimal energy system of a specific commercial building. The case study of this research is a very particular example for the cultural, technological and destination aspects.
Due to financial and social development all over the World, the need for energy resources is increasing at high speed. There are several challenges for governments to obtain a secure energy supply.
One of the important sectors of energy consumption is commercial buildings. Studies show that the share of energy consumption in the buildings is noticeable. This research considered an optimal combination of wind turbines and PV panels for an on-grid energy supply system for a real commercial building from economic and GHG emission point of view.
However it is indicated by this research that the wind energy has the least LCOE among the scenarios, the wind utilization cannot supply electricity as the reptile garden needs and this building would not be classified as NZEB if the wind is the only renewable energy source. The renewable factor in the second scenario is calculated as 66.6% which means the system would need grid electricity to supply its need for almost 33% of the lifetime. Moreover, the result shows that the least LCOE for the reptile garden as an NZEB would happen in the 3rd scenario which sells more than 428 MWh electricity to the grid.
The results also indicate that applying renewable energy supply system has a considerable impact on reducing greenhouse gasses and air pollution during the project lifetime and it can cause a reduction of 120-611 tons of CO2 in different scenarios.
COP |
Coefficient of Performance |
ECBCS |
Energy Conservation in Building and Community Systems |
EER |
Energy Efficiency Ratio |
GHG |
Greenhouse Gasses |
HAP |
Hourly Analysis Program |
HOMER |
Hybrid Optimization Model for Electric Renewables |
IEA |
International Energy Agency |
LCOE |
Levelized Cost of Electricity |
LPSP |
Loss of Power Supply Probability |
MCHP |
Micro Combined Heat and Power |
NASA |
National Aeronautics and Space Administration |
NZEB |
Net Zero Energy Building |
PV |
Photovoltaic |
SHC |
Solar Heating and Cooling |
- ,
Modelling of heat supply for natural gas pressure reduction station using geothermal energy ,International Journal of Sustainable Energy , Vol. 38 (8),pp 773-793 , 2019, https://doi.org/https://doi.org/10.1080/14786451.2019.1585434 - ,
Feasibility study and economical evaluations of geothermal heat pumps in Iran ,Geothermics , Vol. 72 ,pp 64-73 , 2018, https://doi.org/https://doi.org/10.1016/j.geothermics.2017.10.017 - IEA. World Energy Outlook 2016., https://iea.blob.core.windows.net/assets/680c05c8-1d6e-42ae-b953-68e0420d46d5/WEO2016.pdf, [Accessed 06-Mar-2023]
- ,
Decrease in CO2 emission per capita as a result of the reduction in power grid losses in Iran ,International Journal of Ambient Energy ,pp 1-11 , 2018, https://doi.org/https://doi.org/10.1080/01430750.2018.1443495 - ,
Effects of natural gas supply on macro-economics: comparative analysis ,International Journal of Ambient Energy ,pp 1-8 , 2018, https://doi.org/https://doi.org/10.1080/01430750.2018.1525582 - ,
Direct Applications of Geothermal Energy; Economic and Environmental Assessment: Meshkin-Shahr ,Iran, presented at the The 42nd Workshop on Geothermal Reservoir Engineering , 2017 - ,
Cascading uses of geothermal energy for a sustainable energy supply for Meshkinshahr City, Northwest , Vol. 79 ,pp 152-163 , 2019, https://doi.org/https://doi.org/10.1016/j.geothermics.2019.01.012 - ,
Estimation of the employment rate of Iranian solar power plants in the horizon of 2050 ,International Journal of Ambient Energy ,pp 1-6 , 2019, https://doi.org/https://doi.org/10.1080/01430750.2019.1587726 - ,
Environmental cost of energy consumption and biodiesel as a solution (case study: Iran) ,International Journal of Sustainable Energy , Vol. 38 (10),pp 966-980 , 2019, https://doi.org/https://doi.org/10.1080/14786451.2019.1609475 - ,
A life cycle multi-objective economic and environmental assessment of distributed generation in buildings ,Energy Conversion and Management , Vol. 97 ,pp 420-427 , 2015, https://doi.org/https://doi.org/10.1016/j.enconman.2015.03.048 - ,
Modeling and optimization of a hybrid system for the energy supply of a Green building ,Energy Conversion and Management , Vol. 64 ,pp 351-363 , 2012, https://doi.org/https://doi.org/10.1016/j.enconman.2012.05.017 - ,
Microcogeneration in buildings with low energy demand in load sharing application ,Energy Conversion and Management , Vol. 100 ,pp 78-89 , 2015, https://doi.org/https://doi.org/10.1016/j.enconman.2015.04.065 - ,
Comparison of the energy and environmental impact by integrating a H2 vehicle and an electric vehicle into a zero-energy building ,Energy Conversion and Management , Vol. 123 ,pp 153-173 , 2016, https://doi.org/https://doi.org/10.1016/j.enconman.2016.06.033 - , Economic and Environmental Analysis of Replacement of Natural Gas Heating System with Geothermal Heat Pump in District 11 of Tehran, presented at the the 41st Workshop on Geothermal Reservoir Engineering Stanford University, 2016
- , C. o. t. E. U. European Parliament, Directive 2010/31/EU of the European Parliament and of the Council of 19 May 2010 on the energy performance of buildings, Official Journal of the European Union, 2010
- ,
An optimization methodology to evaluate the effect size of incentives on energy-cost optimal curves, presented at the 13th conference of international building performance simulation association , 2013, August 26-28 - ,
Transient 3D: Simulation of a Flat Plate Solar Collector in a Mild Climate Condition ,International Journal of Energy Optimization and Engineering (IJEOE) , Vol. 7 (3),pp 76-96 , 2018, https://doi.org/https://doi.org/10.4018/IJEOE.2018070105 - ,
Zero Energy Building – A review of definitions and calculation methodologies ,Energy and Buildings , Vol. 43 (4),pp 971-979 , 2011, https://doi.org/https://doi.org/10.1016/j.enbuild.2010.12.022, et al. - ,
Advanced control of heat pumps for improved flexibility of Net-ZEB towards the grid ,Energy and Buildings , Vol. 69 ,pp 74-84 , 2014, https://doi.org/https://doi.org/10.1016/j.enbuild.2013.10.019 - ,
25th DAAAM International Symposium on Intelligent Manufacturing and Automation ,2014 Concept Project of Zero Energy Building, Procedia Engineering , Vol. 100 ,pp 1505-1514 , 2015, https://doi.org/https://doi.org/10.1016/j.proeng.2015.01.522 - ,
New insulation replacement in buildings’ walls and its impact on air pollution reduction in Tehran ,Intelligent Buildings International , Vol. 11 (2),pp 65-74 , 2019, https://doi.org/https://doi.org/10.1080/17508975.2017.1339586 - ,
European smart cities: The role of zero energy buildings ,Sustainable Cities and Society , Vol. 15 ,pp 86-95 , 2015, https://doi.org/https://doi.org/10.1016/j.scs.2014.12.003 - ,
Assessment of the progress towards the establishment of definitions of Nearly Zero Energy Buildings (nZEBs) in European Member States ,Journal of Building Engineering , Vol. 1 ,pp 20-32 , 2015, https://doi.org/https://doi.org/10.1016/j.jobe.2015.01.002 - ,
Economic and air pollution effects of city council legislations on renewable energy utilisation in Tehran ,International Journal of Ambient Energy , Vol. 39 (6),pp 626-631 , 2018, https://doi.org/https://doi.org/10.1080/01430750.2017.1324819 - ,
Generic model of a community-based microgrid integrating wind turbines, photovoltaics and CHP generations ,Applied Energy , Vol. 112 ,pp 1475-1482 , 2013, https://doi.org/https://doi.org/10.1016/j.apenergy.2012.12.035 - ,
Wind energy applications for Taiwan buildings: What are the challenges and strategies for small wind energy systems exploitation? ,Renewable and Sustainable Energy Reviews , Vol. 59 ,pp 39-55 , 2016, https://doi.org/https://doi.org/10.1016/j.rser.2015.12.336 - ,
Optimum residential load management strategy for real time pricing (RTP) demand response programs ,Energy Policy , Vol. 45 ,pp 671-679 , 2012, https://doi.org/https://doi.org/10.1016/j.enpol.2012.03.019 - ,
City-integrated renewable energy design for low-carbon and climate-resilient communities ,Applied Energy , Vol. 239 (1212-1225), 2019, https://doi.org/https://doi.org/10.1016/j.apenergy.2019.02.031 - ,
Modeling the Allocation and Economic Evaluation of PV Panels and Wind Turbines in Urban Areas ,Procedia Environmental Sciences , Vol. 22 ,pp 333-351 , 2014, https://doi.org/https://doi.org/10.1016/j.proenv.2014.11.032 - ,
Optimal Planning of an Off-grid Electricity Generation with Renewable Energy Resources using the HOMER Software ,International Journal of Power Electronics and Drive Systems , Vol. 6 ,pp 137-147 , 2015, https://doi.org/https://doi.org/10.11591/ijpeds.v6i1.6723 - ,
The Application of Homer Optimization Software to Investigate the Prospects of Hybrid Renewable Energy System in Rural Communities of Sokoto in Nigeria ,International Journal of Electrical and Computer Engineering , Vol. 7 ,pp 596-603 , 2017, https://doi.org/https://doi.org/10.11591/ijece.v7i2.pp596-603, 04/01 - ,
Feasibility study and energy conversion analysis of stand-alone hybrid renewable energy system ,Energy Conversion and Management , Vol. 105 ,pp 471-479 , 2015, https://doi.org/https://doi.org/10.1016/j.enconman.2015.07.051 - ,
Optimal planning of renewable energy resource for a residential house considering economic and reliability criteria ,International Journal of Electrical Power & Energy Systems , Vol. 96 ,pp 261-273 , 2018, https://doi.org/https://doi.org/10.1016/j.ijepes.2017.10.017 - ,
Techno-economic-environmental study of hybrid power supply system: A case study in Iran ,Sustainable Energy Technologies and Assessments , Vol. 25 ,pp 1-10 , 2018, https://doi.org/https://doi.org/10.1016/j.seta.2017.10.007 - , Rattlesnake., Learning Media, 2002
- Live Science - Komodo Dragon Facts, https://www.livescience.com/27402-komodo-dragons.html, [Accessed 06-Mar-2023]
- Pet Hospital PQ, https://www.pethospitalpq.com/sites/site-3953/documents/BALL%20PYTHON%20CARE.pdf, [Accessed 06-Mar-2023]
- ,
Optimal sizing method for stand-alone hybrid solar–wind system with LPSP technology by using genetic algorithm ,Solar Energy , Vol. 82 (4),pp 354-367 , 2008, https://doi.org/https://doi.org/10.1016/j.solener.2007.08.005 - ,
Computer Program for Cooling Load Estimation and Comparative Analysis with Hourly Analysis Program (HAP) Software ,International Journal of Latest Technology in Engineering, Management & Applied Science , Vol. 7 (6), 2018 - ,
A critical review of factors affecting wind turbine and solar cell system power production ,International Journal of Advanced Engineering Research and Studies , Vol. III ,pp 2249-8974 , 2014 - ,
Techno-economic study of a PV-hydrogen-battery hybrid system for off-grid power supply: Impact of performances' ageing on optimal system sizing and competitiveness ,International Journal of Hydrogen Energy , Vol. 40 (1),pp 623-632 , 2015, https://doi.org/https://doi.org/10.1016/j.ijhydene.2014.11.007, et al.