


Groundwater is a major source of fresh water in coastal regions. However, overexploitation of groundwater from a coastal aquifer can cause the natural equilibrium between freshwater and seawater to be disturbed, resulting in seawater intrusion into freshwater aquifer. Seawater intrusion has been identified as a critical issue to be addressed in coastal regions due to its irreversible effect on groundwater water quality. Research on various management alternatives to control seawater intrusion started way back in the 1960s. The transient effect of a battery of injection wells on seawater intrusion into coastal confined aquifers was analyzed by Mahesha [1] using a quasi 3-D finite element model. The injection wells were found to be effective in controlling the intrusion, and reduction of intrusion up to 60–90% was achievable under favourable conditions. The study on the performance of the injection wells in single and double series along the coast indicated a reduction of seawater intrusion through proper selection of the injection rate and spacing between the wells [2]. The subsurface barrier was found to be effective in controlling seawater intrusion under critical conditions of continual pumping of the aquifer without recharge [3]. The transient motion of the interface owing to uniform natural recharge was explored using a 1-D finite element model, and the annual reduction of interface achieved was found to be 5–6% of the initial length of intrusion [4]. Rejani et al.[5] developed a 2-D groundwater flow and transport model of the coastal basin using Visual MODFLOW package for analyzing the aquifer response to various pumping strategies. Reduction in withdrawals and injection of freshwater or treated wastewater reduced the interface movement in Chennai coastal aquifer according to the simulation conducted using MODFLOW and MT3D [6]. The simulation with a 3-D density-dependent numerical model developed with FEFLOW revealed a decreased tendency of seawater intrusion if groundwater exploitation does not reach an upper bound of pumping [7]. The effect of the subsurface barrier in controlling seawater intrusion was reported by Mohan [8]. Mahesha [9] also studied the effect of subsurface barrier on the movement of the seawater-freshwater interface in coastal aquifers for a wide range of freshwater pumping rates using a Galerkin finite-element model. The results indicated that the barrier was able to check the advancement of intrusion significantly. The results of groundwater modelling by Senthilkumar and Elango [10] predicted an increase of 0.1–0.3 m in groundwater levels in the upstream side of the river due to the effect of the subsurface barrier.
With the advent of high-speed computers, numerous computer codes capable of simulating seawater intrusion were developed. The models can be used to evaluate the response of the aquifer under various seawater intrusion control strategies [11]. Reilly and Goodman [12] presented a review on historical advancement in the quantitative analysis of seawater intrusion in coastal aquifers. Werner et al.[13] summarized the evolution and current status of seawater intrusion research in terms of seawater processes, measurement, prediction, and management. A comprehensive review of groundwater flow and solute transport models used for simulation of seawater intrusion was presented by Kumar [14].
Huyakorn et al. simulated the density-dependent seawater intrusion in coastal aquifer using a 3-D finite element model. Cau et al.[15] investigated the causes of saltwater intrusion in the Oristano plain on the west coast of Italy using a 3-D finite element model CODESA 3D. They simulated coupled flow and solute transport processes in variably saturated porous media and reported that groundwater pumping caused a significant saltwater encroachment. Misut et al.[16] used SUTRA model to investigate seawater intrusion into the groundwater system of western Long Island, New York. Sherif et al.[17] used MODFLOW and MT3D to simulate seawater intrusion in the coastal aquifer of Wadi Ham, United Arab Emirates. The effects of pumping and climate change on the extent of seawater intrusion analyzed by Mansour et al.[18] revealed that a reduction in the pumping rate would be necessary to protect fresh groundwater. Experimental and numerical studies were performed to determine the effect of the flow barrier wall, recharge well, and a combination of these to control seawater intrusion in unconfined coastal aquifer. The results showed that a combination of flow barrier and freshwater injection forced the saltwater to retreat to a greater extent compared to the measures applied separately [19]. According to Momejian et al.[20], Geospatial Quality Assessment (GQA) models and Groundwater Vulnerability Assessment (GVA) models had limited ability to delineate seawater intrusion accurately. The hydrological and economic feasibility of Aquifer Storage and Recovery (ASR) of excess desalinated water, and Managed Aquifer Recharge (MAR) using Tertiary Treated Waste Water (TTWW) to manage stressed coastal aquifers in Oman, showed MAR as a smart water governance technology to mitigate stresses on coastal aquifer systems in arid zones [21].
Many researchers linked the simulation model with the optimization model to decide optimal pumping and recharge for controlling seawater intrusion. In integration with the groundwater flow simulation model, Rejani et al.[22] developed an optimization model to decide optimal pumping schedule and cropping patterns for Balasore coastal basin, India. Groundwater flow simulation non-linear optimization methodology was demonstrated by Ganesan [23] to determine well location, optimal pumping, and injection rates for coastal aquifer facing seawater intrusion. A 3-D hydrogeological model combined with an optimization model was used to assess the strategies for controlling seawater intrusion in the Gaza strip (Palestine) coastal aquifer [24]. Christelis and Mantoglou [25] studied the pumping optimization of coastal aquifers using seawater intrusion models. The optimal pumpages to arrest the deterioration of the coastal aquifer had been derived using a linked simulation-optimization approach and response matrix approach [26]. Singh [27] also analyzed various optimization techniques like Genetic Algorithm (GA) and Artificial Neural Network (ANN) for managing seawater intrusion. A review on the combined application of simulation-optimization modelling approach for the seawater intrusion management of the coastal aquifers was presented by Singh [28].
The freshwater water supply on the east coast of India is severely affected by seawater intrusion, mainly due to overexploitation. It is predicted that the water demand along this coast would increase by 50% in 2025 [29]. Gopinath et al.[30] also reported that the severe water supply problem in eastern coastal India is caused by the seawater intrusion into aquifers due to growing industrialization, urbanization, groundwater withdrawals, and sea-level rise. Experimental studies for deciding appropriate measures for seawater intrusion control are a time-consuming and costly affair. In this context, simulation studies are essential for coastal aquifers severely affected by seawater intrusion in understanding the aquifer system’s behaviour and evaluating the aquifer’s response under various seawater intrusion control strategies.
The objective of the present study is to develop groundwater flow and solute transport models using the codes MODFLOW and MT3D to simulate seawater intrusion and evaluate the impact of various possible management strategies for controlling seawater intrusion in the multilayer coastal aquifer of Minjur in Tamil Nadu, India.
METHODS ─ GROUNDWATER FLOW AND SOLUTE TRANSPORT MODELS SETUP
Spatial and temporal simulation of seawater intrusion requires the use of numerical methods to solve the non-linear governing equations of flow and solute transport through porous media. The partial differential equation of the flow consists of the flux equation (Darcy’s law) combined with the mass balance equation of water. By combining the flux equation of the solute with its mass balance equation, the generic mass balance equation of the dissolved salt transport (advection-dispersion equation) is obtained. The numerical solution of seawater intrusion is completed by coupling and solving these two governing equations of fluid flow and solute transport simultaneously using appropriate boundary and initial conditions. The groundwater flow model – MODFLOW and solute transport model – MT3D of Processing Modflow for Windows (PMWIN) can be used for simulating seawater intrusion in space and time [31]. Effects of well, river, drains, head-dependent boundaries, recharge, and evapotranspiration on groundwater behaviour under steady and unsteady flow conditions can be simulated efficiently using PMWIN, a pre- and post-processor for MODFLOW and MT3D. Three-dimensional partial differential equation used to describe the groundwater flow in the unconfined aquifer under specified initial and boundary conditions is given by:
(1)
where: Kx, Ky are directional components of hydraulic conductivity [m/s], h– total head [m], Sy– specific yield, R– general sink/source term, t– time [s].
MT3D is a solute transport model that simulates advection, dispersion, sink/source mixing, and chemical reactions in the aquifer system [32]. It uses the hydraulic heads and other parameters obtained from MODFLOW to simulate the salt movement in the groundwater system. The partial differential equation used by MT3D is given by:
(2)
where: C is the concentration of dissolved salt [kg/m3], θ – porosity of the subsurface medium (dimensionless), t– time [s], xi– distance along the respective Cartesian coordinate axis [m], Dij– hydrodynamic dispersion tensor [m2/s], vi– seepage or linear pore water velocity [m/s], qs– volumetric flow rate per unit volume of aquifer representing fluid sources (positive) and sinks (negative) [1/s], Cs– concentration of the source or sink flux [kg/m3].
CASE STUDY: MINJUR COASTAL AQUIFER SYSTEM
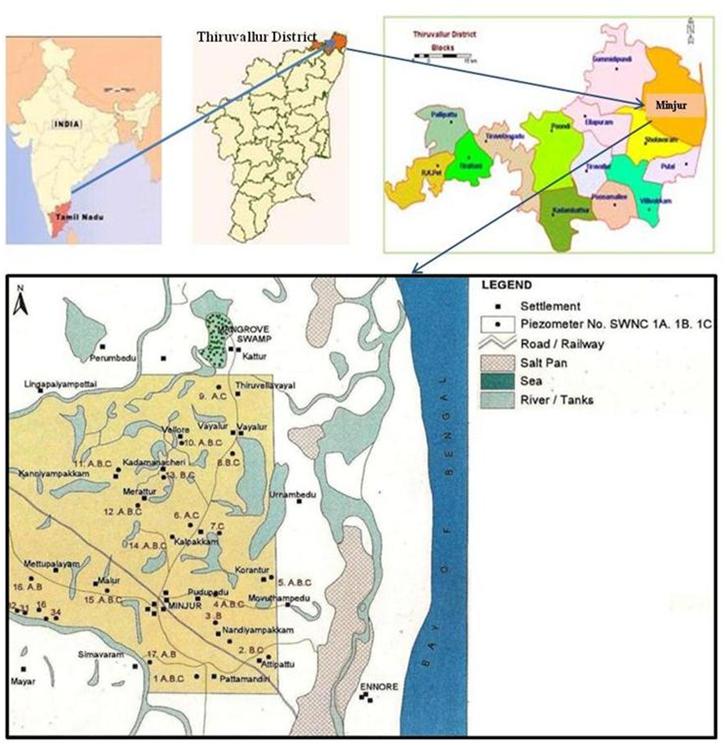
The Minjur coastal aquifer is situated in the southern state of Tamil Nadu in India. Geographically, its location is between 13015’0” and 13020’50” North Latitude and 80012’40” and 80018’05” East Longitude. The study area covers 150 km2, has a length of 10 km along the coast and a width of 15 km, and is bounded by the Bay of Bengal on the east (Figure 1). The area experiences a subtropical climate with a mean annual rainfall of 1276 mm. Nearly 62% is received during the North-East monsoon and the rest during South-West monsoon and summer seasons. The study area is covered by alluvium of two rivers consisting of sand, clay, and sandy clay. The alluvium is underlain by tertiary formations followed by Gondwana clay which rests on the basement of Archaean rocks., The aquifer system was conceptualized as a three-layer system: unconfined aquifer, aquitard, and semi-confined aquifer for the simulation. The thickness of unconfined and semi-confined aquifers ranges 18–27 m and 30–45 m, respectively. The thickness of the aquitard ranges from 3 to 8 m. Eastern part of the study area is severely affected by seawater intrusion, forcing the farmers to abandon groundwater pumping. The production wells of the Chennai Metropolitan Water Supply and Sewerage Board (CMWSSB) for supplying industrial and drinking water to Chennai city are located along the banks of the two rivers flowing through the area. The large-scale pumping performed by farmers and CMWSSB since the 1960s had resulted in the lowering of groundwater levels and seawater intrusion into freshwater aquifers [33].
Location of the study area
The model was calibrated for transient conditions of flow in the aquifer following the procedure given by Ting et al.. Pre- and post-monsoon groundwater levels observed in 13 observation wells and 18 piezometers from January 1999 to January 2005 were used for calibration. After calibration, it is inevitable to perform the quantitative assessments of the degree to which the model simulations match the observations. American Society of Civil Engineers (ASCE) [34] recommended using basic statistical measures to describe the performance of the models. In addition to correlation and correlation-based measures to assess the goodness of fit of the hydrologic model, evaluation measures like summary statistics and the absolute error should supplement the evaluation [35]. Moriasi et al. [36] suggested Nash-Sutcliffe efficiency (NSE), percent bias (PBIAS), and the ratio of the root mean square error to the standard deviation of measured data (RSR) in addition to the graphical techniques to be used in model evaluation. Even though Nash-Sutcliffe efficiency index is widely used to assess the performance of a hydrologic model, it is advisable to employ other statistical measures before arriving at a definite conclusion [37]. In this study, predictability of models was evaluated using statistical measures like Mean Error (ME), Mean Absolute Error (MAE), Mean Percent Error (MPE), Root Mean Square Error (RMSE), Coefficient of determination (R2), and Nash-Sutcliffe efficiency index (E) as suggested in the literature. After the calibration, the models were validated using the data available for the period of January 2007 – December 2008. Sensitivity analysis was performed to understand the influence of various aquifer parameters on the hydraulic head. Models were simulated by assigning a 50% increase and decrease in the calibrated values of the aquifer parameters to assess the sensitivity .
Simulation of groundwater level and salinity under various seawater intrusion control measures
After calibration and validation, models were used to simulate seawater intrusion in the study area. Excessive groundwater pumping is the major cause of seawater intrusion in the Minjur aquifer. The effect of this can be compensated to a certain extent by enhancing groundwater recharge from rainfall, regulating groundwater pumping, relocating pumping wells, regulating flow in rivers, and various combinations of these measures. During simulation, the effects of the above measures on groundwater levels, piezometric surface, groundwater salinity, and movement of freshwater–saltwater interface in both the aquifers were observed. Contour maps of groundwater level and salinity were generated at the simulation end. Predicted hydraulic heads and groundwater salinities in selected wells in both the aquifers were plotted to study temporal changes in these parameters and compare the effectiveness of various scenarios.
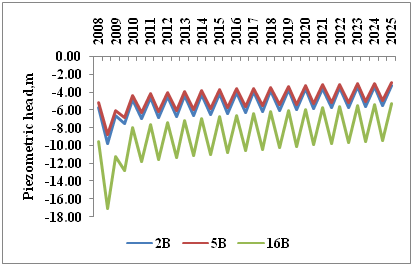
Areas under different Total Dissolved Solids (TDS) classes were determined from TDS contour maps using the irrigation water quality classification of Food and Agricultural Organization (FAO) [38]. For all practical purposes, water is considered as unsafe if Electrical Conductivity (EC) is above 3.0 decisiemens per meter (3.0 dS/m; equivalent to TDS = 2.0 kg/m3) and safe if it is below 0.70 dS/m. In this study, the contour line of EC = 3.0 dS/m (TDS = 2.0 kg/m3) was considered to describe the freshwater-seawater interface movement. Predicted values of water levels in three observation wells (2C, 4C, 15C) and three piezometers (2B, 5B, 16B) located in the severely affected southern part of the study area were used to study the temporal variations in water level under different management scenarios. Of these, 2C and 2B are located near the coast, 4C and 5B are at the central part of the area, and 15C and 16B are near the Kosasthalai River.
R ESULTS AND D ISCUSSION
Results of calibration and validation of groundwater flow and solute transport models, predictive simulation of seawater intrusion management scenarios, and evaluation of scenario analysis are presented in the following sections.
Calibration and validation results
The summary statistics of simulation of hydraulic head and groundwater salinity of semi-confined aquifer is shown in Table 1. The values of statistical measures like ME, MAE, MPE, RMSE, R2, and Nash-Sutcliffe efficiency index are within acceptable limits. The little higher value of MAE (1.04 m) and RMSE (0.83 m) for hydraulic heads can be accepted considering the wide range of observed hydraulic heads. Moriasi et al. [36] reported that RMSE is problem-dependent and is affected by the range of measured values. RMSE of 7.45 m was accepted by Massuel et al.[39] as there was a wide range in the observed piezometric heads (145 m to 632 m). The R2 value of 0.87 can be considered as a reasonable fit.
Summary statistics of hydraulic head and salinity during calibration and validation in the semi-confined aquifer
|
Process |
Parameter |
ME |
MAE |
RMSE |
MPE |
R 2 |
E |
|
Calibration |
Hydraulic head |
[m] |
[m] |
[m] |
[%] |
||
|
-0.56 |
1.04 |
0.83 |
5.80 |
0.87 |
0.81 |
||
|
Total dissolved solids |
[mg/L] |
[mg/L] |
[mg/L] |
[%] |
|||
|
63 |
210 |
323 |
1.80 |
0.89 |
0.89 |
||
|
Validation |
Hydraulic head |
[m] |
[m] |
[m] |
[%] |
||
|
0.21 |
0.86 |
0.99 |
-4.0 |
0.90 |
0.91 |
||
|
Total dissolved solids |
[mg/L] |
[mg/L] |
[mg/L] |
[%] |
|||
|
102 |
192 |
220 |
3.0 |
0.85 |
0.83 |
These results indicated that MODFLOW could be used for simulating seawater intrusion in the study area. Model performance parameters for prediction of salinity (Table 1) during calibration show that MAE = 210 mg/L and RMSE = 323 mg/L. Higher values of RMSE can be attributed to the higher ranges of observed groundwater salinities and can be considered within acceptable limits. The MPE, which removes the range effect in calculated error, was very low (1.80%). Ganesanand Thayumanavan [6] reported that MPE of 4.0% and 12.0% for prediction of hydraulic heads were within the acceptable limit. The model’s predictive ability was further reflected by the higher R2value of 0.89 and Nash-Sutcliffe efficiency index value of 0.81 (the value of this index above 0.5 is considered satisfactory). These results indicated that the model for simulation of groundwater salinity was also adequately calibrated.
The validation results also revealed that various errors are within an acceptable range. The regression analysis of hydraulic head and groundwater salinity showed R2values of 0.90 and 0.85, respectively, within acceptable limits. Similar results were obtained during calibration and validation of unconfined aquifer of the same area [40]. The calibrated values of input parameters for MODFLOW and MT3D are shown in Table 2.
Calibrated values of inputs for MODFLOW and MT3D
|
Model |
Aquifer |
Value |
|
MODFLOW |
||
|
Horizontal hydraulic conductivity |
Unconfined aquifer |
20 m/day |
|
Aquitard |
8.5×10⁻⁴ m/day |
|
|
Semiconfined aquifer |
110–150 m/day |
|
|
Storage coefficient |
Aquitard |
5×10⁻⁵ |
|
Semiconfined aquifer |
7.13×10⁻³ |
|
|
Specific yield |
Unconfined aquifer |
0.15 |
|
MT3D |
||
|
Unconfined aquifer |
250 m |
|
|
Longitudinal dispersivity |
Aquitard |
250 m |
|
Semiconfined aquifer |
250 m |
|
|
Molecular diffusion coefficient |
8.64×10⁻⁵ m2/day |
|
|
Unconfined aquifer |
0.25 |
|
|
Effective porosity |
Aquitard |
0.13 |
|
Semiconfined aquifer |
0.4 |
|
The sensitivity analysis revealed that the hydraulic head was greatly influenced by the horizontal hydraulic conductivity followed by specific yield in the unconfined aquifer. In the semi-confined aquifer, the hydraulic head was greatly affected by horizontal hydraulic conductivity and storage coefficient. These observations indicated that the seawater intrusion mainly depended on horizontal hydraulic conductivity in the study area.
Prediction of seawater intrusion under various management scenarios
In this research, a scenario describes a possible management measure that can be implemented in the future to control seawater intrusion. Various measures like artificial groundwater recharge, reduction in pumping, and relocation of pumping wells in higher recharge zone were considered as scenarios to be simulated to find their effectiveness. The position of seawater-freshwater interface and areas falling under the different TDS classes after the simulation of various seawater intrusion control measures were compared to suggest an appropriate management measure for controlling seawater intrusion in the study area. Results of numerical simulation are presented in the following sections.
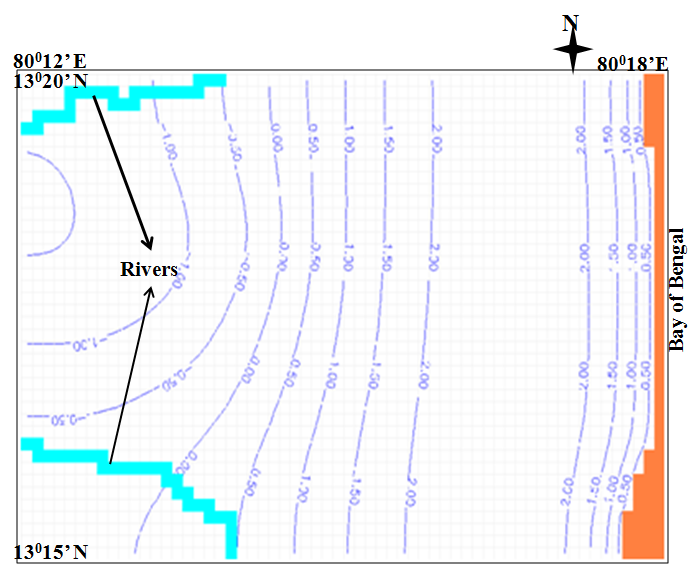
Scenario I: Recharging the aquifer using 50% of surface runoff. Based on normal rainfall received in the study area, it was estimated that surface runoff of about 245 mm is generated during the monsoon season. In this scenario, it was proposed to use 50% of the surface runoff for groundwater recharge. Under this scenario, the maximum increase in the water table would occur at a distance of about 5.5 km from the coast. A seaward hydraulic gradient would exist from this part of the area. Towards the western side of the area, the water table would remain below Mean Sea Level (MSL), and a reverse hydraulic gradient would exist (Figure 2).
Water table contour map under the scenario I
The freshwater-saltwater interface in the year 2025 under different scenarios in the unconfined aquifer is shown in Table 3. Under scenario I, the interface would be positioned at a distance of 9.25 km away from the coast compared to 10.5 km in 2008.
Interface location and area under different TDS classes in the unconfined aquifer
|
Year |
Scenario |
Interface position from coast [km] |
Areas under different TDS classes [%] |
|||
|
<0.45 kg/m3 |
0.45–2.0 kg/m3 |
>2.0 kg/m3 |
||||
|
2008 |
10.50 |
13.0 |
37.0 |
50.0 |
||
|
2025 |
I |
9.25 |
14.1 |
41.2 |
44.7 |
|
|
II |
10.00 |
15.2 |
30.3 |
54.5 |
||
|
III |
9.75 |
21.4 |
34.0 |
44.6 |
||
|
IV |
9.50 |
25.0 |
35.2 |
39.8 |
||
In the case of semi-confined aquifer, the interface would be 11.13 km away from the coast, thus moving the same towards the sea by 0.12 km compared to the year 2008 (Table 4).
Scenario II: Recharging the aquifer by increasing stage of flow in rivers. It was estimated that the average surplus flow in the Arani River was 120.91 Million Cubic Meters (MCM), and that of Kosasthalai River was about 148.33 MCM. The scenario of recharging the aquifer utilizing the surplus flow in rivers by maintaining a stage of flow of 0.5 m during monsoon and 0.25 m during non-monsoon seasons, through a series of check dams in two rivers, was considered for controlling seawater intrusion. The simulation showed that this scenario would improve the groundwater table on both sides of the rivers, whereas, in areas near the coast, the water table would be still below MSL. The groundwater quality will improve slightly near the river. The interface would move 0.5 km towards the coast compared to its position in 2008 (Table 1). Since this measure is effective in improving the groundwater level and quality near the rivers only, this alone would not be sufficient to bring significant improvement in groundwater quality in the unconfined aquifer. In the semi-confined aquifer, the freshwater-seawater interface would move towards the sea by 0.75 km by the end of the simulation period in 2025, compared to the year 2008. However, due to the lack of sufficient freshwater for flushing the salts, the above practice would result in a slight increase in salt concentration in the semi-confined aquifer, especially to the eastern side of the rivers. This is evident from Table 4, as 58.9% of the area would be having a salt concentration greater than 2.0 kg/m3 by 2025 under this scenario compared to 55% of the area in 2008. Because of this, scenarios II combined with other measures were also considered, and the simulation results are presented in the following sections.
Interface location and area under different TDS classes in the semi-confined aquifer
|
Year |
Scenario |
Interface position from coast [km] |
Areas under different TDS classes [%] |
|||
|
<0.45 kg/m3 |
0.45–2.0 kg/m3 |
>2.0 kg/m3 |
||||
|
2008 |
11.25 |
20.0 |
25.0 |
55.0 |
||
|
2025 |
I |
11.13 |
13.8 |
31.6 |
54.6 |
|
|
II |
10.50 |
15.5 |
25.6 |
58.9 |
||
|
III |
10.75 |
20.7 |
24.7 |
54.6 |
||
|
IV |
10.00 |
24.0 |
26.4 |
49.5 |
||
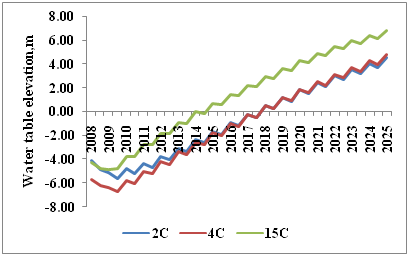
Scenario III: Relocation of wells in the unconfined aquifer combined with Scenario I and Scenario II. Scenario III consisted of a combination of measures like increasing the recharge utilizing 50% of surface runoff, raising stage in the river by 0.5 m during monsoon and 0.25 m during non-monsoon seasons, and relocating the wells from the severely affected area to the western boundary and near the rivers, in the unconfined aquifer. Simulation results indicated that there is good scope for reducing the seawater intrusion by adopting this measure. In the unconfined aquifer, the water table would reach above MSL by the year 2025. The hydraulic gradient would be reversed, which would result in the seaward movement of groundwater, as indicated by the water level in observation wells (Figure 3). The freshwater-seawater interface would be located at 9.75 km from the coast, compared to 10.5 km from the coast in 2008 (Table 3).
In the semi-confined aquifer, this scenario would raise the piezometric surface by 3.0 m near the western boundary and shift the interface by 0.5 km towards the coast compared to the same in 2008 (Table 4). Salinity in 0.6 km2 could be brought under the safe limit.
Water level in observation wells under scenario III
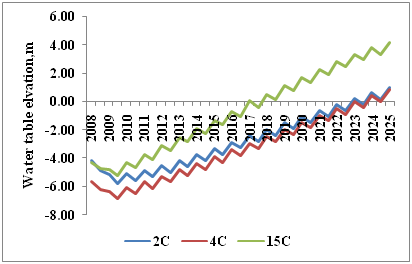
Scenario IV: Reduction in pumping by 25% from the semi-confined aquifer and increase in pumping by 25% from the unconfined aquifer, combined with scenario II. Since it is difficult to impose restrictions on the pumping rate followed by farmers, it was decided to reduce the pumping rate by 25% from the semi-confined aquifer and increase the pumping rate by 25% from the unconfined aquifer along with scenario II. Figure 4 shows the effectiveness of this measure in reversing the hydraulic gradient in the unconfined aquifer. The water table would reach above MSL by 2025, and the interface movement of 1.0 km towards the coast would be achieved. By the end of the simulation period, groundwater salinity in 10.2% (15.3 km2) of the study area could be reduced to less than 2.0 kg/m3 by adopting this measure (Table 3).
Water level in observation wells under scenario IV
This scenario would also result in improving the piezometric head by 3.0 m (Figure 5) and moving the interface by 1.5 km towards the coast in the semi-confined aquifer. Consequently, water quality would improve in an 8.25 km2 area (Table 4). There is good scope for improving water level and water quality in both the aquifers by implementing this measure which will also ensure the water supply level to that of 2008 by maintaining nearly the same total pumping level.
Piezometric head under scenario IV
Evaluation of management scenarios to control seawater intrusion
Interface position and areas under different TDS classes were determined under various scenarios at the end of the simulation period. Appropriate management strategies were suggested based on their ability to restrict the interface movement and control salt-affected areas. In the case of the unconfined aquifer, scenario IV exhibited the lowest area having TDS > 2.0 kg/m3 in the unconfined aquifer. In the case of the semi-confined aquifer also, scenario IV was found to be effective in preventing the advancement of the interface towards the landside. Scenario I would also help in restricting the advancement of the interface in the unconfined aquifer. However, the effectiveness of this scenario in reducing the affected area in the semi-confined aquifer was far behind the other scenarios.
In the semi-confined aquifer, pumping rate reduction by 25% was found effective in improving the water quality during the initial simulation. But this scenario would not bring any improvement in water quality in the unconfined aquifer. Moreover, it is very difficult to impose any restriction in pumping done by farmers immediately. It is expected that increasing abstraction from the unconfined aquifer by 25% and compensating this by the increased recharge in the unconfined aquifer would bring groundwater salinity below desirable limits. From simulation conducted in a coastal basin of Orissa, Rejani et al. [6] suggested reducing pumping by 50% from the 2nd aquifer and increase of pumping by 150% from 1st and 2nd aquifers at potential locations as a promising strategy for containing seawater intrusion. Because of this, a combination of various scenarios which would improve water level, water quality, and interface movement towards the sea in both the aquifers was considered. Among these, scenario IV, which would substantially reduce the area of TDS > 2.0 kg/m3 in both aquifers, was recommended for implementation; this may be followed by scenario III.
The simulation results showed the affected area could not be reclaimed fully by 2025, even after implementing the best scenario. This scenario combines various measures like reduction in pumping by 25% from the semi-confined aquifer, increase in pumping by 25% from the unconfined aquifer, and recharging the aquifer through an increased stage of flow in rivers. However, the simulation results could be accepted considering the severity of the seawater intrusion problem in the affected area. It may be noted that water quality deterioration due to seawater intrusion in the area started as early as the 1960s. Ganesan [23] reported that even by using the optimal aquifer recharge of 8.1 MCM/year in the confined aquifer, the interface could be shifted by 2.9 km in 24 years in the seawater-intruded coastal aquifer. It was also found that by imposing a 28% reduction in the pumping rate, the interface would move only 1.5 km in 24 years. From the results of numerical modelling of seawater intrusion, Narayan et al. [41] reported that by adopting control measures like reduction in pumping and increased recharge rates, the saltwater-freshwater interface would move about 3.5 km in 40 years in Burdekin delta irrigation area, Queensland.
Simulation results also highlighted a substantial increase in the water table in the unconfined aquifer that could be achieved by implementing scenarios I, III, and IV. In most cases, the water table would reach above MSL, and a seaward hydraulic gradient would be created by the simulation end. But, the maximum movement of the interface would be only 1.25 km under scenario I. The result is on par with the findings reported by Ganesan [23], where the interface would be shifted by 1.5 km and 2.9 km towards the coast in 24 years under two promising scenarios. This slow rate of reclamation could be attributed to the fact that salt transport in groundwater is governed not only by advection but also by dispersion and diffusion.
CONCLUSIONS
The Minjur coastal aquifer system in Tamil Nadu is seriously affected by seawater intrusion due to overexploitation of groundwater. In this study, the response of the coastal aquifers to various seawater intrusion control measures was analysed using calibrated and validated groundwater flow model MODFLOW and solute transport model MT3D. Predictability of the models was assessed after calibration and validation using statistical measures like Mean Error (ME), Mean Absolute Error (MAE), Mean Percent Error (MPE), Root Mean Square Error (RMSE), Coefficient of determination (R2), and Nash-Sutcliffe efficiency index (E). The various statistical parameters obtained during calibration and validation of hydraulic head and groundwater salinity revealed a good agreement between simulated and observed hydraulic head and salinity. Different seawater intrusion management scenarios like groundwater recharge, reduction in pumping, relocation of pumping wells in higher recharge zone, and a combination of recharge and reduced pumping were simulated using calibrated validated models. The performance of various management scenarios was evaluated considering their effectiveness in increasing groundwater level, interface movement, and changes in the areas falling under different TDS classes. Model simulation with various management scenarios showed that salinity in the unconfined aquifer could be reduced considerably by enhancing the natural recharge. The semi-confined aquifer was found to be responsive to the pumping rate. Considering the improvement in groundwater quality in both the aquifers, the scenario combining recharge of groundwater from rivers, reduction of pumping rate from the semi-confined aquifer by 25%, and increase of pumping rate from the unconfined aquifer by 25% was found to be more promising. This would shift the interface towards the coast by 1.0 km in the unconfined aquifer and 1.5 km in the semi-confined aquifer by 2025. The study indicated that once the coastal aquifer is affected by seawater intrusion, the rate of restoration is very slow. The simulation procedures used in this study can simulate the seawater intrusion in space and time and evaluate the impact of various possible management strategies for controlling it in coastal aquifers.
A CKNOWLEDGEMENTS
The authors wish to express their thanks to the officials of Groundwater Division, State Public Works Department, Department of Economics and Statistics and Department of Agriculture, Government of Tamil Nadu, for providing necessary data and assistance in field investigations. The first author wishes to acknowledge the financial support in the form of fellowship provided by the Indian Agricultural Research Institute, New Delhi.
|
E |
Nash-Sutcliffe efficiency index |
[-] |
|
|
EC |
electrical conductivity |
[dS] |
|
|
MAE |
Mean Absolute Error |
[m] or [mg/L] |
|
|
ME |
Mean Error |
[m] or [mg/L] |
|
|
MPE |
Mean Percent Error |
[%] |
|
|
R 2 |
coefficient of determination |
[-] |
|
|
RMSE |
Root Mean Square Error |
[m] or [mg/L] |
|
|
TDS |
total dissolved solids |
[kg/m3], [mg/L] |
|
|
|
|||
|
MCM |
Million Cubic Meters |
||
|
MODFLOW |
Groundwater Flow Model |
||
|
MSL |
Mean Sea Level |
||
|
MT3D |
Solute Transport Model |
||
- ,
Transient effect of battery of injection wells on seawater intrusion ,Journal of hydraulic engineering , Vol. 122 (5),pp 266-271 , 1996 - ,
Steady-state effect of freshwater injection on seawater intrusion ,Journal of irrigation and drainage Engineering , Vol. 122 (3),pp 149-154 , 1996 - ,
Subsurface seawater intrusion barrier analysis ,Journal of Hydraulic Engineering , Vol. 113 (6),pp 767-779 , 1987 - ,
Effect of natural recharge on sea water intrusion in coastal aquifers ,Journal of Hydrology , Vol. 174 (3-4),pp 211-220 , 1996 - ,
Simulation modeling for efficient groundwater management in Balasore coastal basin, India ,Water Resources Management , Vol. 22 (1),pp 23-50 , 2008 - ,
Management strategies for a seawater intruded aquifer system ,Journal of Sustainable development , Vol. 2 (1),pp 94-106 , 2009 - ,
Numerical modelling of seawater intrusion in Shenzhen (China) using a 3D density-dependent model including tidal effects ,Journal of earth system science , Vol. 122 (2),pp 451-465 , 2013 - ,
Modeling of sea water intrusion in coastal aquifers and derivation of optimal pumping strategies to control salt water intrusion ,Final Report submitted to PWD, Taramani, Chennai, India , 2003 - ,
Conceptual model for the safe withdrawal of freshwater from coastal aquifers ,Journal of Environmental Engineering , Vol. 135 (10),pp 980-988 , 2009 - ,
Modelling the impact of a subsurface barrier on groundwater flow in the lower Palar River basin, southern India ,Hydrogeology Journal , Vol. 19 (4),pp 917-928 , 2011 - ,
Optimal schemes of groundwater exploitation for prevention of seawater intrusion in the Leizhou Peninsula in southern China ,Environmental Geology , Vol. 43 (8),pp 978-985 , 2003 - ,
Quantitative analysis of saltwater-freshwater relationships in groundwater systems—a historical perspective ,Journal of Hydrology , Vol. 80 (1-2),pp 125-160 , 1985 - ,
Seawater intrusion processes, investigation and management: recent advances and future challenges ,Advances in Water Resources , Vol. 51 ,pp 3-26 , 2013 - ,
Groundwater Flow and Contaminant Transport Models: An Overview ,J. of Applied Hydrology , Vol. Vol. 3 ,pp 94-110 , 2006 - , Seawater Intrusion in the Plain of Oristano-Sardinia, Italy, 17th Salt Water Intrusion Meeting, 2002
- , A Three-Dimensional Finite-Element Model of Seawater intrusion in Western Long Island, New York (abst.), ASCE Engineering Mechanics Conference, 2002
- ,
Modeling groundwater flow and seawater intrusion in the coastal aquifer of Wadi Ham, UAE ,Water resources management , Vol. 26 (3),pp 751-774 , 2012 - ,
Modeling of seawater intrusion in a coastal aquifer of Karaburun Peninsula, western Turkey ,Environmental Earth Sciences , Vol. 76 (22),pp 775 , 2017 - ,
Analysing the combined effect of barrier wall and freshwater injection countermeasures on controlling saltwater intrusion in unconfined coastal aquifer systems ,Water Resources Management , Vol. 33 (4),pp 1265-1280 , 2019 - ,
Groundwater vulnerability modeling to assess seawater intrusion: a methodological comparison with geospatial interpolation ,Water Resources Management , Vol. 33 (3),pp 1039-1052 , 2019 - ,
Aquifer storage and recovery, and managed aquifer recharge of reclaimed water for management of coastal aquifers ,DESALINATION AND WATER TREATMENT , Vol. 176 ,pp 67-77 , 2020 - ,
Simulation-optimization modelling for sustainable groundwater management in a coastal basin of Orissa, India ,Water resources management , Vol. 23 (2),pp 235-263 , 2009 - ,
Aquifer Reclamation Design: Combined Simulation-Optimization Approach ,Journal of Sustainable Development , Vol. 3 (1),pp 172 , 2010 - ,
A simulation/optimization study to assess seawater intrusion management strategies for the Gaza Strip coastal aquifer (Palestine) ,Hydrogeology Journal , Vol. 23 (2),pp 249-264 , 2015 - ,
Pumping optimization of coastal aquifers using seawater intrusion models of variable-fidelity and evolutionary algorithms ,Water Resources Management , Vol. 33 (2),pp 555-568 , 2019 - ,
Insight into sea water intrusion due to pumping: a case study of Ernakulam coast, India ,ISH Journal of Hydraulic Engineering ,pp 1-10 , 2018 - ,
Optimization modelling for seawater intrusion management ,Journal of Hydrology , Vol. 508 ,pp 43-52 , 2014 - ,
Managing the environmental problem of seawater intrusion in coastal aquifers through simulation–optimization modeling ,Ecological Indicators , Vol. 48 ,pp 498-504 , 2015 - , Influence of Sea water ingress: a case study from east coast aquifer in India, 20thsaltwater intrusion meeting, 2008
- ,
Characterizing groundwater quality and seawater intrusion in coastal aquifers of Nagapattinam and Karaikal, South India using hydrogeochemistry and modeling techniques ,Human and Ecological Risk Assessment: An International Journal , Vol. 25 (1-2),pp 314-334 , 2019 - , , 3D-Groundwater modeling with PMWIN: a simulation system for modeling groundwater flow and transport processes, 2005
- ,
MT3D: A modular three-dimensional transport model version 1.5. Documentation and User’s Guide, SS Papadopulos and Associates ,Inc., variously paged , 1992 - Seawater-freshwater Interface Studies Along the Coast of Tamil Nadu , 2007
- ,
The ASCE task committee on definition of criteria for evaluation of watershed models of the watershed management committee irrigation and drainage division, criteria for evaluation of watershed models ,J. Irrig. Drain. Eng. ,pp 429-442 , 1993 - ,
G. McCabe Jr.(1999) ,Evaluating the use of" Goodness of Fit" measures in hydrologic and hydroclimatic model validation, Water Resources Research , Vol. 35 (1),pp 233-241 , - ,
Model evaluation guidelines for systematic quantification of accuracy in watershed simulations ,Transactions of the ASABE , Vol. 50 (3),pp 885-900 , 2007 - ,
Fitting of hydrologic models: a close look at the Nash–Sutcliffe index ,Journal of hydrologic engineering , Vol. 13 (10),pp 981-986 , 2008 - ,
Water quality for agriculture. FAO Irrigation and drainage paper 29 Rev. 1 ,Food and Agricultural Organization. Rome , Vol. 1 ,pp 74 , 1985 - , Groundwater modelling for sustainable resource management in the Musi catchment, India, Proceedings, International Congress on Modelling and Simulation, 2007
- ,
Numerical Modelling for Assessment of Seawater Intrusion ,Int. J. Earth Science Eng. , Vol. Vol.7 (No. 1),pp 164-174 , 2014 - ,
Modelling seawater intrusion in the Burdekin Delta irrigation area, North Queensland, Australia ,Agricultural water management , Vol. 89 (3),pp 217-228 , 2007