


During the last decade, the EU has seen a growing trend towards a larger share of energy from renewable sources. In 2018, the share of energy from renewable sources in gross final energy consumption reached 18%, which is more than double that in 2004 [1]. This development may be viewed as a response to the EU climate and energy framework for cutting greenhouse gas emissions (GHG). The EU aims to become climate-neutral by 2050 [2]. Twenty six EU member states, including the Baltic and the Nordic countries, supported this plan [3]. The EU policy plans outline a future where countries will have to make large and rapid cuts in their CO2 emissions. In Europe, the power sector has the highest greenhouse gas emissions [4].
In Northern Europe, the Nordic countries created a liberalized, multi-national electricity market in the 1990s. The Nordic countries as a geographical term refers to Finland, Sweden, Norway, Denmark and Iceland. Iceland does not participate in the Nordic electricity market due to its isolated location. The liberalized multi-national electricity market has brought many advantages, including more efficient market operation and increased competition [5]. The Baltic countries (i.e., the former Soviet states Estonia, Latvia and Lithuania) joined this market around a decade ago. Estonia's electricity generation is currently one of the most CO2 intensive in Europe due to the significant use of local oil shale in the country [6]. However, the Baltic countries all have good renewable energy (RE) potential, which may be used as a resource to fulfill their EU targets. It has also been framed as a possibility for less energy dependence on their neighbours [7]. While the Baltic countries gained independency from Soviet Union in 1991, they still import electricity and natural gas from Russia (and in the case of Lithuania, from Belarus). For instance, Lithuania imports a quarter of their electricity demand from Russia, see Table 1, and the Baltic countries are presently synchronized with the Russian electricity system, but their aim is to synchronize with the Nordic system [8]. The goal of the Baltic countries is to decrease the dependence on Russia.
Present situation in Finland (FI), Sweden (SE), Estonia (EE), Latvia (LV), and Lithuania (LT) in 2017 [4], [10]-[16]
| Country | FI | SE | EE | LV | LT |
|---|---|---|---|---|---|
| Population (Million) | 5.5 | 10.1 | 1.3 | 1.9 | 2.8 |
| GDP per capita (Euro per capita) | 36400 | 43430 | 14480 | 11620 | 12760 |
| Electricity consumption (TWh) | 85.2 | 136.7 | 9.4 | 7 | 12 |
| CO2 intensity of electricity generation (g CO2/kWh) | 83 | 9 | 922 | 49 | 64* |
| RES share1(%) | 44 | 61 | 27 | 58 | 55 |
| Import of electricity from Russia (TWh) | 5.04 | 0 | 0 | 0 | 3.1 |
share of renewable energy sources in power generation
The Baltic countries depend on their neighbours to provide them with energy, mainly electricity and natural gas [18]. The HVDC transmission lines EstLink1 and 2 between Estonia and Finland were built in 2006 and 2014 [19], and Estonian net import from Finland was 3.7 TWh in 2019. Lithuania has been connected to Sweden since 2015 [20]. Thus, it is possible that decisions regarding energy policy in the Nordic countries can affect economic and energy security factors in the Baltic countries. Thus, improving the trade balance of energy commodities with competitive domestic resources is an issue which should be considered also from the point of view of supporting national economy.
So far, less attention has been paid to the long-term European transition to carbon neutral electricity systems and, as part of that, the role of Nordic countries' policies on the Baltic countries. Several policies to decrease CO2 emissions, which could have an impact on energy transition in the Baltic countries could be imposed in the Nordic countries. Here, we focus on the effect of phasing out nuclear power together with ambitious transition to carbon neutral electricity systems. In Sweden, there is an ongoing debate about the future of nuclear power generation [21] due to, among other things, issues of health, the risk for accidents, the profitability of old nuclear reactors and nuclear waste disposal [22].
This paper investigates the effect on the Baltic countries from two policy decisions that may be present in a future European low carbon electricity system: (i) to phase out nuclear power in Sweden and (ii) to significantly increase the transmission capacity between the Nordic and Baltic countries. The study focuses on the effect on electricity prices and cross-border trade. Cross-border trade is further analysed to determine whether trade flows between the Baltics and their neighbours are balanced, or if there is a large net import/export. Findings are analysed and discussed in light of the electricity dependence of the Baltic countries on their neighbours, as well as the dependence of these small countries on policy decisions made in their significantly larger neighbouring countries of the joint electricity market. As the Baltic countries are dependent on their neighbours, it may be expected that these policies would bring about challenges for these countries. However, we show in this paper that there would be opportunities for these countries.
The overall structure of the study takes the form of six main chapters. After this introduction, literature review is presented. Then the materials and methods of this work are presented, followed by results, discussion and conclusion.
Several prior studies have surveyed aspects of energy transition. Blumberga et al. [23] applied a system dynamic model that took into account the cost of the capacity mix until 2050 in Baltic region. They found that by 2050, electricity imports would decrease due to the use of renewable energy sources. Bompard et al. [18] carried out investigations to assess electricity independence in the Baltic region in 2020 and 2030, showing that planned capacities are adequate to meet electricity demand. However, additional grid investment is needed to provide the security of supply. Helistö et al. [24] examined the role of thermal power in the presence of highly variable renewable energy generation in the Nordic-Baltic countries, Poland and Germany utilizing the Balmorel and WILMAR models. They demonstrated that the level of energy system flexibility and the share of different generation technologies affect electricity prices. CO2 emissions dramatically decrease in all their scenarios. Ramp rates and generation mix are affected by the share of renewable technologies. Lund et al. [25] analysed scenarios for a zero-emission transition in the Nordic-Baltic region, providing different scenarios using the Balmorel energy system model to assess the transition with respect to different technical, economic, regulatory and policy issues. They showed that cost minimization leads to a Baltic power sector dominated by renewables. They argue that policy actions are needed for the social side of this transition, such as social acceptance of wind power construction. To determine the effect of carbon price on energy security in Finland and the Baltic countries, Galinis et al. [26] studied two price paths by the Finnish-Baltic Energy Model (FIBEM). They showed that in both scenarios, the energy security level in the context of energy transition is not affected by the carbon price path. Chen et al. [27] used the energy model Balmorel to examine economic impacts of cross-border transmission in Northwestern Europe. Optimal transmission capacity is compared with the current and planned capacities. They showed that with transmission expansion total system cost is decreased. Moreover, more wind power is installed, resulting in less total carbon dioxide emissions. However, they found that benefits distributed asymmetrically among regions and this may be a barrier to increase power exchange cooperation. Streimikiene [28] applied MCDM tool and energy transition and energy poverty indicators to compare the Baltic states. It is found that Latvia is the best performing country according to the examined indicators. Jåstad et al. [29] studied the use of woody biomass in heat and power sector in Northern Europe by applying Balmorel. They demonstrated that increased use of woody biomass results in lower fossil emissions and transition to low carbon energy system would be more costly if biomass is excluded from the power and heat sector.
There are several previous studies that have focused on the effect of one country's decisions within the power sector on neighbouring regions. Kittel et al. [30] investigated the impacts of phasing out coal in Germany on the Central European electricity market using a dynamic electricity model. Their results indicate that this policy in Germany has a significant impact on the decarbonization effort and electricity trade in central Europe. Farsaei et al. [31] presented short and medium term scenarios regarding replacing hard coal with biomass in Finland before year 2030 due to recent Finnish legislation, along with restricting nuclear power in Sweden, showing that this policy will affect prices and CO2 emissions in the Baltic countries. Zakeri et al. [32] used the Enerallt model to analyse the effect of Germany's transition to variable renewable energy sources on the Nordic power market in terms of social welfare. They found that the energy transition in Germany increases the electricity prices in the Nordic region. Although the increase in the electricity prices decreases the consumers' surplus, social welfare will improve in the Nordic countries as producers' surplus increases due to market couplings with Germany. However, this improved social welfare is not evenly distributed in the Nordic countries. Swedish electricity consumers will lose the most among the Nordic consumers while Norwegian hydropower producers achieve the highest economic gain among producers. Glomsrød et al. [33] have demonstrated that the nuclear phase-out scenarios in Germany and Switzerland is likely to have a minor effect on electricity prices in Europe.
Previous studies focusing on the Baltic electricity system analysed the changes in local issues such as investment cost, capacity mix, cross-border transmission on economic aspects and security of supply in these countries under carbon neutral electricity system. This study investigates the possible impacts on the Baltic countries from non-local policies. Compared to [23] this study examines the expected effect of transition to carbon neutral electricity system on power import and export. of individual countries. [27], [29] considers a great amount of fossil oil shale in Estonia for 2050, while the present research studies the transition to a carbon neutral electricity system.
Studies in [30]-[33] all investigate similar policy decisions and their effect on neighbouring countries. However, they come to different conclusions regarding the magnitude of the effect that the policy decision in one country may have on its neighbours. Compared to Farsaei et al., current research not only analyses different policies, but also the electricity system cost and trade revenues have been computed to provide the effect of international policies on electricity trade in the Baltic countries.
In this paper, two models are employed: the greenfield investment model (REX) and the dispatch model (Enerallt). Four low-carbon electricity system scenarios (see Table 2), which differ in terms of the existence of nuclear power in Sweden and the level of transmission expansion, are explored.
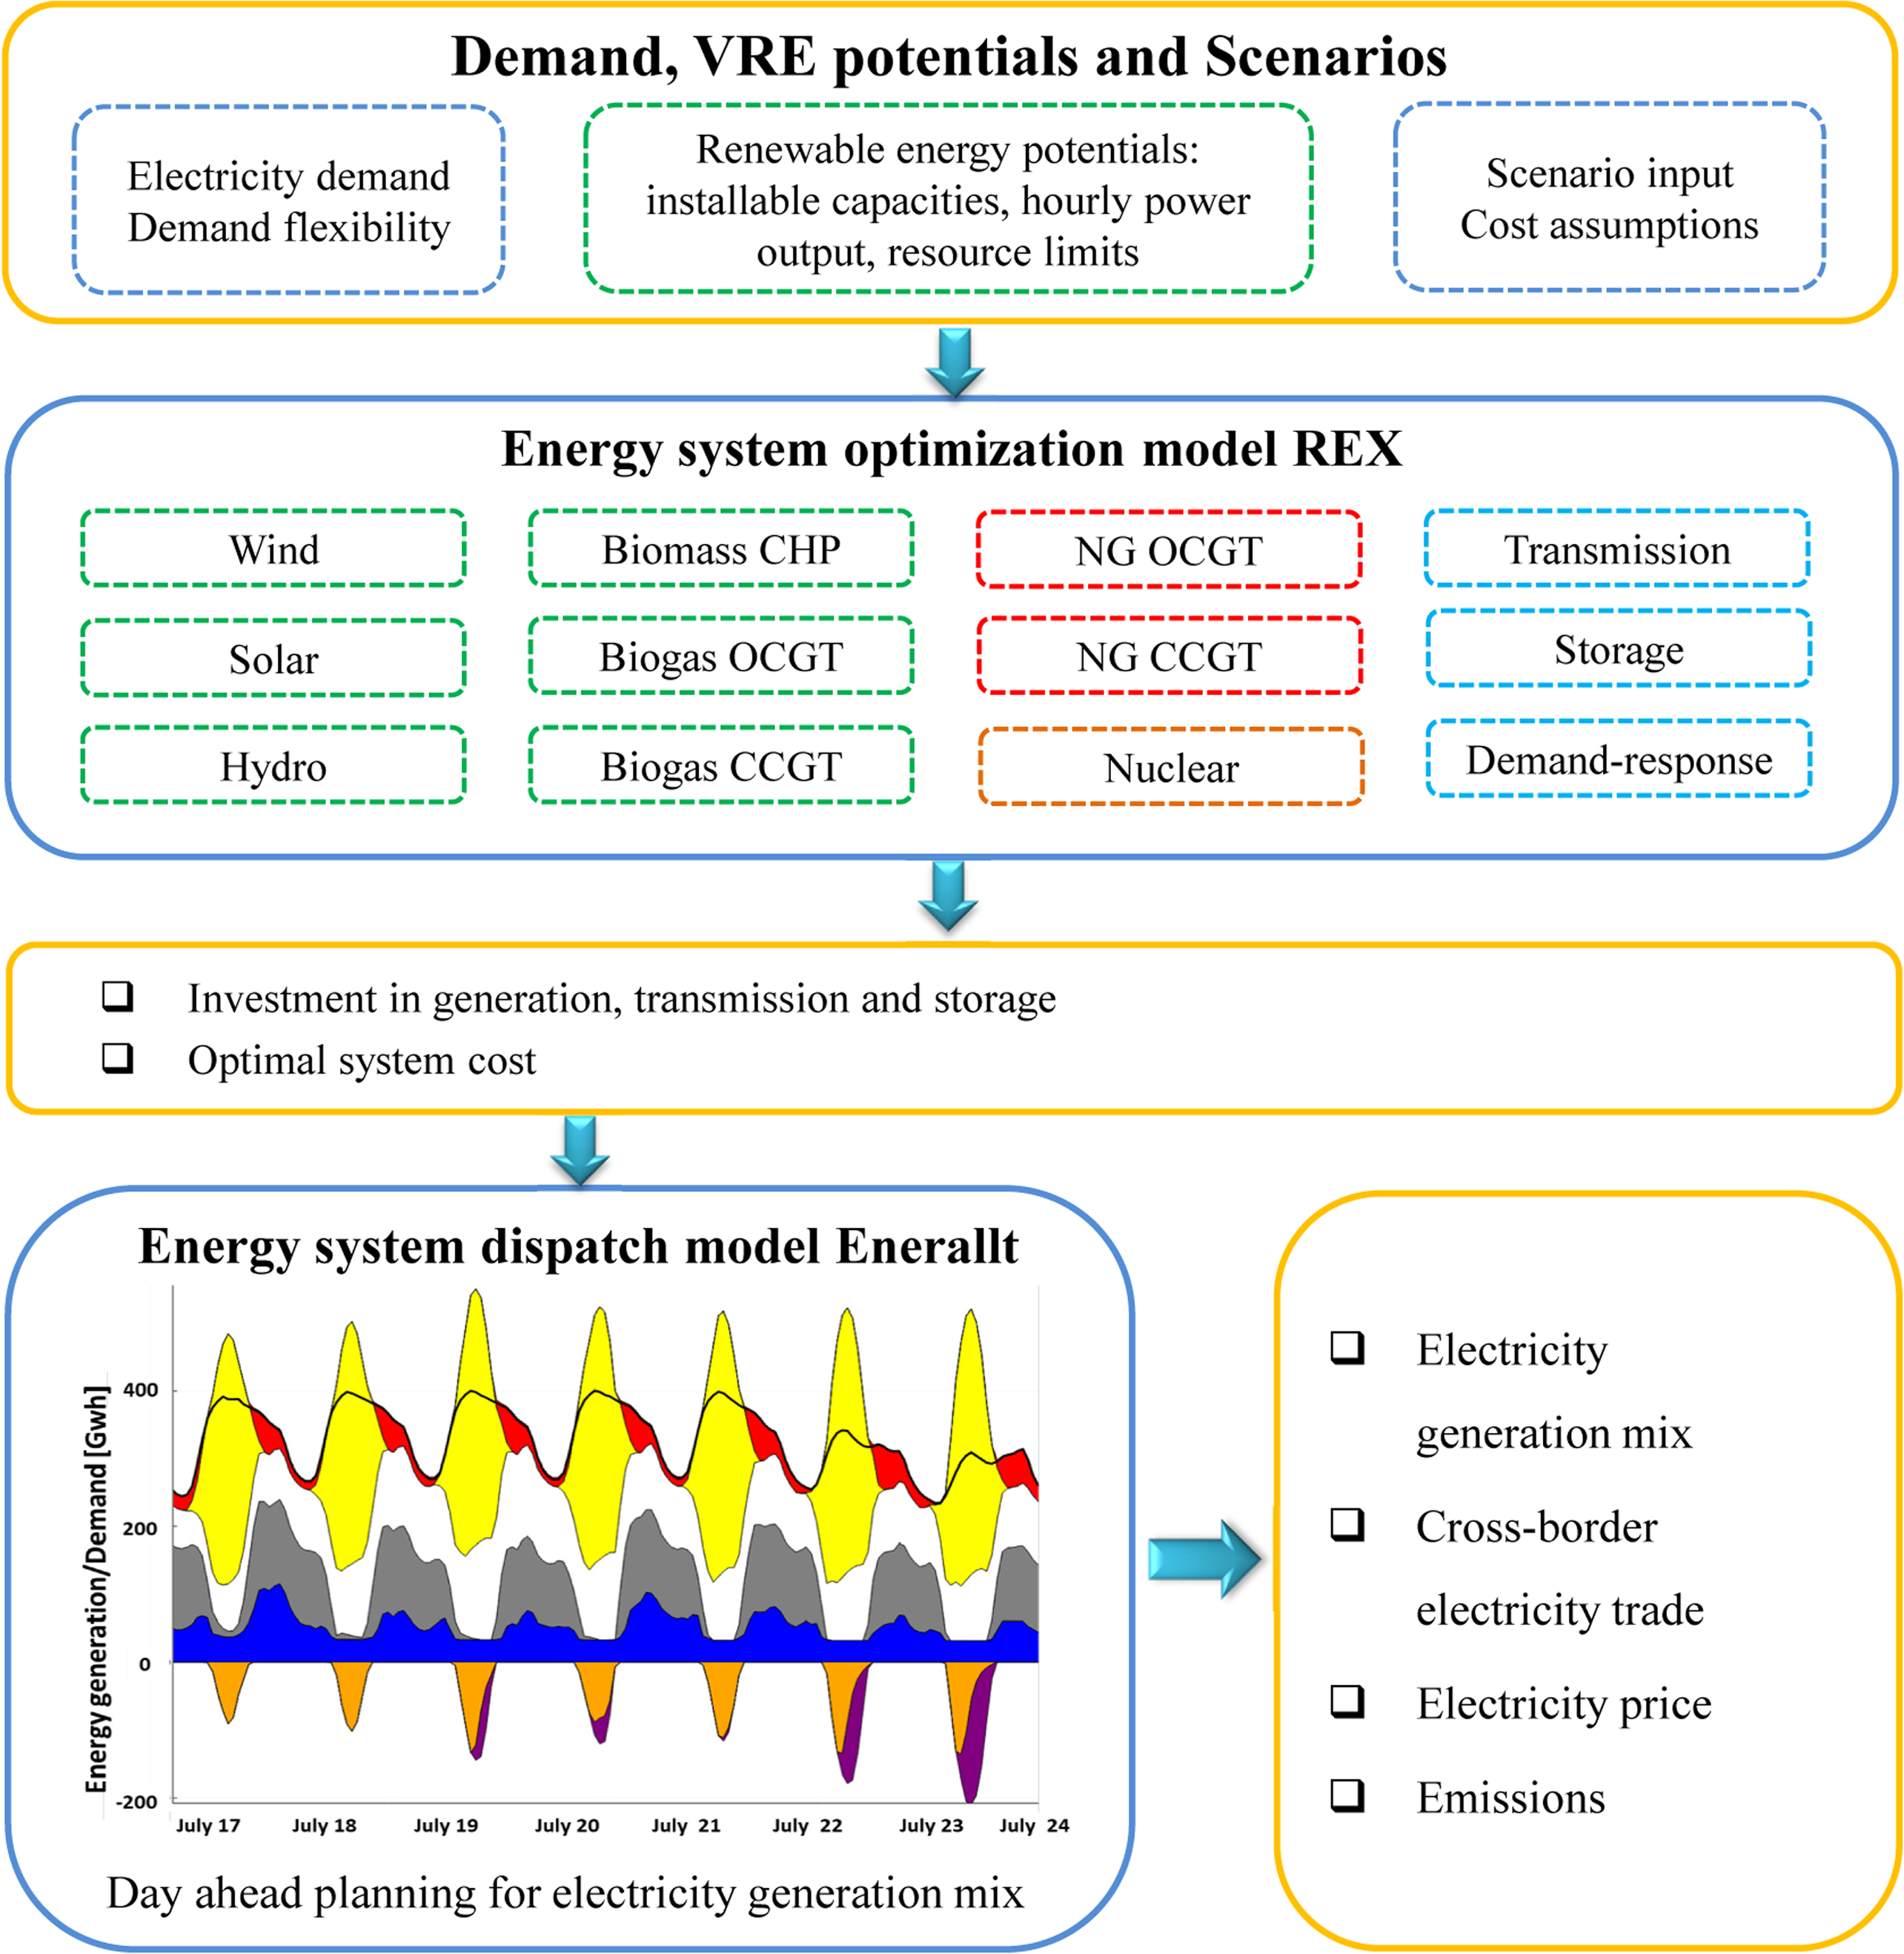
Figure 1 provides an overview of the methods used in this paper.
The REX model [34] is a greenfield optimization model for capacity investment and dispatch with respect to electricity generation, transmission, storage and demand response. It seeks at minimum cost portfolio for the future electricity system with an overnight investment approach. The objective of the model is to minimize the total annual electricity system costs, given the constraints of meeting electricity demand, renewable energy resource potentials and a CO2 emission cap. The investment options for generation technologies, transmission and storage capacity are shown in Figure 1. For more details regarding the model, please refer to reference [34].
In this study, we model a future interconnected European electricity system for the year 2050 using an hourly time resolution with a CO2 emission cap of 10 g/kWh, roughly equivalent to a 98% reduction in CO2 emissions for the European electricity sector, as compared with the emissions in 1990. Since the study focuses on the northern part of Europe, we also provide a more detailed spatial resolution for this region. We assume all the regions are interconnected with high-voltage direct current (HVDC) transmission grids. The approximation is made based on the fact that many of the international connections are already controllable point-to-point HVDC connections and this trend is likely to continue in the future [35]. In addition, this assumption is consistent with the fact that the cross-border connections are treated with Net Transfer Capacities (NTCs) in market clearing process for many countries [36]. For more detailed assumptions see reference [34]. For the costs of different technologies, see reference [37].
Methods overview. CHP: Combined heat and power. OCGT: Open cycle gas turbine. CCGT: Combined cycle gas turbine. NG: Natural gas
In this study, a MATLAB-based linear programming model (Enerallt) is used to model the power market with an hourly resolution. Modelled region in this study consists of Sweden (SE), Finland (FI), Estonia (EE), Latvia (LV) and Lithuania (LT). Moreover, Sweden is modelled as one bidding area. Regions (bidding areas) that are interconnected with modelled regions are considered as external regions that are able to exchange electricity with the modelled regions depending on the marginal price of electricity and net transfer capacity. External regions include Norway (NO1, NO2, NO3, NO4, NO5), Denmark (DK1, DK2), Germany (DE) and Poland (PL). Due to data availability, electricity exchange with Russia and Belarus is assumed to be fixed at 2018 level. Generation mix in modelled regions is modelled as technology- specific. Included technologies are presented in the Appendix Table A. 1-Table A. 3. Economic data for different technologies are based on costs presented in [34], [35], [38]-[41] (Table A. 7). The objective function and constraints are presented in eqs. (1)–(8). The objective function (1) is to minimize short-term operation costs in the power sector (and in the district heating sector):
(1)
(2)
(3)
(4)
(5)
(6)
(7)
(8)
In (1) pij,t represents the power supply of technology i in bidding area j, pijk,t is the power supply of technology i in bidding area j that is exported to bidding area k and cij,t is the short-term marginal cost of production for technology i in bidding area j. Moreover, in eq. (1) hijn,t represents the heat supply of technology i in bidding area j in district heating network n, cij,t, is the short-term marginal cost of heat conversion of technology i in bidding area j. In eq. (2) dk,t is the electricity demand in bidding area k. Moreover, in eq. (2) hikn,t/ηi is the electricity demand of heat conversion technology i that is consumed in heat conversion process (e.g. heat pump). In eq. (3) NTCjk,t is the net transmission capacity between bidding areas j and k. In eq. (4) Pij,t is the available electricity generation capacity for the technology i in bidding area j. In eq. (5) rij is the ramping factor. In eq. (6) qkn,t is the heat demand in the district heating network n in bidding area k. Moreover, in eq. (6) heat supply of CHP technology i in bidding area k is coupled to the power supply pi,t by heat-to-power ratio θi,t. In eq. (7) Hikn,t is the available heat conversion capacity for the technology i in district heating network n in bidding area k. In the equations, t is the hour index. A more detailed description of the model (including description of hydropower simulation) is presented in references [31], [42]. Moreover, validation of the model is presented in [42].
In this study, the REX and Enerallt models are combined by utilising the optimal capacity scenarios of REX as input to Enerallt. The REX scenarios are based on the conceptual framework proposed by Kan et al. [34]. Four different scenarios are analysed (Table 2). Nuclear power has been the subject of a long-running debate in Sweden [43]-[45]. Moreover, transmission expansion by 2050 may impact the results. Thus, these scenarios cover two hypotheses. In the first scenario (S1), nuclear power is removed from the electricity mix in Sweden, while transmission lines are fixed. In second scenario (S2), Sweden maintains the present amount of nuclear power and transmission lines are fixed. In the third scenario (S3), transmission lines are expanded and there is no nuclear power in Sweden. In the last scenario (S4), transmission lines are expanded and Sweden maintains nuclear power. Fixed transmission is the actual transmission capacity in 2014 and transmission expansion for 2050 comes from the REX model. The transmission capacities in the two variants are given in Appendix Table A. 4- Table A. 6.
Basic features of the scenarios studied (Scenario 1 (S1), Scenario 2 (S2), Scenario3 (S3) and Scenario 4 (S4))
No. |
Scenario description |
|
|---|---|---|
Sweden nuclear power |
transmission |
|
| Scenario 1 (S1) | - | fixed transmission (2014) |
| Scenario 2 (S2) | ✓ | fixed transmission (2014) |
| Scenario 3 (S3) | - | transmission is expanded |
| Scenario 4 (S4) | ✓ | transmission is expanded |
The Enerallt model input, which comes from the REX model and includes capacity mix per country /region, is presented in the appendix (see Table A. 1-Table A. 3). We selected Finland, Sweden and the Baltic countries, for modelling at a country level. The Baltic countries are the target countries for this study, while Finland was included owing to its strong connection with Estonia and being a large producer and consumer, and Sweden was modelled because of the scenarios assessing the nuclear power decisions being made in the country.
Each of the above scenarios in Table 2 provides different electricity system costs. The cost components for the i country are provided in the following equation:
(9)
where Ci is the total annual electricity system cost, Ii is the annualized investment cost. The annualized investment cost is computed by considering a 5% discount rate. Since the transmission line capacities are symmetric it is assumed that transmission line investment costs are shared equally between bordering countries. Fi is the fixed operation and maintenance costs (O&M cost). Vi is the variable cost which includes the variable O&M cost and fuel cost. With regard to CHP production, fuel costs are allocated to heat and electricity using energy method and only fuel use in CHP electricity production is included in electricity system costs. In equation (9), Ei is the exchange cost that is the cost of importing electricity minus the revenue from exporting electricity. Ri is the congestion income:
(10)
where i and j are the countries trading electricity through transmission lines in hour t. Pi,t − Pj,t describes the area price difference between country i and country j. Qij,t − Qji,t is the commercial flow between two countries. Eq. (10) comes from the agreement between the Nordic TSOs that congestion income is shared in equal proportions [46]. Moreover, since transmission line capacities are symmetric between country i and country j [34], it is also assumed that investment costs for transmission line capacities are shared equally between country i and country j.
In order to compare the electricity system cost between countries, average cost is computed as follows:
(11)
where Di is the demand for the country i.
The economic input data is provided by Kan et al. [34]. Total investment and fixed O&M costs are estimated based on the generation capacity and transmission line capacity data from REX model [34] (Table A. 1-Table A. 6) and technology-based investment and fixed O&M costs presented in [35], [38]-[41] (Table A. 7). Variable costs are estimated based on the electricity production data from the Enerallt model and fuel price and technology-based variable O&M cost presented in [34]. For CHP, the energy method is used to allocate costs for heat and electricity. However, only the electricity part is included. Exchange cost and congestion income come from the Enerallt model. In the scenarios of the Enerallt model, carbon dioxide emission trading price was assumed 30 €/ton CO2. However, there was practically no fossil electricity generation.
In this section selected metrics are used to analyse electricity dependence in the Baltic countries. Metrics include electricity supply mix and electricity trade to analyse the security of supply and CO2 intensity, as their improvement contributes to reducing electricity dependence. This topic can be treated under three headings: Effects on the electricity supply mix, impacts on electricity prices and trade and impacts on CO2 emissions. In each section, the effect of policies regarding nuclear power and transmission expansion is studied.
Figure 2 shows electricity production in different scenarios. Electricity production data from 2017 is also shown to provide a comparison with the current situation [12]. Data for current situation of Estonia comes from [47].
Figure 2 shows that transmission expansion would affect electricity production significantly, causing the region to become more dependent on wind power. This level of dependency is less significant in Finland, as nuclear power capacity is considered constant. It is notable that in S3 and S4, no investment is made in solar PV, natural gas and biogas generators. Wind power production especially in the Baltic countries increases income from the electricity trade. Other policies in neighboring countries may affect the optimal capacity mix, which derives from the REX model (see Appendix Table A. 1-Table A. 3).
Electricity production in Lithuania increases significantly in all four scenarios compared to 2017. The electricity generation in Lithuania was 4.2 TWh in 2017. This amount is 12 TWh in S1 and S2, 27 TWh in S3 and 18 TWh in S4.
Selected countries' electricity production in the scenarios studied. The situation in 2017 is presented for comparison. Electricity demand does not change between scenarios
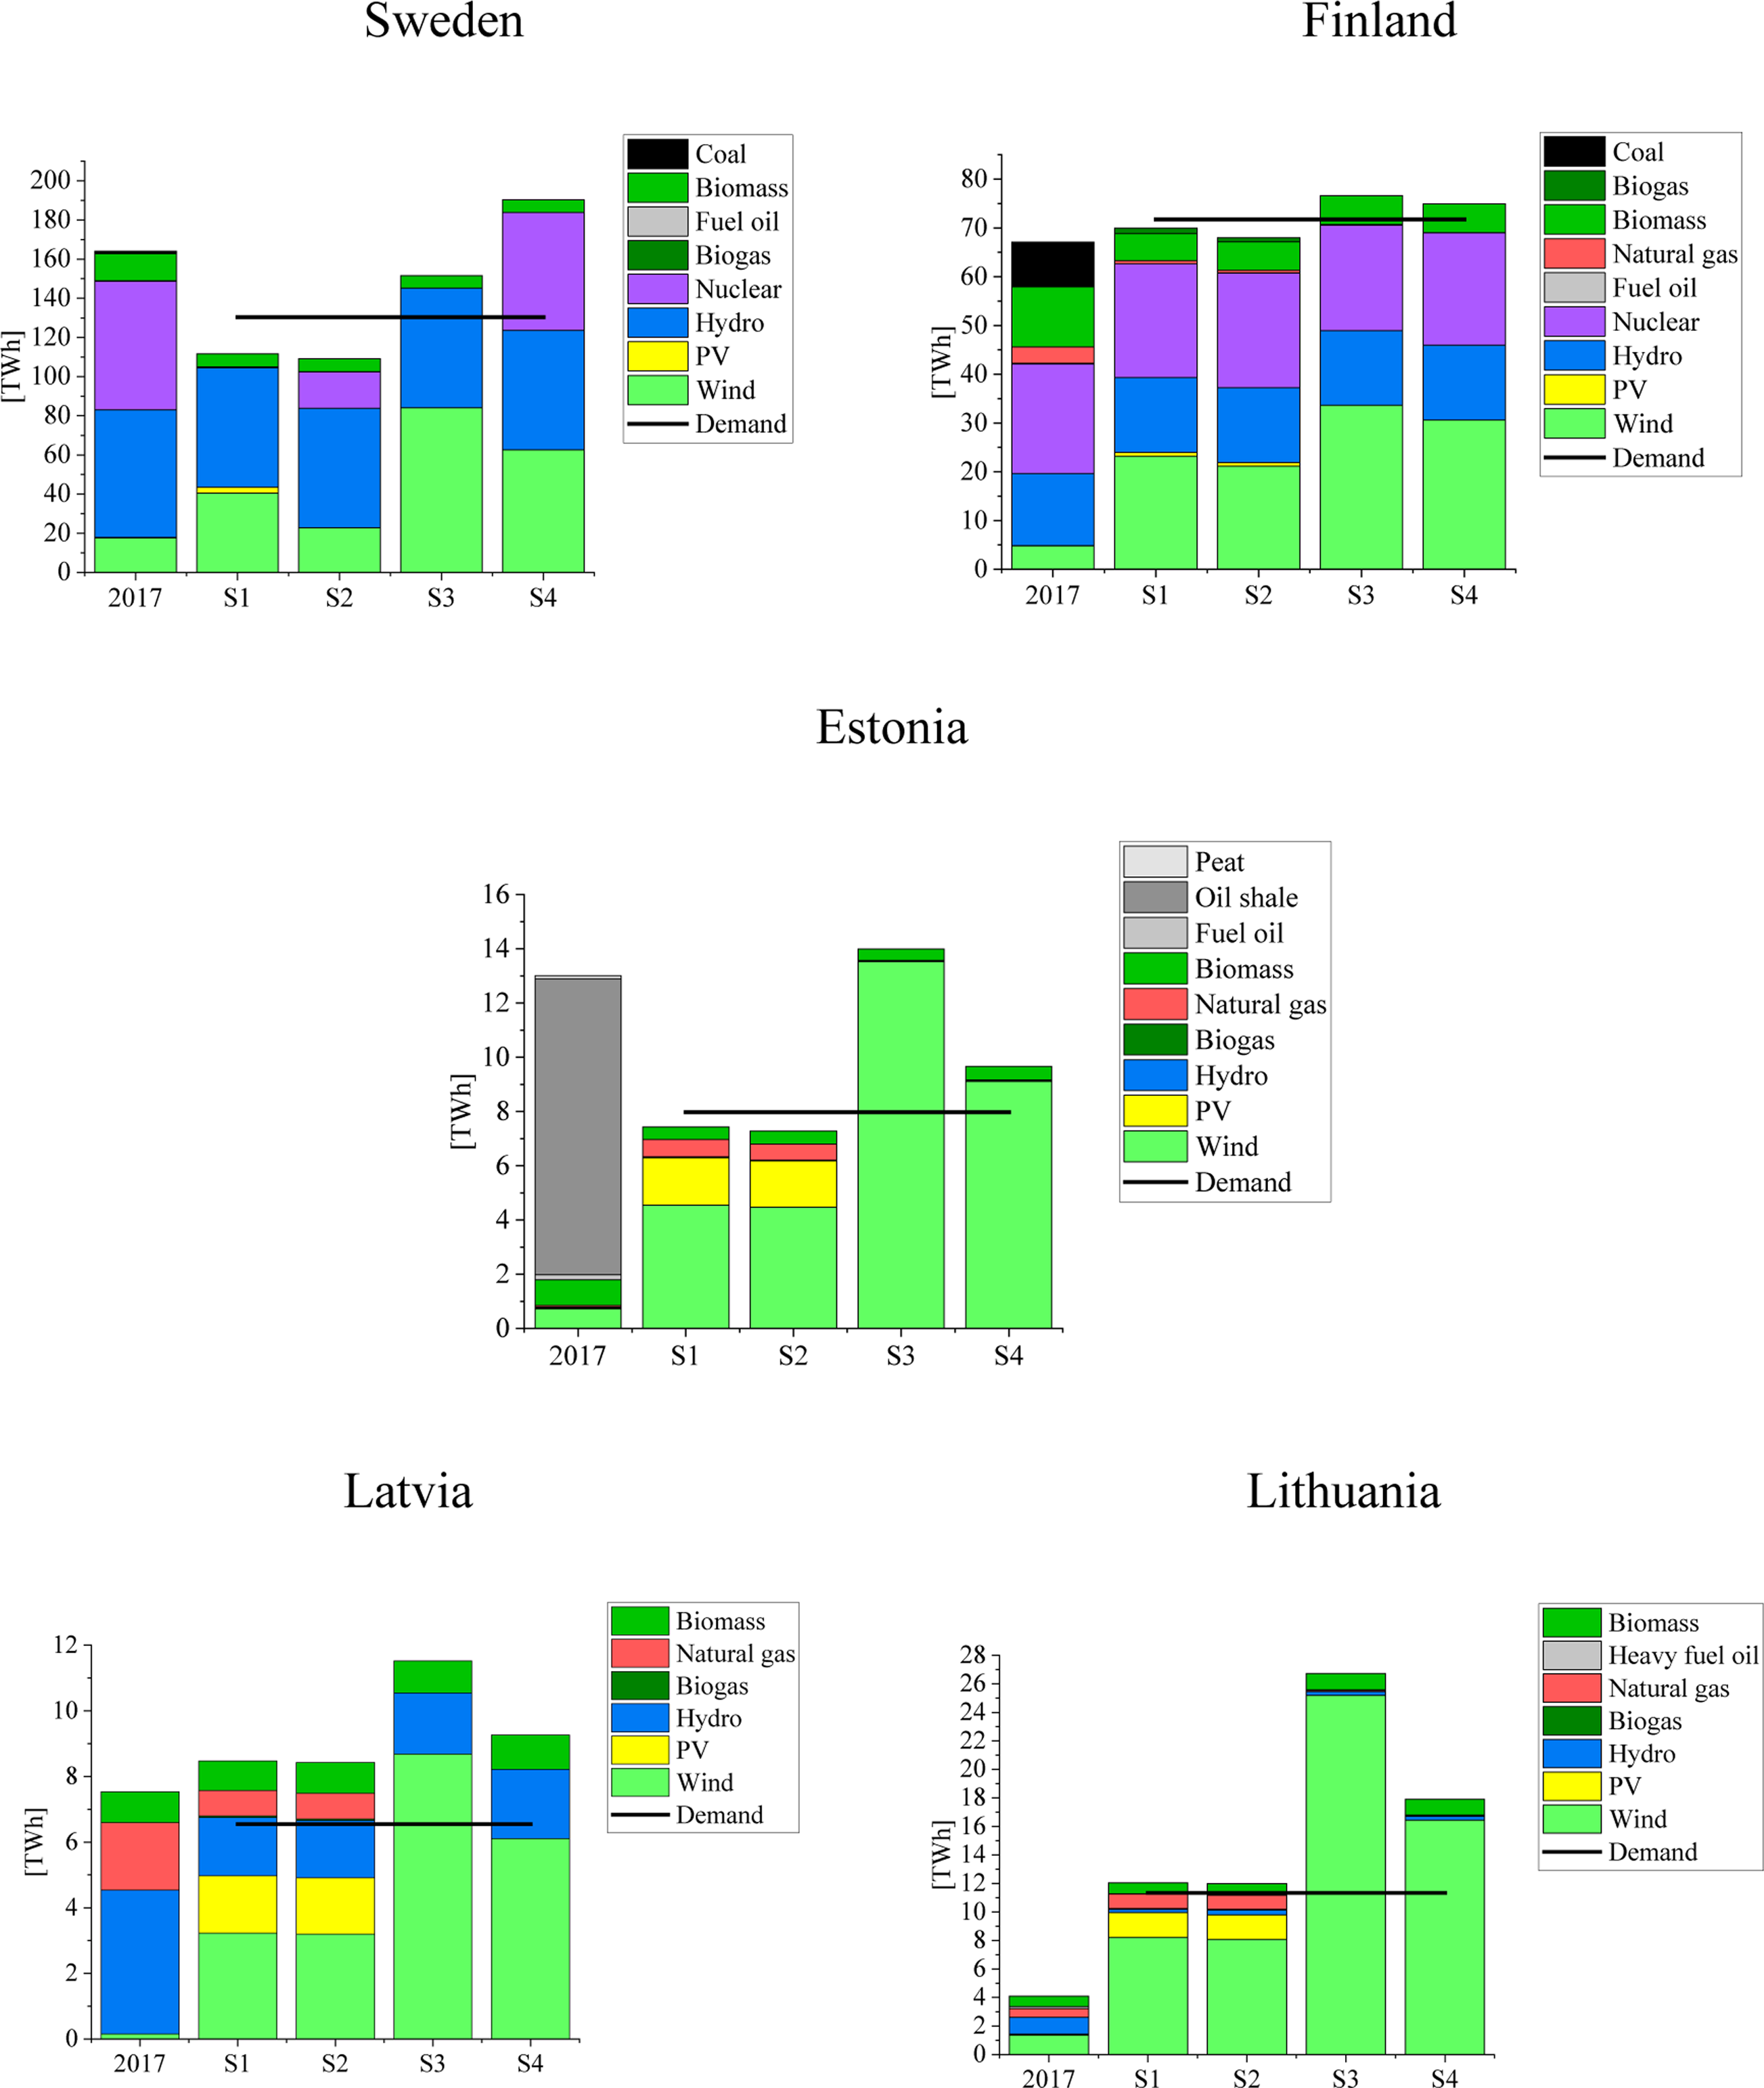
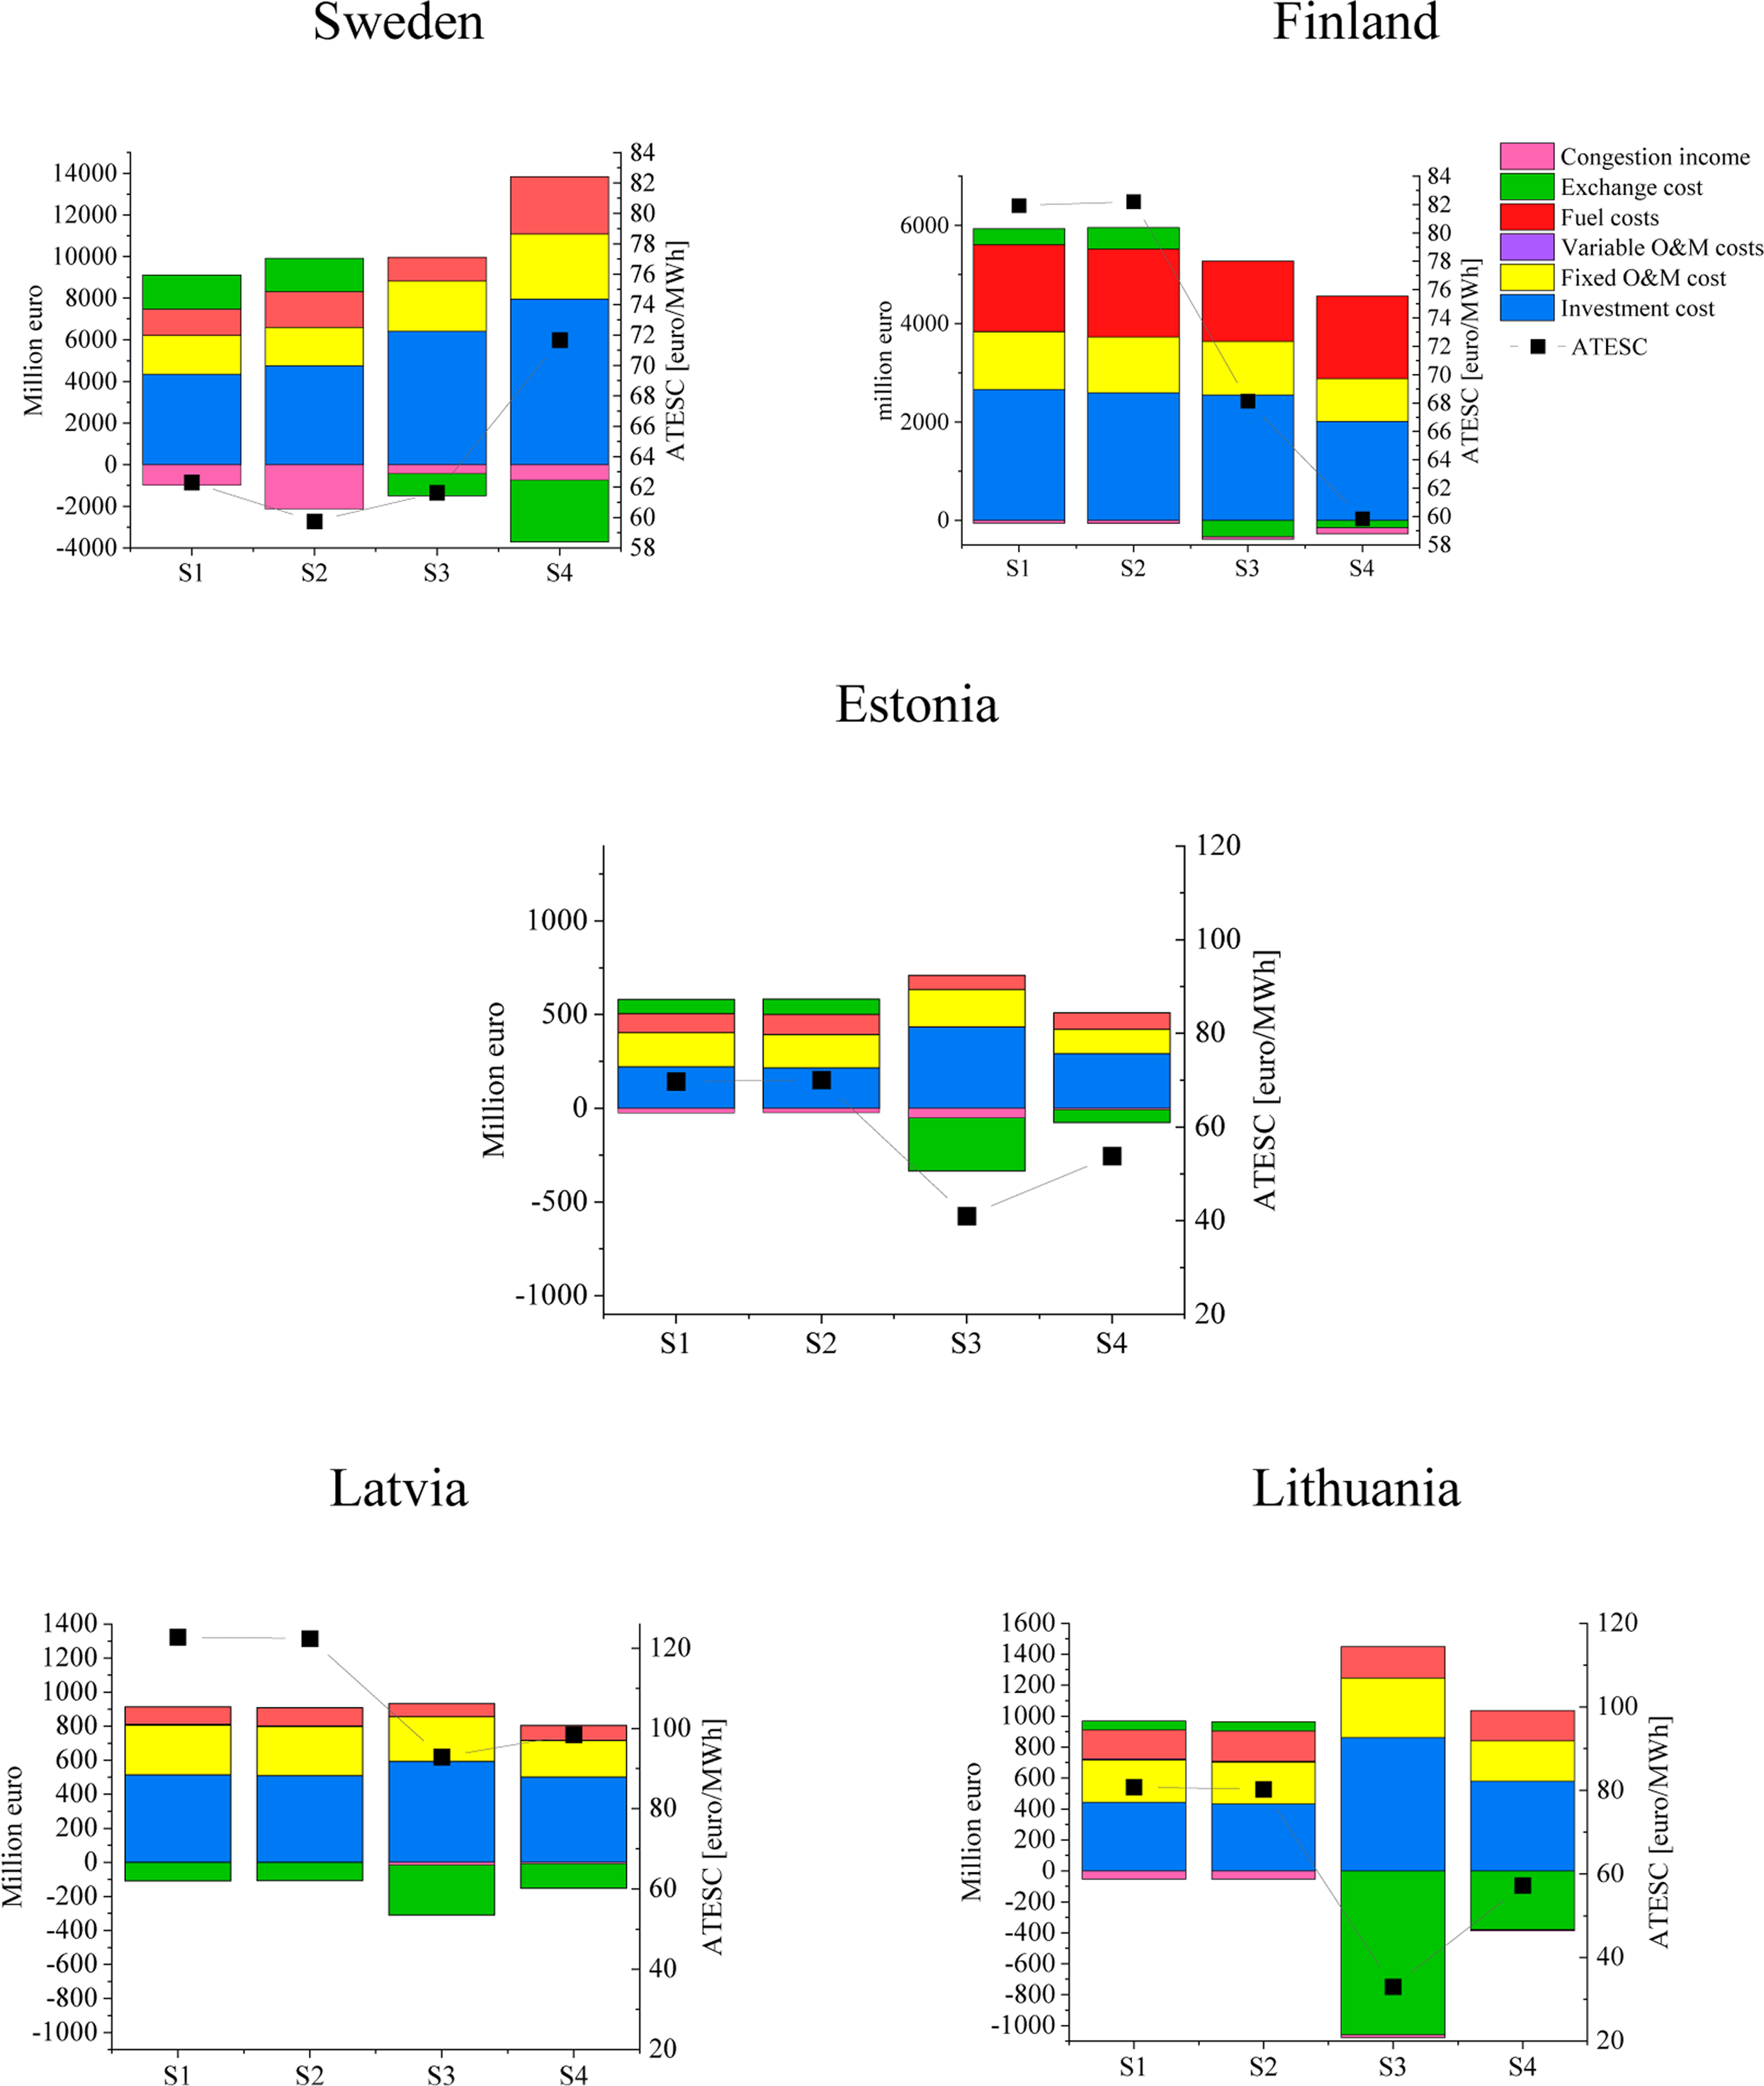
Figure 3 presents detailed itemization of costs in different scenarios for the studied countries. Total system costs include exchange costs and congestion income. Average electricity system cost for the studied five countries is in S1 417 €/MWh, in S2 415 €/MWh, in S3 297 €/MWh and in S4 341 €/MWh. Thus, transmission expansion and phasing out nuclear power in Sweden cause the lowest total system costs for the whole region considered here. For the Baltic countries and Finland, the transmission expansion scenarios entail less costs. For Sweden, cost decreases through transmission expansion while nuclear power is phased out. However, for Sweden the highest cost occurs in S4, where a significant investment cost is needed to provide a huge amount of nuclear and wind capacity.
Electricity system cost components in selected countries. (ATESC is average total electricity system cost)†
The impacts of these different scenarios on electricity prices are presented in Figure 4. As shown in Figure 4, in S1 and S2, where transmission is fixed, no significant increase in prices was detected. By expanding the transmission line connection in the Nordic-Baltic electricity market and Poland, the scenario with nuclear power in Sweden (S4) has lower electricity prices than does the case where nuclear power in Sweden is decommissioned (S3). This decrease is 6%, 7% and 8% in Estonia, Latvia and Lithuania respectively. In transmission expansion scenarios (S3 and S4), Estonia has the lowest electricity prices (67 €/MWh in S3 and 63 €/MWh in S4), while Lithuania has the highest (74 €/MWh in S3 and 68 €/MWh in S4). In these scenarios, Lithuanian prices are even higher than Sweden (72 €/MWh in S3 and 66 €/MWh in S4) and Finland (72 €/MWh in S3 and 64 €/MWh in S4).
Unlike the Baltic countries, Sweden and Finland have the lowest prices in S4. This can be due to the large number of wind power installations in all countries and nuclear power in Sweden, which affect electricity price decreases in Finland and Sweden compared to the scenarios where transmission is fixed. In S4, maintaining the existing amount of nuclear power brings an opportunity for Sweden to obtain more income from exporting electricity.
Demand-weighted average prices according to the Enerallt model. Situation in 2017 is presented for comparison
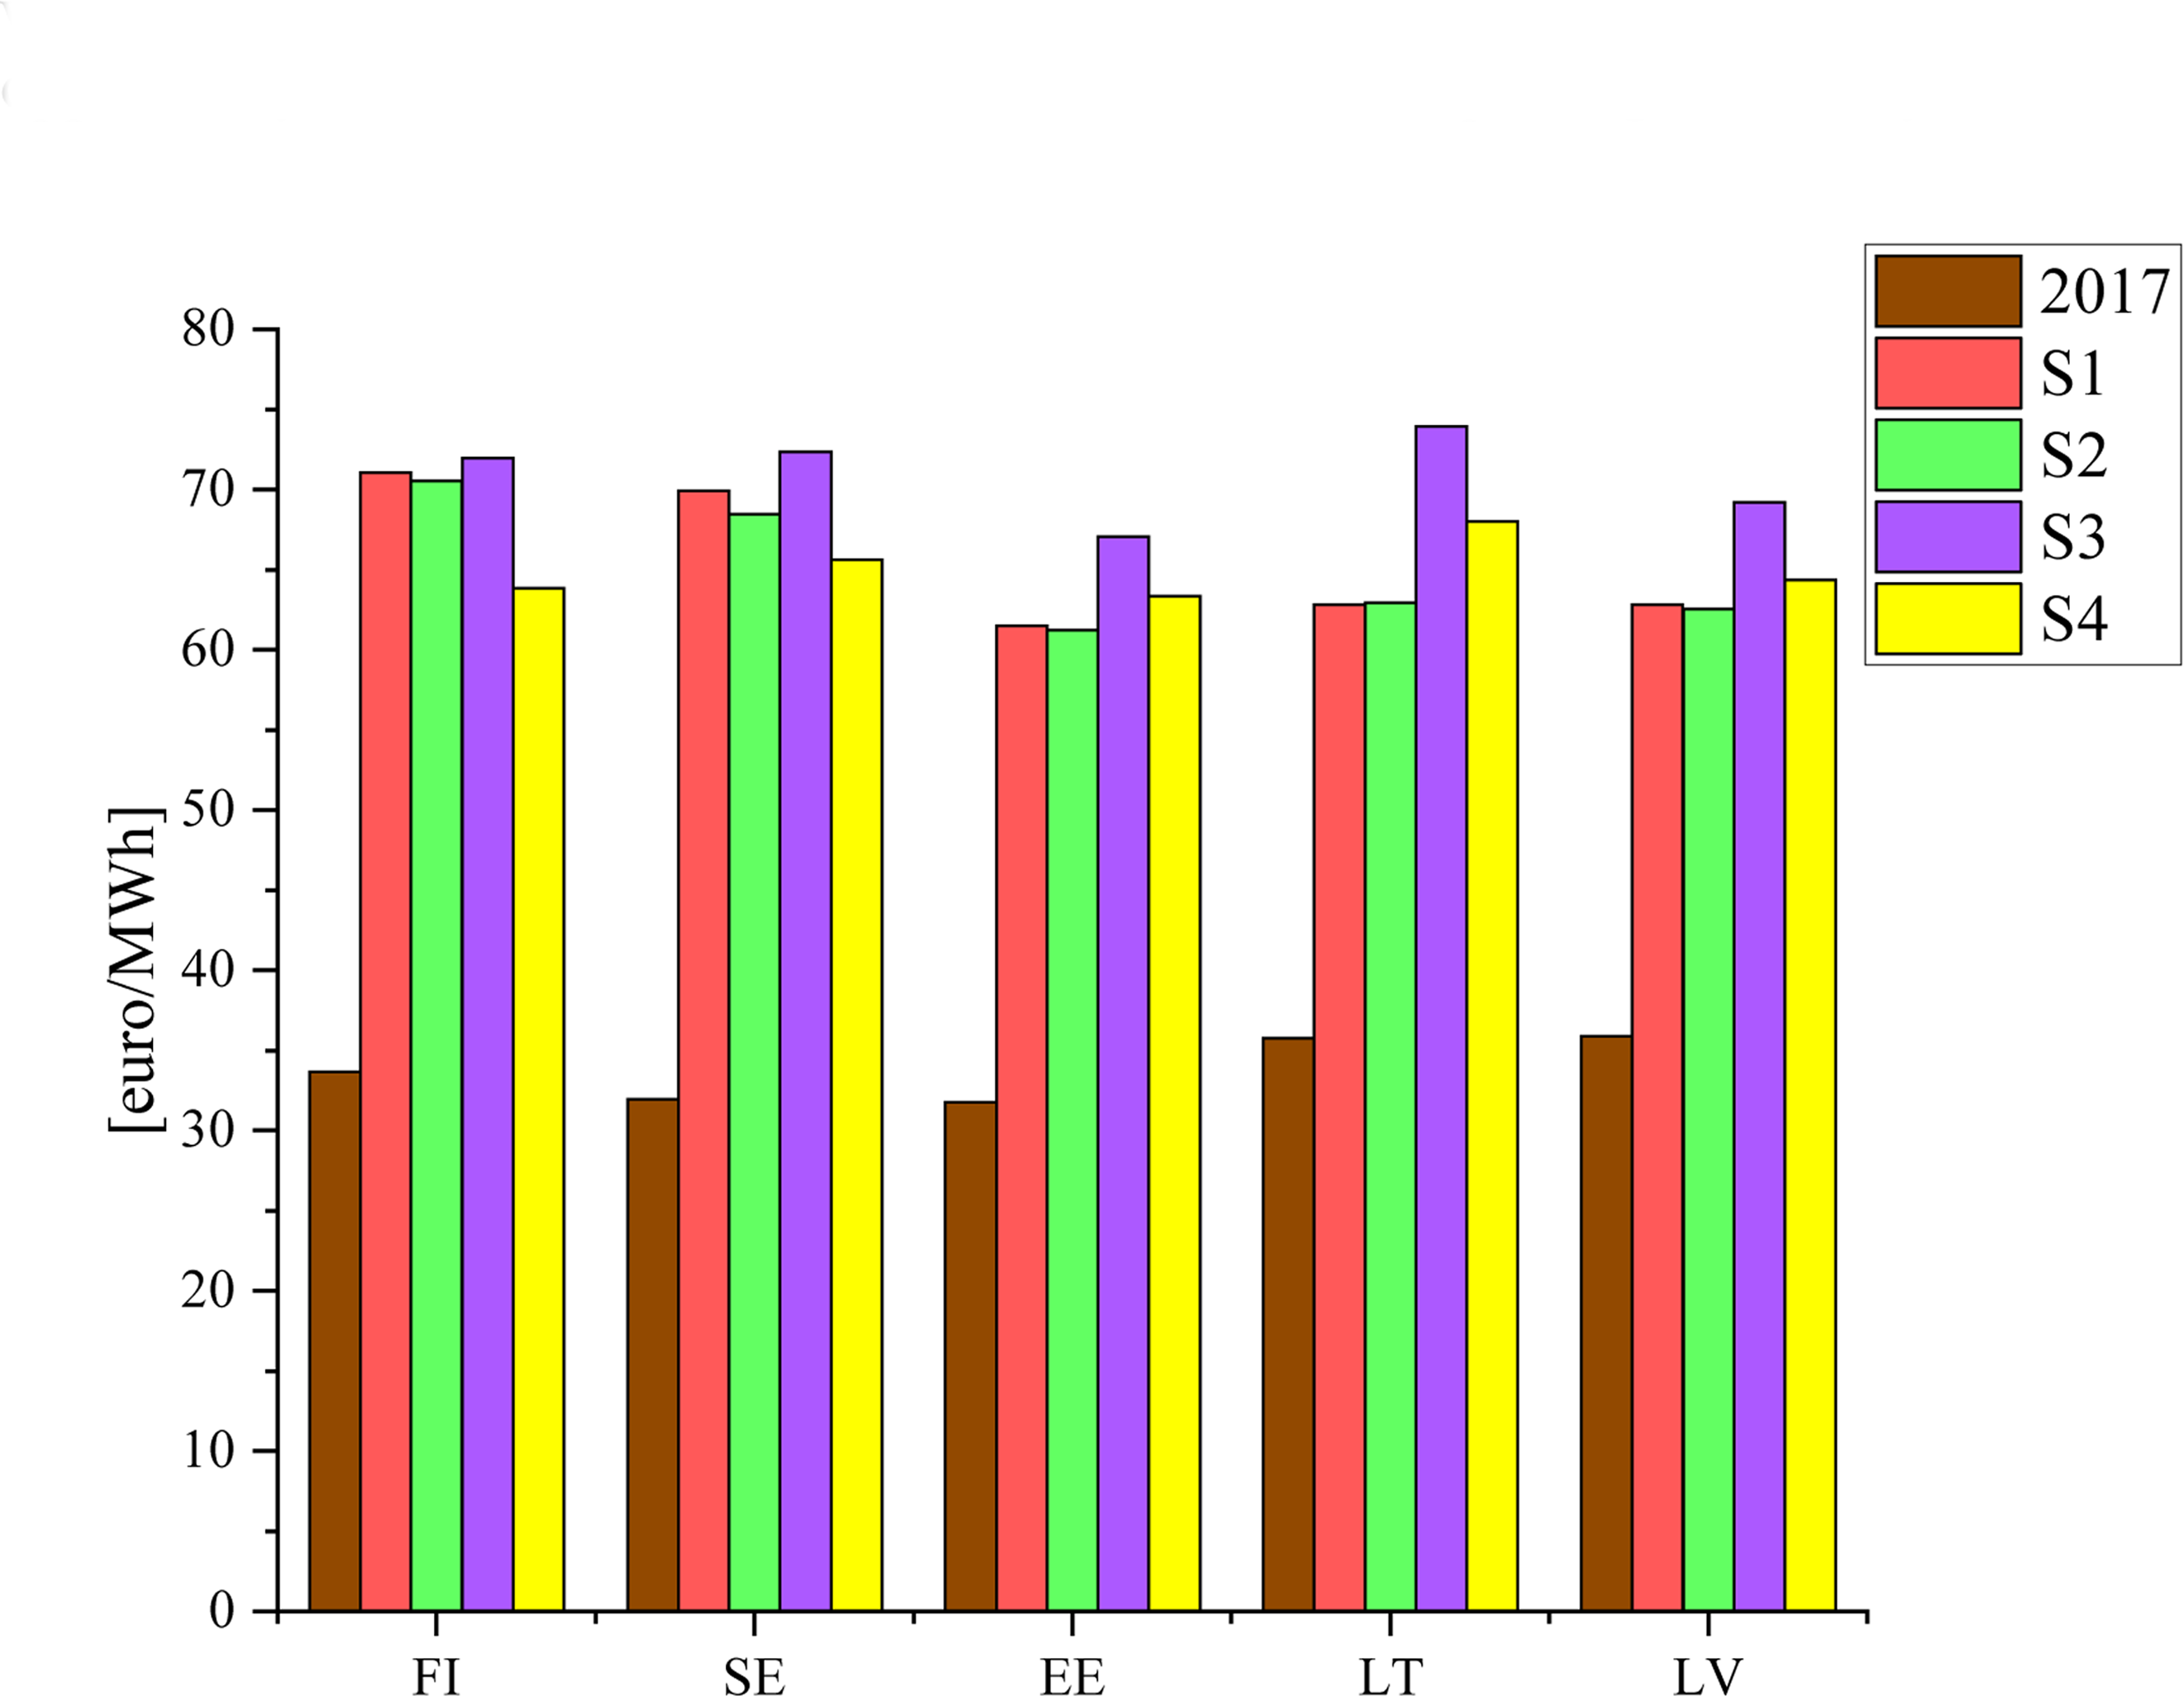
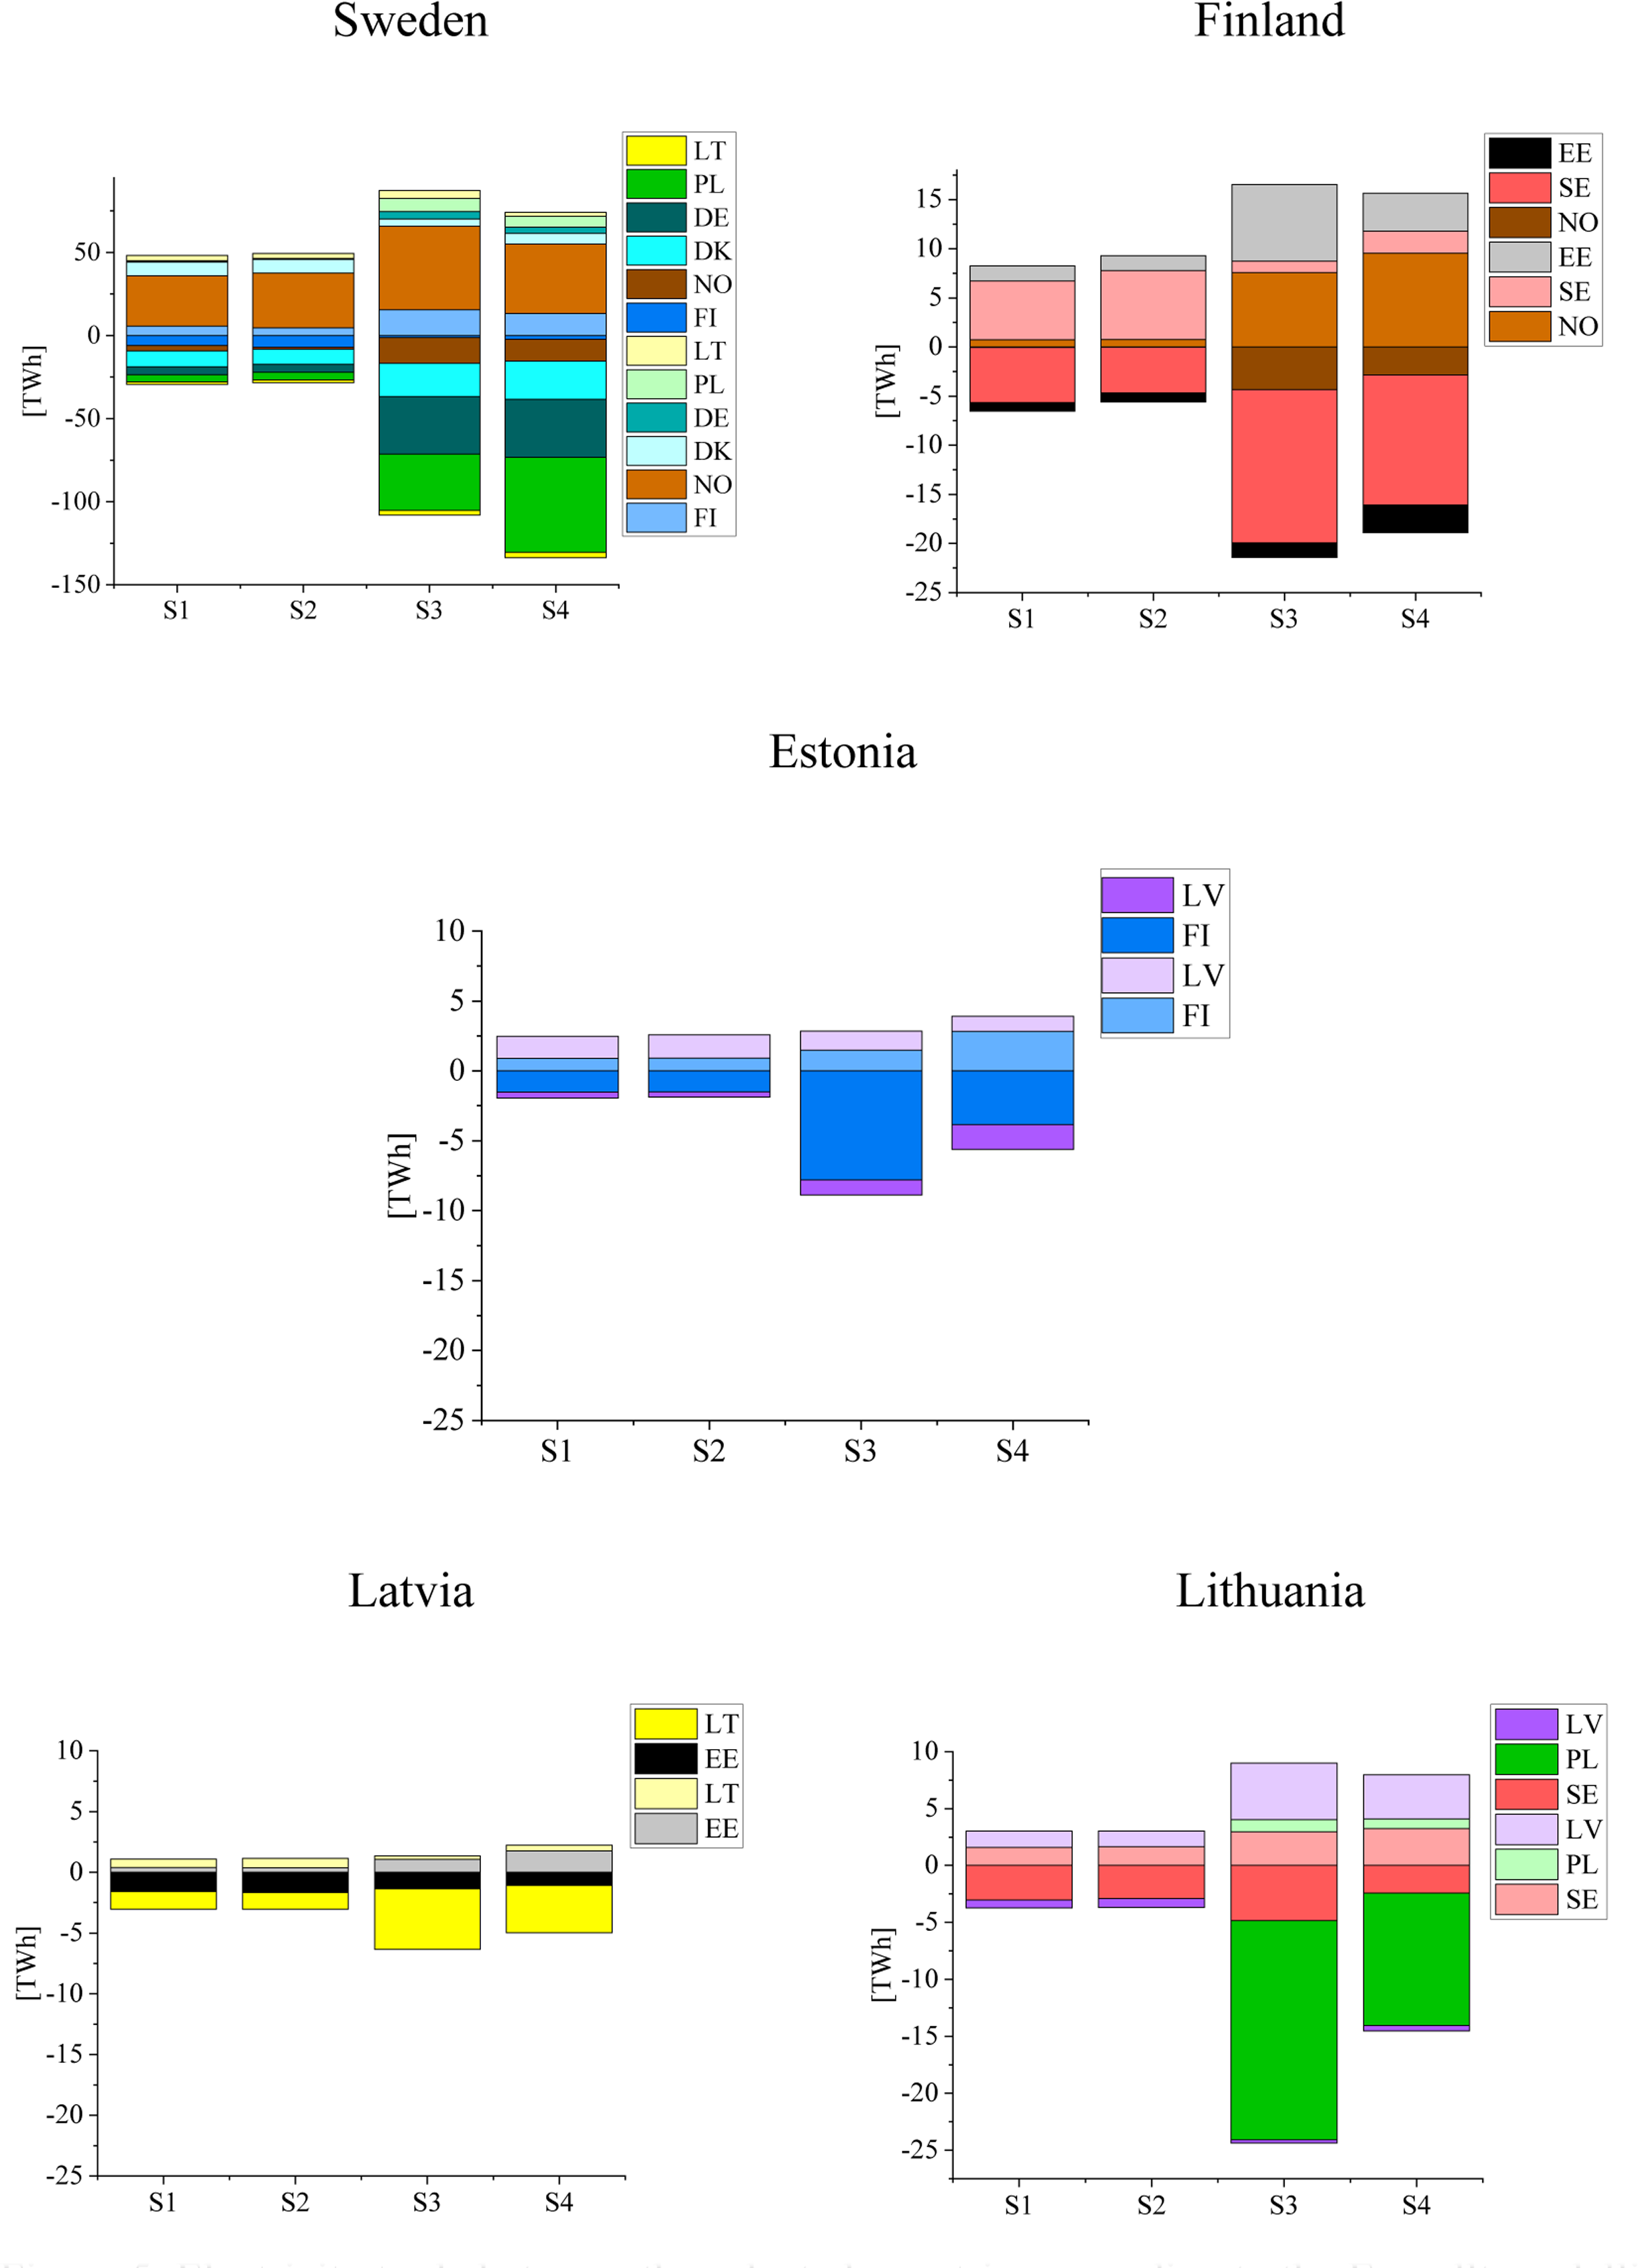
Figure 5 provides an overview of import and export between the selected countries and the neighbouring countries. From the Figure 5, we can see that trade appears to be unaffected by Sweden's nuclear power policy when the transmission is fixed (S1, S2). In the transmission capacity expansion scenarios (S3, S4), all countries become net exporters. From S3 to S4, where transmission lines are developed, nuclear power in Sweden decreases the amount of trade in the other countries, especially in Lithuania (8.84 TWh). However, Sweden then exports more electricity. What is interesting about the last scenario is the trade between Lithuania and Poland. Lithuania mainly exports electricity to Poland in the capacity expansion scenarios (S3, S4). However, this trade decreases in the last scenario. Sweden is also exporting electricity to Poland. In S4, Sweden's net export to Poland is 51 TWh. It seems that in S4, where Sweden has nuclear power and transmission lines are expanded, it is less profitable to invest in wind power capacity in the Baltic countries. Thus, Sweden provides more electricity to Poland and the trade between Lithuania and Poland decreases. Through transmission expansion, Finland trades more with its neighbours. Finland imports more electricity from Estonia and Norway, while exporting electricity mostly to Sweden.
Electricity trade between the selected countries according to the Enerallt modelling (Finland (FI), Sweden (SE), Estonia (EE), Latvia (LV) and Lithuania (LT)) and the neighbouring countries (Norway (NO), Denmark (DK), Germany (DE), and Poland (PL)). Positive values mean that electricity is imported from aforementioned countries, and vice versa, negative values mean electricity is exported
In order to analyse countries dependency on importing electricity, hourly time series of trade have been studied. Hours can be categorized into peak, off peak1 and off peak2. Peak refers to the period from 8 am to 8 pm. Off peak1 refers to the time period from midnight to 8 am. Off peak2 refers to the time period from 8 pm to midnight. This classification is based on Nord pool spot [48]. In transmission expansion scenarios (S3 and S4), all countries have less net import. In these scenarios, during peak hours and off peak 1 hours, maintaining nuclear power in Sweden causes more importing for the Baltic countries. Maintaining nuclear power in Sweden in S4 reduces dramatically the hours that Sweden is net importer. In S4, Sweden is net importer during 5% of hours, while this amount is 47% for Estonia, 30% for Latvia and 35% for Lithuania.
As shown in Figure 6, in S1 and S2, where transmission is fixed, nuclear power in Sweden cannot affect the amount and expected income from the electricity trade. In these scenarios, in all countries except Latvia, the electricity they import from other countries is generally more expensive than their income from export.
Transmission line expansion has a significant impact on revenue in the Baltic countries, especially in Lithuania, due to the large number of wind energy installation with large electricity generation capacity, which provides countries with an opportunity to trade electricity. Closer inspection of the Figure 6 shows that by expanding transmission lines, nuclear power removal in Sweden could increase revenue from export in all countries. Revenue from export is decreased in the Baltic countries when Sweden retains its nuclear power and new transmission lines are built between countries. This decrease is 38%, 26% and 46% for Estonia, Latvia and Lithuania, respectively. This can be due to a lower in wind power capacity in the Baltic region in S4 compared to S3, which results in less income from exporting electricity to neighbouring countries.
Revenue from exporting and cost from importing electricity. Positive values mean that electricity is exported to aforementioned countries and the revenue is earned, and vice versa, negative values mean electricity is imported. Situation in 2017 is shown for comparison
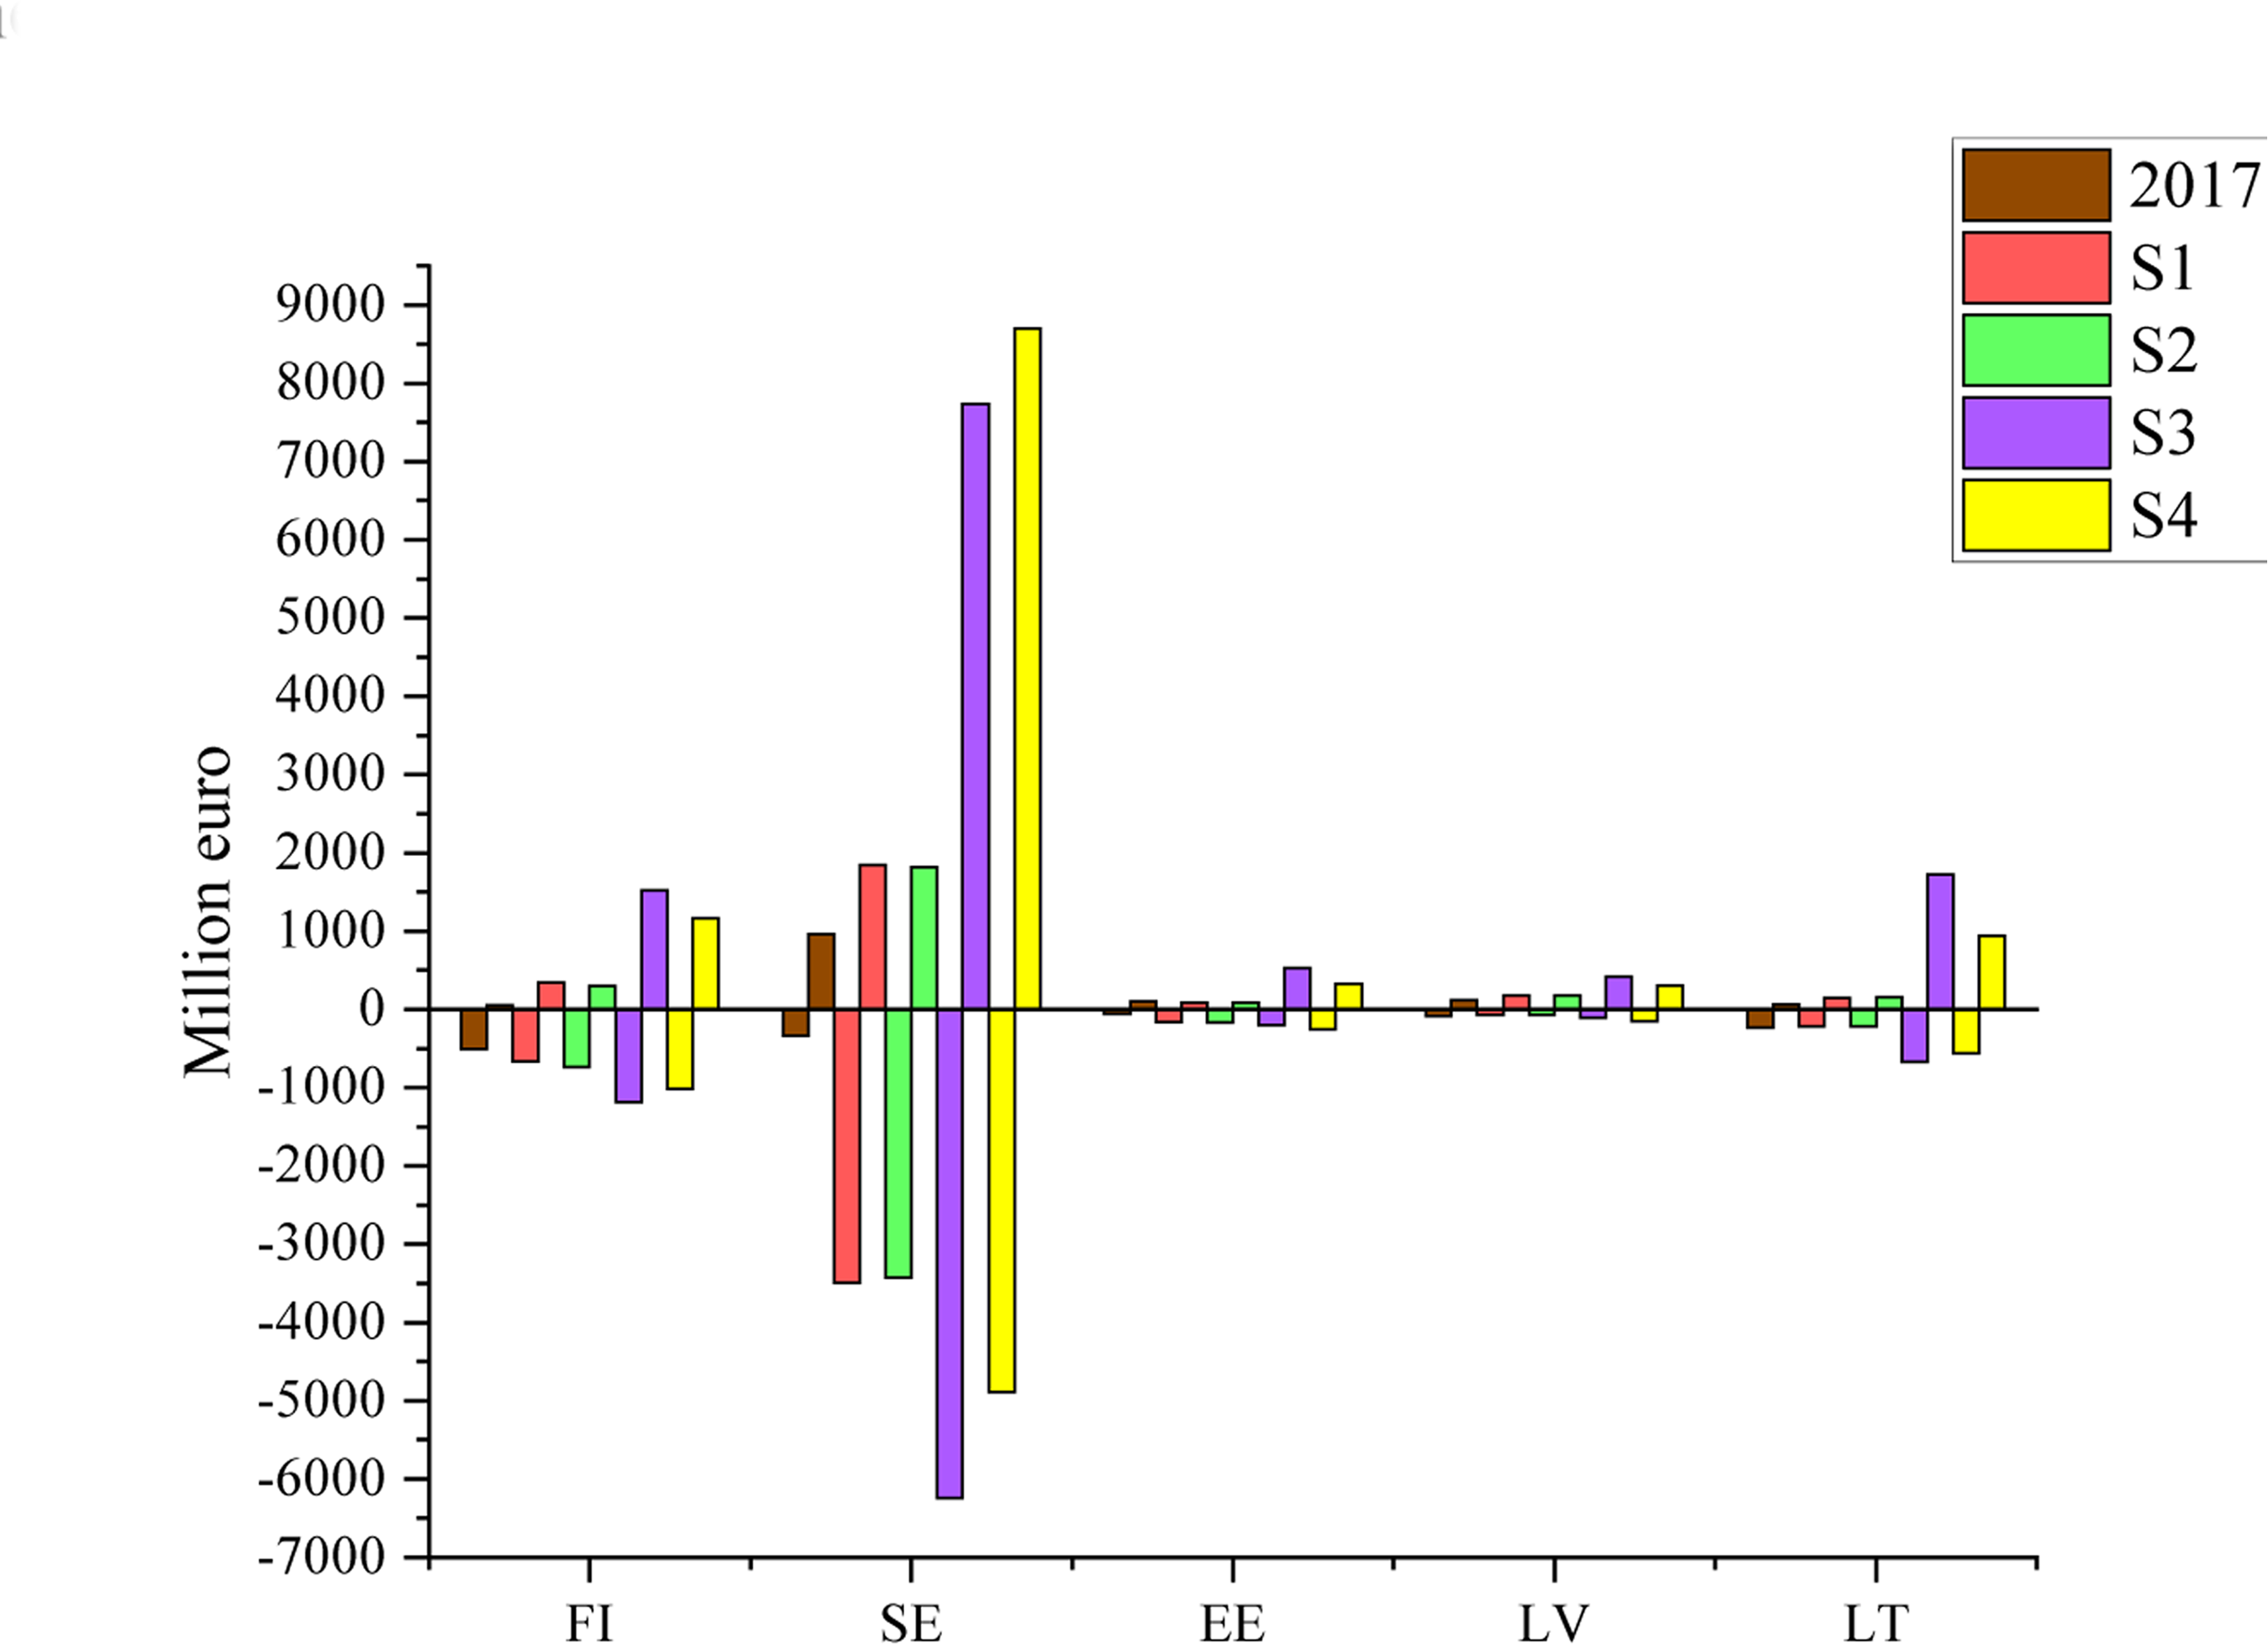
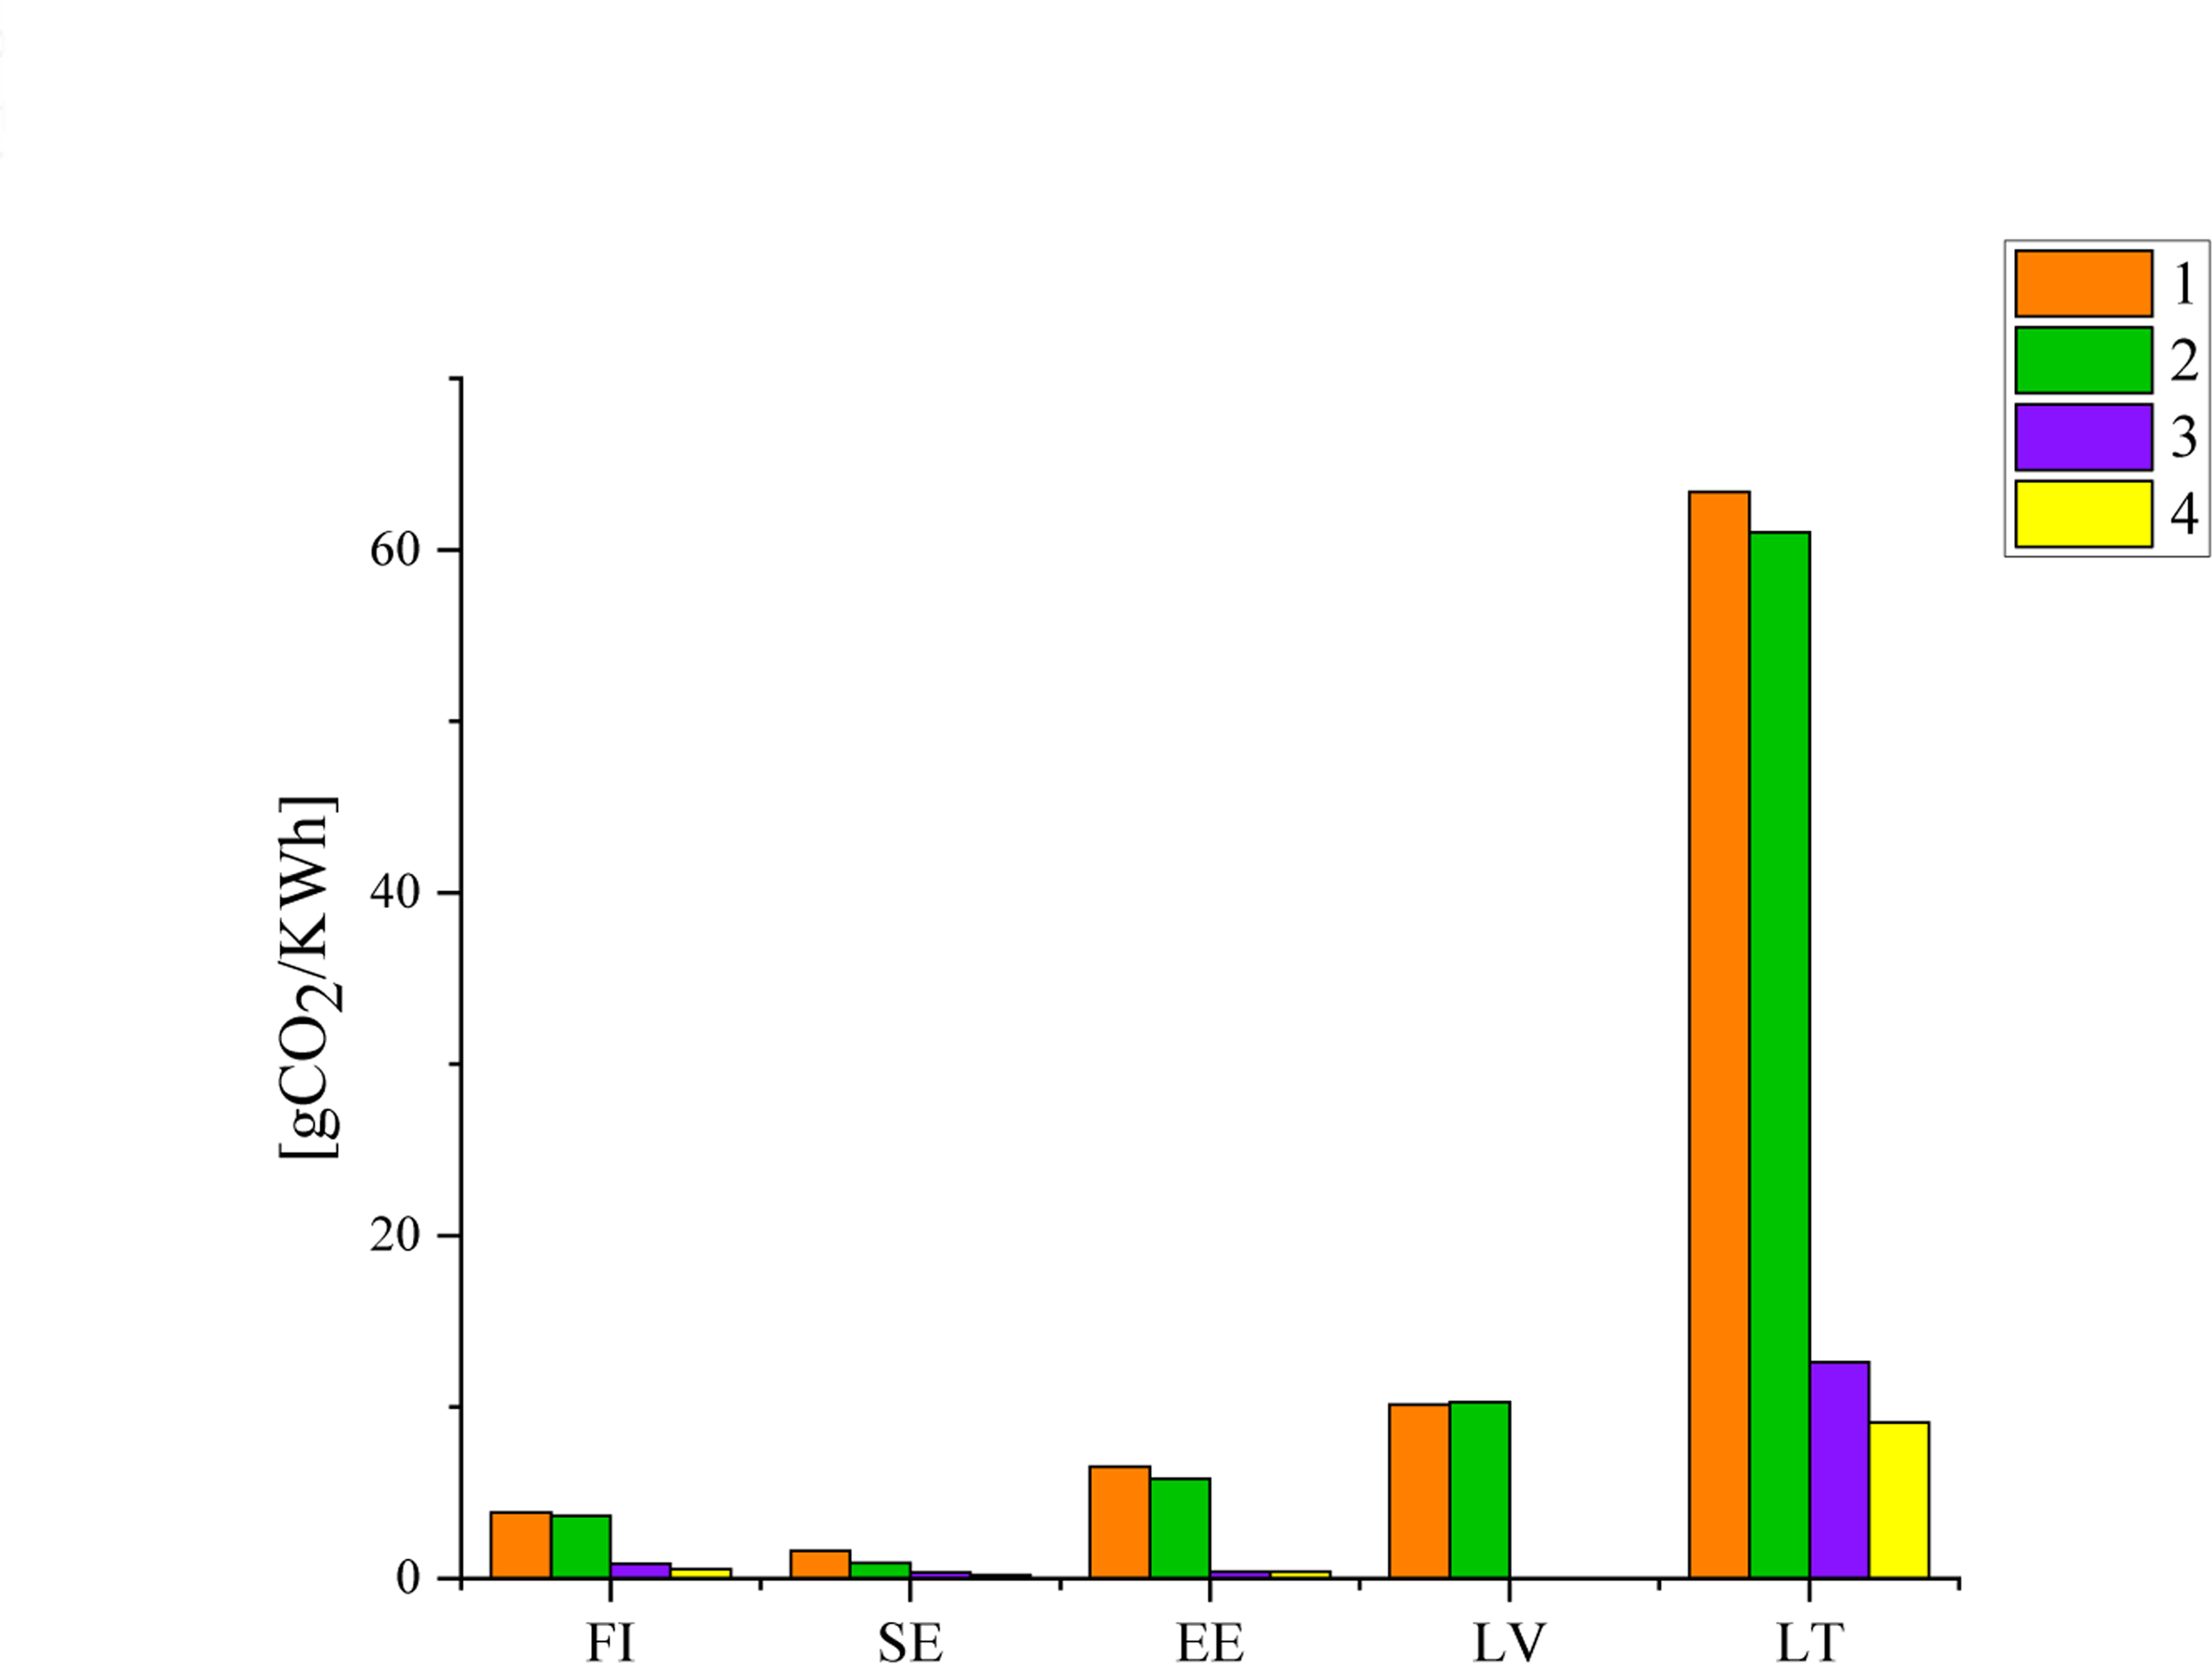
Figure 7 illustrates CO2 intensity rates in the studied countries. For CO2 intensity, CO2 emission is divided by the total power production per fuel source [49]. No significant differences were found in the CO2 intensity rates of countries in S1 to S2 or S3 to S4, where only nuclear power was changed. Transmission expansion affects the Lithuanian CO2 intensity significantly, as natural gas would not be needed. In S3 and S4, Finland, Estonia and Lithuania all generate electricity mostly with renewables, while Latvia switches 100% to renewables, resulting in further decrease in CO2 intensity rates in the Baltic countries. The reader should note that in the REX model, where the generation capacity scenarios stem from, at European level the CO2 emissions were the same in scenarios S1-S4.
CO2 intensity in the studied countries and scenarios Finland (FI), Sweden (SE), Estonia (EE), Latvia (LV), and Lithuania (LT)
The results for different scenarios are summarized in Table 3. Although the nuclear power policy is a national policy for Sweden, it affects the Baltic countries and Finland. If transmission capacity is fixed, allowing nuclear power in the future Swedish electricity system has little impact on the average electricity system cost for the Baltic countries. However, the inclusion of nuclear power in Sweden might have large impacts on the trade revenues for the neighbouring countries. Specifically, Estonia, Latvia, Lithuania and Finland face a 35%, 11%, 2%, 2%, and 35% drop in income from exporting electricity respectively, as compared to the case where nuclear power is not allowed in Sweden. Thus, Sweden's nuclear power policy on its neighbours' income is considerable even with the current amount of transmission connections.
In the case of optimal transmission expansion, the availability of nuclear power in Sweden enables a significant increase in revenue from electricity trade for Sweden as compared to no nuclear in Sweden. Meanwhile, the trade income for Finland and the Baltic countries is reduced. The average electricity system cost for Baltic countries is higher in S1 than in S3, while the electricity price shows an opposite pattern. In S4, the Baltic countries have less installed generation capacity compared to S3. However, the exchange cost and congestion income have affected the average electricity system cost in these countries. Thus, there could be a possible trade-off for the Baltic countries. In S3 when there is no nuclear power in Sweden, Baltic countries may experience higher prices. However, these higher prices are provided by lower cost due the electricity trade opportunity. In S4, they experience lower prices while they have less opportunity to trade electricity and this can bring about more costs. The main reason is that, in S3, nuclear power is not installed in Sweden, the Nordic and Baltic countries rely more on each other for electricity trade to share variable renewable energy and dispatchable resources, as compared with S4 where nuclear power is installed for Sweden. The relatively high income from electricity trade for the Baltic countries offsets the investment cost in S3. In addition, the exclusion of flexible nuclear power in the Swedish electricity system results in less flexibility for the highly renewable regional electricity, which drives up the electricity price.
Scenario comparison for the modelled countries. The electricity trade revenue and the average total system cost for each region in the scenarios studied is shown. The reader should note that the average electricity system cost includes the annualised investment cost, fixed operation and maintenance cost, variable O&M cost, fuel cost, exchange cost and congestion income, as specified in eqs. (9) and (10)
Trade revenue (Million Euro) |
Average electricity system cost (€/MWh) |
|
|---|---|---|
SE |
||
S1 |
-1646.38 |
62.30 |
S2 |
-1608.98 |
59.75 |
S3 |
1491.69 |
61.64 |
S4 |
3724.22 |
71.66 |
FI |
||
S1 |
-326.92 |
81.92 |
S2 |
-441.51 |
82.21 |
S3 |
335.10 |
68.15 |
S4 |
152.58 |
59.84 |
EE |
||
S1 |
-74.07 |
69.74 |
S2 |
-82.17 |
70.06 |
S3 |
333.38 |
40.96 |
S4 |
76.48 |
53.80 |
LV |
||
S1 |
109.16 |
122.78 |
S2 |
107.09 |
122.38 |
S3 |
309.76 |
92.88 |
S4 |
152.25 |
98.45 |
LT |
||
S1 |
-58.44 |
80.80 |
S2 |
-59.42 |
80.27 |
S3 |
1058.84 |
32.98 |
S4 |
379.68 |
57.25 |
The present study was designed to determine the effect of long-term transition to carbon neutral electricity systems in Europe, together with local policies regarding nuclear power in Sweden and expanding transmission between countries in Northern Europe, focusing on the effects on the Baltic countries and the regional electricity trade. In this regard, the impacts on electricity market prices, electricity trade, the revenue generated by the electricity trade, electricity system costs and CO2 emissions are quantified. To the best of authors' knowledge, very little has been written to date on the question of how the Nordic countries' policies affect the Baltic countries in the context of transition to carbon neutral electricity systems. Moreover, studies that have surveyed the effect of policies in one region on other areas often ignore the impacts of transmission development.
Despite the results presented in this paper, some questions remain unanswered. The scope of this study was limited in terms of studying the Baltic countries by modelling Sweden, Finland and the Baltic countries. However, as the Nordic-Baltic electricity market is interconnected, the effect of national decisions on the whole region can be surveyed in future studies, also considering in detail plausible developments in adjacent large electricity market regions Germany and Poland. Considerably more work will need to be done to determine the security of supply in this region. This study employed some approaches that may have altered the results. First of all, Sweden is discussed more as a uniform country model than four different bidding zones. This may have affected the results, as some internal trade restrictions may have been ignored. Moreover, the REX model has some limitations that can change the outcomes. Results are very sensitive to the input coming from this model. The limitations have to do with spatial resolution, the lack of ramping constraints on thermal technologies and weather data, all of which are explained in Kan et al. [34]. For renewables, a fixed production profile was used. The GIS model proposed by Mattsson et al. was used here and the capacity factors were computed based on solar radiation and wind speed [50]. These profiles also can have an impact on the results.
According to the cost-optimal scenarios of the REX investment model, wind power is the dominating low carbon electricity generation in the region studied together with the existing hydropower. The REX model results show that with transmission capacity expansion, investing in solar PV, natural gas and biogas is no longer profitable in the studied region and the possibility for wind energy capacity installation increases. Along with the realization of these investments, the Baltic countries would turn to net exporters of electricity. In S3, where there is no nuclear power in Sweden, the net export would be 6.04 TWh, 4.98 TWh, and 15.39 TWh in Estonia, Latvia, and Lithuania, respectively. In presence of nuclear power in Sweden, these amounts decrease to 1.72 TWh, 2.72 TWh, and 6.55 TWh in Estonia, Latvia, and Lithuania, respectively. Transmission expansion would be beneficial for all Baltic countries in these scenarios. Their average total electricity system cost (Table 3), as indicated by the scenarios studied, would decrease compared to the situation with current (2014) transmission capacity. This reduction of the average total electricity system cost in case of no nuclear power in Sweden is 29 €/MWh, 30 €/MWh, and 48 €/MWh in Estonia, Latvia and Lithuania, respectively. By maintaining nuclear power in Sweden, this reduction in average total electricity system cost is 16 €/MWh,24 €/MWh, and 23 €/MWh in Estonia, Latvia and Lithuania, respectively.
If the transmission capacity is kept at the current level, including nuclear power in Sweden has limited impacts on the average electricity system cost and electricity price for the Baltic countries. In the case of maintaining only the present transmission capacity, the Baltic countries would need to invest significantly more in their own generation capacity, yet they would not enjoy trade net revenues.
It is interesting to note that with respect to the factors studied in this paper, transmission expansion policy affects the results the most. The findings presented in this study provide new understanding of local policy implications at the international level, as listed above. Compared to the earlier studies, e.g., [23], [25], this paper quantified in detail the expected country-level impacts of both European low carbon transitions and of the decisions of individual countries on the neighboring countries. The findings of the study have practical relevance for the Baltic countries. Phasing out nuclear power in Sweden can provide these countries with an opportunity to improve their electricity trade. However, it requires transmission expansion and significant new investment in wind power capacity. By greatly increasing the amount of wind capacity in the future, the efficiency of the energy system could be improved by electrifying district heating sectors or enhancing storage solutions. Then, less electricity would need to be exported to neighboring countries and wind power investment could help the decarbonization of other sectors as well. This option would bring benefits regardless of international transmission grid development.
Regarding the importance of wind power as the most potential RES source in the region, our results are in line with the earlier findings of [23], [25]. It is important to remove both technical, economic and social barriers that can prevent the expansion of wind power in this region.
This study did not fully encompass RES expansion in the entire Northern Europe countries. This is one important source of uncertainty in this study. Future studies may consider this expansion for Norway, Denmark, Germany, and the UK, as these countries are connected. Moreover, both the modelling of the demand flexibility and storage systems should be included in the planning. Especially, flexibility of demand can contribute significantly to balance the electricity system with large amounts of wind power.
We sincerely thank Dr. Lina Reichenberg (Chalmers University of Technology, Aalto University) for her valuable comments. The work of A. Farsaei was partly funded by the PlanFES project of Aalto University Science Institute, and the work of A. Farsaei and S. Syri was partly supported by the European Commission through the H2020 project Finest Twins (grant No. 856602). Xiaoming Kan is funded by the European Union's Horizon 2020 research and innovation programme under the Marie Sk?odowska-Curie grant agreement number 765515.
C |
total annual electricity system cost |
[€] |
c |
short-term marginal cost of production |
[€/MWh] |
d |
electricity demand |
[MW] |
E |
exchange cost |
[€] |
F |
fixed operation and maintenance costs |
[€] |
H |
available heat conversion capacity |
[MW] |
h |
heat supply |
[MW] |
η |
efficiency |
- |
I |
annualized investment cost |
[€] |
i |
technology |
[-] |
P |
available electricity generation capacity |
[MW] |
P |
area price |
[€/MWh] |
p |
power supply |
[MW] |
Q |
commercial flow |
[MWh] |
q |
heat demand |
[MW] |
R |
congestion income |
[€] |
r |
ramping factor |
[-] |
V |
variable cost |
[€] |
η |
efficiency |
[-] |
CCGT |
Combined Cycle Gas Turbine |
CHP |
Combined Heat and Power |
GDP |
Gross Domestic Product |
GHG |
Greenhouse Gas |
NTC |
Net Transmission Capacity |
OCGT |
Open Cycle Gas Turbine |
O&M |
Operation and Maintenance |
RES |
Renewable Energy Sources |
RoR |
Run-of-River |
- , Renewable energy in the EU in 2018, 2020
- 2050 long-term strategy, 2016, https://ec.europa.eu/clima/policies/strategies/2050_en
- , EU member states commit to 2050 carbon neutrality, Poland opts out, Baltic News Network - News from Latvia, Lithuania, Estonia, 2019
- , 2017 CO2 Intensity of Electricity Generation, European Environment Agency, 2020
- ,
Why has the Nordic electricity market worked so well? ,Utilities Policy , Vol. 14 (3),pp 148-157 , 2006, https://doi.org/https://doi.org/10.1016/j.jup.2006.01.001 - , Estonia needs a plan - and support - to get rid of its dirty oil shale,, Energy Post, 2018
- ,
The Baltic Sea Region: Storage, grid exchange and flexible electricity generation for the transition to a 100% renewable energy system ,Energy Procedia , Vol. 155 ,pp 390-402 , 2018, https://doi.org/https://doi.org/10.1016/j.egypro.2018.11.039 - , Synchronisation of the Baltic States' electricity grid with the continental European system, European Commission - European Commission
- , Baltic Synchronisation
- ,
Key World Energy Statistics 2019 ,pp 81 , 2019, IEA - , Share of renewable energy in the EU up to 17.5% in 2017, 2019
- , Data & Statistics, IEA
- , Statistics | Eurostat
- , KE03: ELECTRICITY BALANCE SHEET by Indicator and Year. Statistical database
- , Estonia will not buy electricity from Russia, president says, lrt.lt
- , Trading,, «INTER RAO»
- , Lithuania remains dependent on imported energy
- ,
Electricity independence of the Baltic States: Present and future perspectives ,Sustainable Energy, Grids and Networks , Vol. 10 ,pp 55-64 , , https://doi.org/https://doi.org/10.1590/S0103-40142007000100018 - , EstLink 2 - second high-voltage direct current link between Finland and Estonia, Fingrid, 2017
- , State of the Baltic Sea area power system, Fingrid, 2017
- ,
Nuclear Energy in Sweden , 2018http://large.stanford.edu/courses/2018/ph241/matthiessen2 - ,
Swedish nuclear energy history ,Estudos Avançados , Vol. 21 (59),pp 225-242 , 2007, https://doi.org/https://doi.org/10.1590/S0103-40142007000100018 - ,
Modelling the Baltic power system till 2050 ,Energy Conversion and Management , Vol. 107 ,pp 67-75 , 2016, https://doi.org/https://doi.org/10.1016/j.enconman.2015.09.005 - ,
Long-term impact of variable generation and demand side flexibility on thermal power generation ,IET Renewable Power Generation , Vol. 12 (6),pp 718-726 , 2018, https://doi.org/https://doi.org/10.1049/iet-rpg.2017.0107 - ,
Pathway Analysis of a Zero-Emission Transition in the Nordic-Baltic Region ,Energies , Vol. 12 (17),pp 3337 , 2019, https://doi.org/https://doi.org/10.3390/en12173337 - ,
Implications of carbon price paths on energy security in four Baltic region countries ,Energy Strategy Reviews , Vol. 30 ,pp 100509 , 2020, https://doi.org/https://doi.org/10.1016/j.esr.2020.100509 - ,
The role of cross-border power transmission in a renewable-rich power system - A model analysis for Northwestern Europe ,Journal of Environmental Management , Vol. 261 ,pp 110194 , 2020, https://doi.org/https://doi.org/10.1016/j.jenvman.2020.110194 - ,
Low carbon energy transition of baltic states ,Montenegrin Journal of Economics , Vol. 17 (1),pp 219-230 , 2021, https://doi.org/https://doi.org/10.14254/1800-5845/2021.17-1.17 - ,
The role of woody biomass for reduction of fossil GHG emissions in the future North European energy sector ,Applied Energy , Vol. 274 ,pp 115360 , 2020, https://doi.org/https://doi.org/10.1016/j.apenergy.2020.115360 - ,
Scenarios for Coal-Exit in Germany-A Model-Based Analysis and Implications in the European Context ,Energies , Vol. 13 (8),pp 2041 , 2020, https://doi.org/https://doi.org/10.3390/en13082041 - ,
Unintended Consequences of National Climate Policy on International Electricity Markets-Case Finland's Ban on Coal-Fired Generation ,Energies , Vol. 13 (8),pp 1930 , 2020, https://doi.org/https://doi.org/10.3390/en13081930 - ,
Impact of Germany's energy transition on the Nordic power market - A market-based multi-region energy system model ,Energy , Vol. 115 ,pp 1640-1662 , 2016, https://doi.org/https://doi.org/10.1016/j.energy.2016.07.083 - ,
Energy market impacts of nuclear power phase-out policies ,Mitig Adapt Strateg Glob Change , Vol. 20 (8),pp 1511-1527 , 2015, https://doi.org/https://doi.org/10.1007/s11027-014-9558-3 - ,
The cost of a future low-carbon electricity system without nuclear power - the case of Sweden ,Energy , Vol. 195 ,pp 117015 , 2020, https://doi.org/https://doi.org/10.1016/j.energy.2020.117015 - ,
The benefits of cooperation in a highly renewable European electricity network ,Energy , Vol. 134 ,pp 469-481 , 2017, https://doi.org/https://doi.org/10.1016/j.energy.2017.06.004 - ,
Cross-Border Electricity Trading in Southeast Europe Towards an Internal European Market ,Energies , Vol. 13 (24),pp 6653 , 2020, https://doi.org/https://doi.org/10.3390/en13246653 - ,
Supplementary Data: The cost of a future low-carbon electricity system without nuclear power - the case of Sweden ,Energy , 2019, https://doi.org/https://doi.org/10.1016/j.joule.2018.08.006 - ,
Current and Prospective Costs of Electricity Generation until 2050 ,DIW Berlin, German Institute for Economic Research, Data Documentation 68 , 2013, Available: https://econpapers.repec.org/paper/diwdiwddc/dd68.htm - , Technology Brief, Biomass for Heat and Power, 2010
- , 2017 Annual Technology Baseline, 2017
- ,
The Role of Firm Low-Carbon Electricity Resources in Deep Decarbonization of Power Generation ,Joule , Vol. 2 (11),pp 2403-2420 , 2018, https://doi.org/https://doi.org/10.1016/j.joule.2018.08.006 - ,
Replacing hard coal with wind and nuclear power in Finland- impacts on electricity and district heating markets ,Energy , Vol. 203 ,pp 117884 , 2020, https://doi.org/https://doi.org/10.1016/j.energy.2020.117884 - , In Pictures: Swedish nuclear power reactor shuts down for good, 2019
- , Nuclear Energy in Sweden - World Nuclear Association, 2020
- , Nuclear debate takes centre stage as Swedish election looms, 2018
- , Congestion income, Fingrid, 2017
- , KE033: Production of power plants and consumption of fuels for energy generation by Type of fuel/energy, Indicator, Year and Type of power plant. Statistical database, 2019
- , Nord pool spot GLOSSARY, 2011
- ,
Methods for calculating CO2 intensity of power generation and consumption: A global perspective ,Energy Policy , Vol. 39 (2),pp 613-627 , 2011, https://doi.org/https://doi.org/10.1016/j.enpol.2010.10.034 - ,
An autopilot for energy models -- automatic generation of renewable supply curves, hourly capacity factors and hourly synthetic electricity demand for arbitrary world regions , 2020, https://doi.org/https://doi.org/10.1016/j.esr.2020.100606, arXiv:2003.01233 [physics]