


Transport, as a sector of the national economy, has an irreplaceable role, as it connects people, cities, and countries. The transport itself does not produce any goods; on the contrary, it only consumes resources, but it is essential for the functioning of human society. It is one of the main pillars of the economy, giving people access to goods and services as well as work, social interaction, education, business, healthcare, etc. From a global perspective, transport is crucial for international trade, which would otherwise not be possible.
Transport is closely linked to economic development. The connection of a city or region with large transport networks provides an impetus for the development of the local economy and creates new jobs. In the European Union (EU), more than 5% (approx. 12.2 million) of the total workforce were employed in the transport sector in 2018, contributing EUR 688 billion in Gross Value Added to the EU economy [1], [2].
Despite the unquestionable benefits, transport (besides industry and energy) belongs to the first three sectors of the EU economy contributing the most to environmental degradation. Fossil fuel consumption in transport is responsible for significant air pollution, making transport one of the main contributors to climate change. On an aggregate level, Greenhouse Gas (GHG) emissions decreased in the majority of sectors in last three decades; however, domestic and international transport lags significantly behind in the decarbonisation efforts, accounting for around one-quarter of GHG emissions produced in the EU and this share keeps growing [3].
With growing population, aspirations for mobility will continue to grow. Prognosis of the World Bank indicates that passenger traffic will increase by 50% in 2030 and freight volume is expected to grow by more than 70% globally [4]. According to the fifth IPCC (Intergovernmental Panel on Climate Change) Assessment report, if current trends persist transport greenhouse gas emissions could double by 2050 as they are growing faster than emissions produced by other energy end-users [5]. Led by CO2, the greenhouse gases are considered to be the main driving force of anthropogenic climate change.
At the level of EU countries, road transport constitutes the highest proportion of overall transport emissions, and in 2018 it accounted for 71% of all GHG emissions from transport (including international aviation and international shipping). Passenger cars and vans account for 72.5% of road transport emissions, followed by trucks and buses at 26.3%. Aviation sector, followed by international maritime sector are the second and third biggest sources of transport GHG emissions after road transport, and the share of emissions in these subsectors is expected to increase in the coming years [6].
There is a broad consensus among the researchers and practitioners that the “business as usual” approach in the transport sector is not sustainable in the long run.
In light of new EU's initiatives to decarbonize the economy presented in the European Green Deal as well as global initiatives such as UN's Agenda 2030 or the Paris agreement, it is more than clear that the transport sector will play a crucial role in sustainable growth and climate change mitigation strategies. Therefore it is inevitable to monitor the transport sector and assess its economic and environmental aspects. The paper aims to discuss the relationship between transport related GHG emissions produced in EU countries and economic development of the region. To assess the link between economic growth and transport-related greenhouse gas emissions, the decoupling method was applied and decoupling elasticity was calculated, indicating different stages of decoupling of the two variables. Although many researchers have addressed the relationship between the effects of transport and economic development, a ranking of countries according to the extent of this dependence has not yet been established. The twenty-year time span was divided into five periods, which allow a more detailed overview of the development of decoupling in individual countries. At the same time, the whole period is assessed, which makes it possible to assess the decoupling of economic growth and greenhouse gas emissions from a long-term perspective. Authors of the paper believe that the findings presented can serve as an information base for responsible and informed decision-making in the field of transport decarbonisation in terms of ensuring the convergence of transport policies with climate and energy policies both at national and EU level in order to achieving climate neutrality.
The paper is organized as follows. First, the EU transport policy framework is briefly outlined, with a focus on recent policy actions and initiatives related to this topic, and the previous empirical research is reviewed. The next section outlines the research methodology and data sources used. The final section presents the results obtained, followed by the discussion of the results and limitations of the research.
Historical data witness a strong correlation between economic growth and environmental and social effects of this growth. However, efforts to reduce the dependence between the two should respect the basic principles of sustainable development [7]. The European Union as one of the major international actors seeks long-term sustainability. One of the main building blocks of the European growth strategy is meeting several objectives concerning energy and climate change [8]. However, mitigating negative environmental effects of the transport sector is a challenge for EU's environmental policy and several initiatives have been developed to stimulate more sustainable transport approaches. The sustainability principle of the transport sector was one of the main messages of the White paper of European transport policy for 2010: time to decide, published in 2001 by Directorate-General for mobility and transport [9]. The integration of environmental considerations within the transport sector was significantly extended with the publication of the second White Paper on transport – Roadmap to a single European transport area – towards a competitive and resource-efficient transport system, published in 2011 [10]. Along with the Roadmap for moving to a competitive low carbon economy in 2050 [11] and the Energy roadmap 2050 [12], it was developed in line with the objective to reduce Europe's GHG emissions by 80 to 95% by 2050 compared with 1990 levels. The document points to the strong dependence of transport on fossil fuels and the related production of GHG emissions and it sets the quantitative targets for their reduction in the transport sector by 60% by 2050.
To strengthen the EU's actions towards sustainable transport and mobility, the urban mobility package was adopted in 2013. The action plan provides recommendations for all levels of government as well as other important stakeholders such as public and the private sector to participate in actions toward more sustainable urban mobility.
More recent initiatives in this area are the urban agenda for EU (established in 2016) and Partnership urban mobility action plan (finalized in 2018).
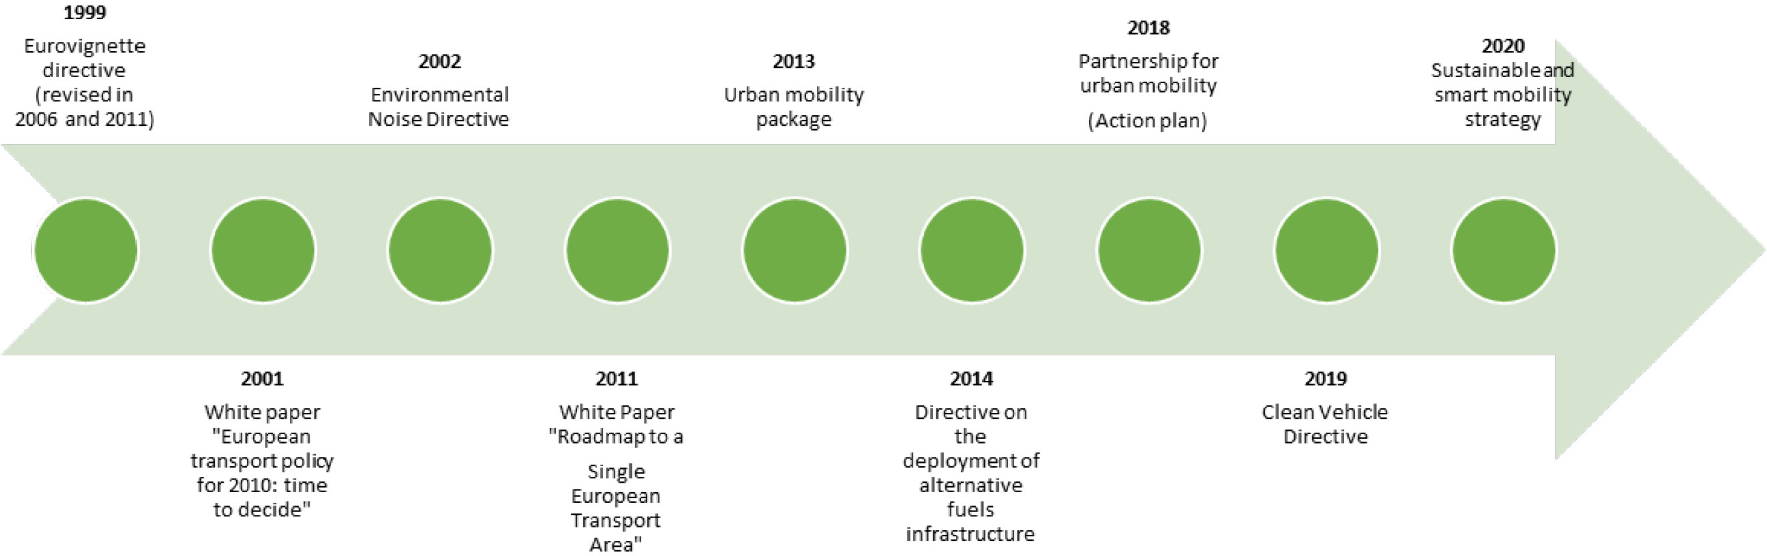
From the environmental perspective, the most significant EU transport policies and strategies include the Eurovignette Directive and its revisions; the directive on alternative fuels infrastructure [13]; the air pollutant and greenhouse gas emission standards for cars, vans, and heavy-duty vehicles [14]; the revised Clean Vehicle Directive [15]; and the Environmental Noise Directive [16]. Several of these EU-level policies have been part of the three mobility packages that were adopted during 2017–2018. These policies reduce the environmental impacts of transport either by reducing transport demand ('avoid' policies), by shifting towards more environmentally friendly and energy-efficient transport modes ('shift' policies) or by improving the environmental sustainability by reducing energy consumption and negative environmental impacts of transport ('improve' policies) [17]. The timeline of the most important milestones in the development of EU transport legislation and strategic documents are shown in Figure 1.
Timeline of the EU transport legislation and strategies development
Transport sector falls under several cross-cutting legislation documents aiming to reduce the negative environmental impacts of economic activities. A new National Emissions Ceiling (NEC) Directive (2016/2284/EU) entered into force on 31 December 2016. Replacing earlier legislation it sets 2020 and 2030 national emission reduction commitments for EU member states for five main air pollutants that contribute to the negative impact on the environment and human health. Although not directly focused on transport, a very close connection can also be found with the “Clean Energy for all Europeans package” focused to the transition from fossil fuels towards cleaner energy [18].
In November 2018, the Commission adopted the communication “A clean planet for all: a European strategic long-term vision for a prosperous, modern, competitive and climate-neutral economy” [19]. It provides a vision for a climate-neutral Europe through a positive long-term transformation focused for example on energy efficiency, deployment of renewables, and more circular and resource-efficient economy including bio-economy and natural carbon sinks but also to cleaner, safer, and connected mobility [20], [21].
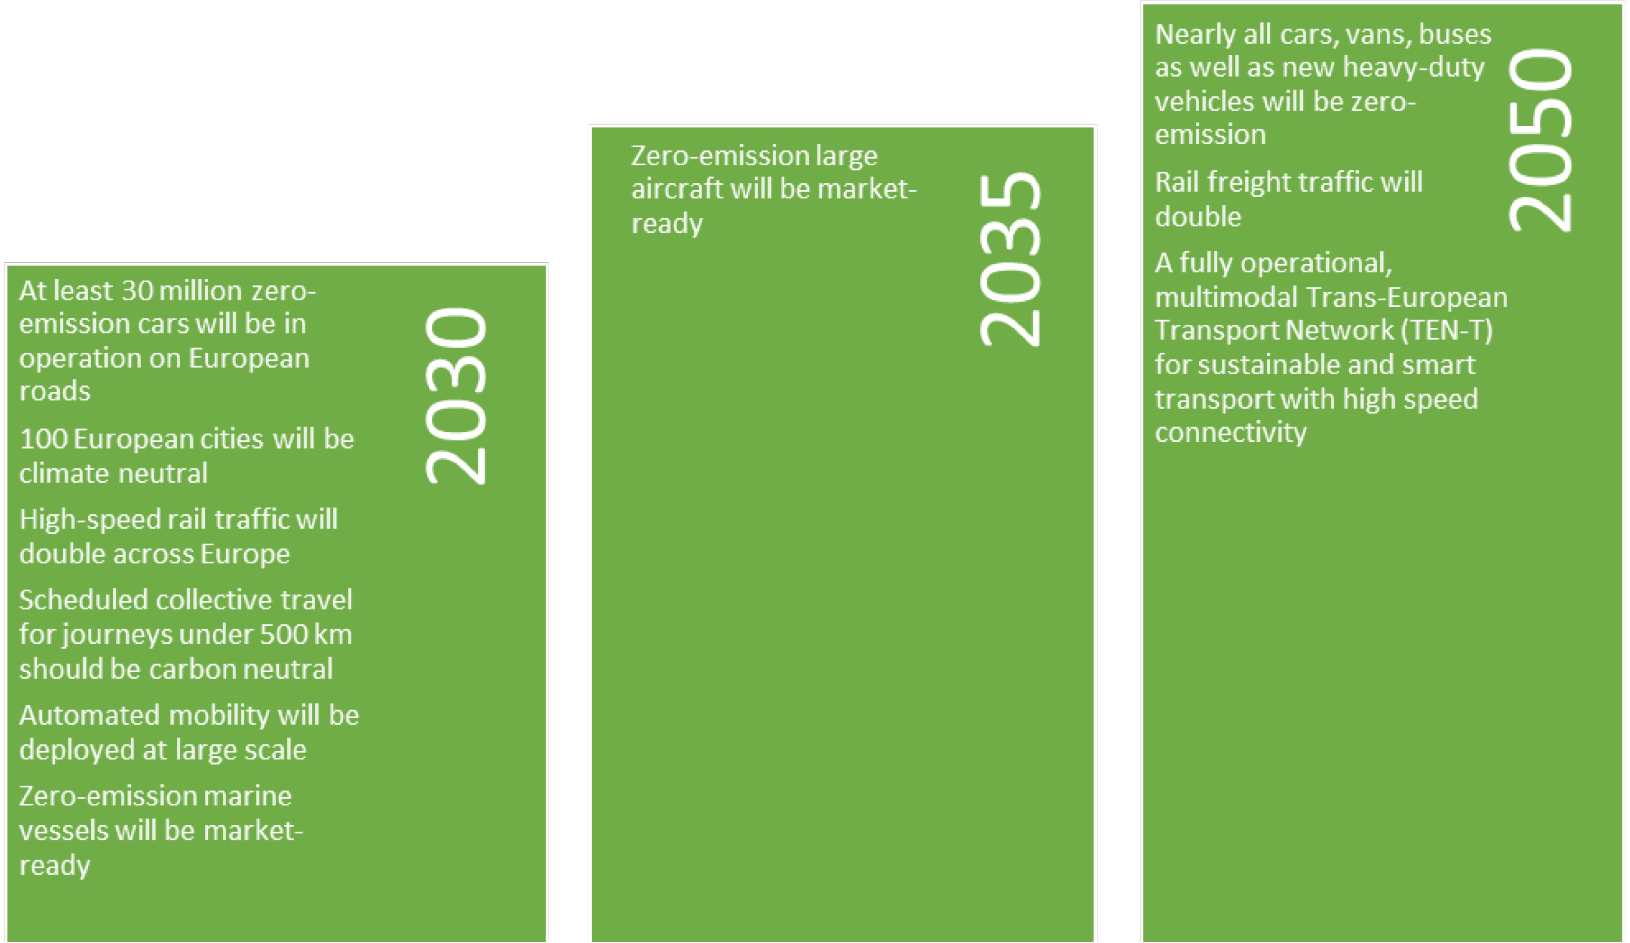
The issue of transport sustainability also resonates in the European Green Deal, which aims to reduce greenhouse gas emissions from transport by 90% by 2050. The Commission intends to adopt a comprehensive strategy to achieve this goal and to ensure that the EU transport sector is compatible with a clean, digital and modern economy [22]. The milestones of Sustainable and smart mobility strategy are captured in Figure 2.
The milestones of Sustainable and smart mobility strategy [22]
These EU initiatives fit into the context of global events such as Agenda 2030 for Sustainable Development and its Sustainable Development Goals (SDGs) and the Paris Agreement on climate change with its objective to keep the global temperature increase to well below 2 °C and pursue efforts to keep it to 1.5 °C. Although transport is not addressed in Agenda 2030 in a stand-alone goal, there are a number of Sustainable Development Goals directly linked to transport, including SDG 3 on health (increased road safety), SDG 7 on energy (fossil fuel consumption), SDG 8 on decent work and economic growth, SDG 9 on resilient infrastructure, SDG 11 on sustainable cities (access to transport and expanded public transport), SDG 12 on sustainable consumption and production (ending fossil fuel subsidies), SDG 13 on climate action (generation of GHG emissions) and SDG 14 on oceans, seas, and marine resources. However, sustainable transport has an inter-linkage impact on nearly all of the 17 SDGs.
Exploring the interrelationship between economic growth and the environmental aspects of transport, in particular, the over-exploitation of fossil resources and the production of greenhouse gases contributing to climate change is the subject of a great number of studies carried out in many countries and regions. Taking Europe as an example, Tapio [23] examines relationships between GDP, road traffic volume, and CO2 emissions from road traffic in Finland between 1970 and 2001 and compares it with the aggregated results of 15 EU member states. Tapio also presents the theoretical framework of decoupling and defines different degrees of decoupling. Mazzarino [24] applies static approach to assess energy consumption and carbon dioxide emissions produced by the transport sector in Italy during the period 1980 and 1995. Using decomposition scheme he determines that growth of GDP is the main driving force of increasing CO2 emissions. McKinnon [25] examines factors responsible for decoupling of road freight transport and economic growth in the UK and he concludes, that from the public policy perspective, the decoupling is in the right direction, however, the net environmental benefits are quite modest.
Some studies focus on different transport modes; e.g., Sorrell [26] is paying attention to road freight transport in the UK. Between 1989 and 2004 the country achieved relative decoupling as the energy consumption of road freight transport has grown more slowly than the economy. The study revealed that compared to other EU countsries, the UK was more successful in decoupling its environmental impacts of road freight transport from GDP. The main factor contributing to decoupling between two variables was the declining value of manufactured goods relative to GDP. Gray et al. [27] performed the decoupling analysis of economic growth, transport growth, and carbon emissions in Scotland. They believe that decoupling transport demand from economic development is a prerequisite for long-term sustainability.
Comparative study between two European countries – United Kingdom and Spain were performed by Alises et al. [28]. They focus on assessing the decoupling trend of road freight transport and GDP. The results reveal significant differences between countries: while in the UK they experienced absolute decoupling, in Spain it was only relative decoupling. The most important drivers in this case were the share of different industries within GDP and the evolution of road freight transport intensity.
Decoupling studies are very frequent in other countries. Especially in China, decoupling methods are frequently used for assessing the relationship between economic development and CO2 emissions produced by various sectors, e.g., construction industry [29], [30], manufacturing industry [31], [32], and tourism industry [33].
Transport as the main energy-consuming and carbon-producing sector in China is under the scrutiny of researchers. From a geographical perspective, the studies cover the whole country (e.g., [34], [35]) or individual regions (e.g., [36], [37]). Despite slight deviations, most studies indicated the weak decoupling state, offering empirical evidence on relative decoupling of transport-related carbon emissions from economic growth. However, since transport is one of the most challenging issues of growing urbanization, studies carried out at a city level are not exceptional either. For example, Fan and Lei [38], and Wang and Liu [41] investigated driving forces and impacts of transport related carbon emissions in Beijing. The cities of Shanghai and Tokoi were compared in the study by Luo et al. [39], who performed factorial decomposition of urban transport carbon emission in these cities. Onother four municipalities in China were investigated by Wang et al. [40] in order to determine the driving factors affecting carbon emissions from transport sector.
Results of the studies vary significantly; e.g., Wang et al. [39] performed a decoupling analysis on the relationship between economic output and CO2 emissions in the transport sector in four of China's municipalities. The results show weak decoupling in Beijing, strong decoupling in Shanghai, and Tianjin and negative decoupling in Chongqing.
More global perspective was adopted in the multinational study performed by Lu et al. [42]. Authors discuss the decomposition and decoupling effects of CO2 emissions from highway transport in Taiwan, Germany, Japan and South Korea. They conclude that the rapid economic development and car ownership were the most important drivers for the increased CO2 emissions, while population intensity contributed to emission reduction.
Scholl et al. [43] provide a comparative analysis of nine OECD (Organisation for Economic Co-operation and Development) countries, discussing the main driving forces of decoupling CO2 emissions from transport, including transport activity, modal structure and transport energy intensity. Results show that increase of travel activity and modal shifts led to an increase in energy use, while the reduction in modal energy intensities reduced energy use from automobiles in the USA and in air travel in the sample of countries. Similarly, the increased activity and modal shifts were the drivers of increasing CO2 emissions from passenger transport in every country except the USA.
Environmental externalities (carbon emissions) as well as social externalities (fatalities) of transport are discussed in the study of Loo and Banister [44] conducted for 15 major countries including the USA, China, Japan, the Russian Federation but also some European countries, e.g., Germany, France, United Kingdom, Spain, and Italy. Results of decoupling analysis vary in terms of timing, consistency, form, and magnitude. However, authors conclude that over the 22 year study period, reduction of carbon emission from the transport sector is more difficult than the reduction of transport-related fatalities.
To assess the relation between the transport-related GHG emissions produced in EU countries and economic development of these countries, the decoupling method was applied.
Decoupling in the general sense of the word expresses the process by which one dependent variable becomes increasingly independent of the other (independent) variable as a result of a change in external conditions over time.
This approach has an important position in the sustainable development literature and is extensively used by environmental researchers. However, it is not just a theoretical concept, but also an important political goal to ensure prosperity and growth in the quality of life without excessive environmental degradation.
Decoupling can take two basic forms: relative ("weak") or absolute ("strong") [45]. In the case of relative decoupling, both variables continue to develop in the same direction in correlation with each other, but at a different pace than in the initial state. Thus, it may typically be a reduction in some type of impact per unit, but as units continue to grow, so do the overall impacts. On the contrary, absolute decoupling expresses the state when one variable increases, while the other decreases in the overall summary (or increases if it decreased in the initial state).
Environmental decoupling (applied in this study) works with two variables: (1) economic (independent) variable (most often expressed in terms of GDP) and (2) resource consumption and/or environmental impacts (dependent variable). For the purposes of this study, we will further focus on the only one specific dependent variable, which is the anthropogenic transport-related greenhouse gas emissions. These fall into the category of negative environmental externalities, but are also intimately linked to the consumption of fossil energy sources.
For a better understanding and the assessment of the decoupling of economic growth and transport-related GHG emissions, the decoupling index (DI) can be calculated. This index refers to the ratio of (1) change in the rate of environmental pollution (e.g., production of greenhouse gas emissions) to (2) change in the rate of economic growth (expressed, e.g., in the form of GDP) within a certain time period.
For example, if we define the change in the rate of GHG emission production between year tand year t–1 as:
(1)
and the change in the rate of economic growth as:
(2)
then the Decoupling Index in year t is as follows:
3
If the economic variable continues to grow, i.e.∆Gt > 0, then DIKt may imply one of three following scenarios. When DIt > 1, it means the increasing rate of environmental pollution (GHG emissions) is similar to or exceeds economic growth. In this case, no decoupling or coupling is taking place. In other words, as the economy grows, resource consumption and environmental degradation increase rapidly. This refers to the first half (climbing stage) of the Environmental Kuznets Curve (EKC). When DIt equals 1, it is the turning point between absolute coupling and relative decoupling. In the stage of absolute coupling, a higher DItvalue implies stronger resource dependency of economy, lower resource efficiency, and heavier environmental pollution [7].
When 0 < DIt < 1 it means the rate of growth in resource consumption or environmental pollution (e.g., GHG emissions) decreases compared to economic growth. In this case, relative (weak) decoupling is taking place. When DIt ranges from 0 to 1, lower DIt means higher resource efficiency and lower dependence on natural resources.
When DIt = 0, it means that environmental impacts remain constant.
When resource consumption or environmental pollution (e.g., GHG emissions) decreases while the economy keeps growing, then DIt<0. Here the relationship between the environment and the economy can be described as the declining stage” of the EKC (in this case ∆E and ∆G have opposite signs), and absolute (strong) decoupling occurs.
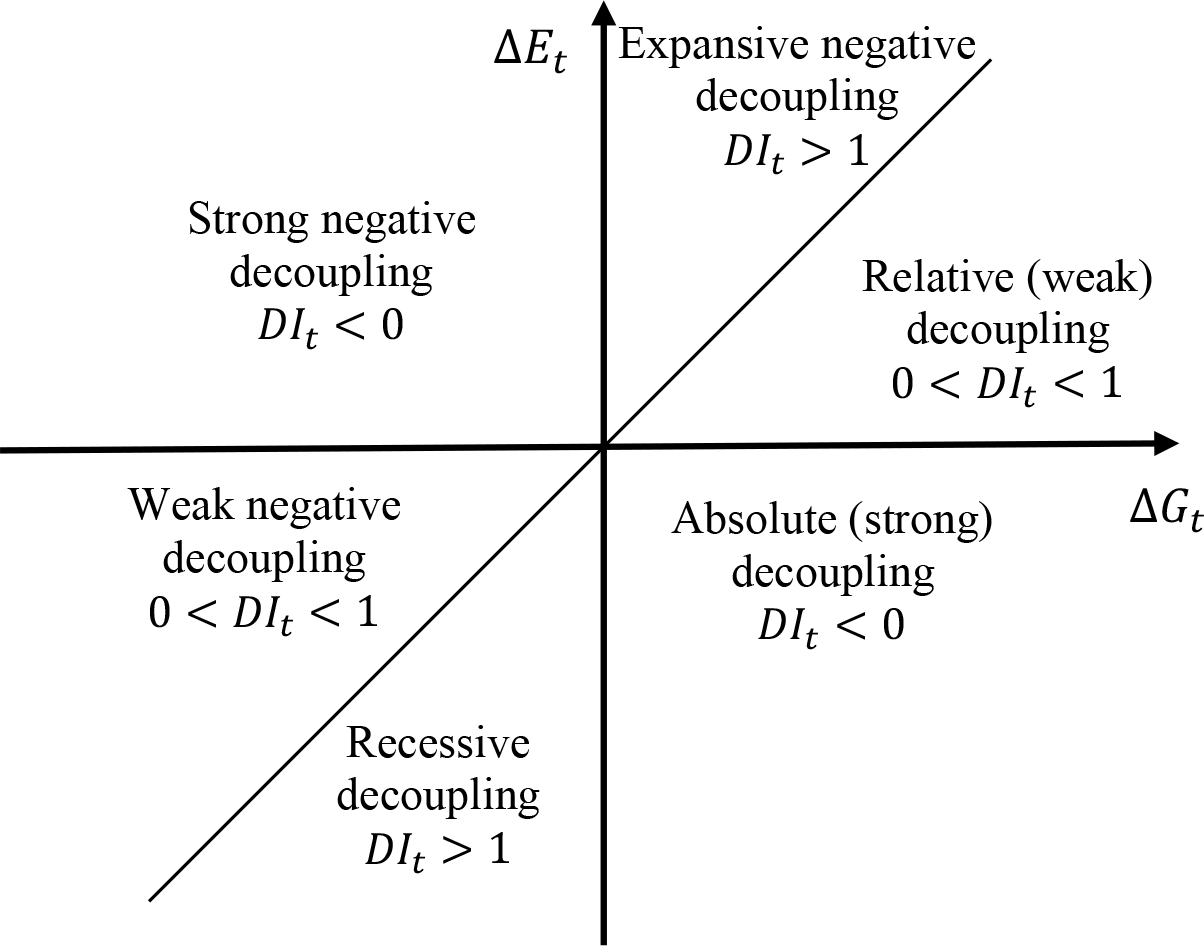
More precisely, according to Xu et al. [46], decoupling can be divided into seven stages: weak decoupling, strong decoupling, recessive decoupling, strong negative decoupling, weak negative decoupling, expansive negative decoupling, and critical (Table 1).
| ∆Et | ∆Gt | DIt | Decoupling stage | Description |
|---|---|---|---|---|
| <0 | >0 | DIt<0 | Absolute (strong) decoupling | The rate of change is negative for environmental impact/pressure and positive for economic growth |
| >0 | >0 | 0 <DIt< 1 | Relative (weak) decoupling | The rate of growth is lower for environmental impact/pressure than for the economy |
| <0 | <0 | DIt> 1 | Recessive decoupling | The rate of the decrease is higher for environmental impact/pressure than for the economy |
| >0 | <0 | DIt< 0 | Strong negative decoupling | The rate of change is positive for environmental impact/pressure and negative for the economy |
| <0 | <0 | 0 <DIt< 1 | Weak negative decoupling | The rate of the decrease is lower for environmental impact/pressure than for the economy |
| >0 | >0 | DIt> 1 | Expansive negative decoupling | The rate of growth is higher for environmental impact/pressure than for the economy |
| >0, (<0) | >0, (<0) | DIt = 1 | Critical | The rates of change are equal for environmental impact/pressure and economic growth |
Graphical representation of decoupling stages is captured in Figure 3.
Decoupling stages
This study aims to quantitatively assess the environmental performance of the transport sector in EU member states. The analysis is performed via the decoupling method, which allows for the assessment of the mutual relationship between the economic growth of the EU member states and the production of transport-related GHG emissions.
The data for the analysis was obtained from the databases of Eurostat. Gross domestic product (GDP) is extracted at current prices (million EUR) and transport-related greenhouse gases (GHGs) consisting of so-called “Kyoto basket” greenhouse gases (thousand tons). These gases include CO2, N2O in CO2 equivalent, CH4 in CO2 equivalent, HFCs (hydrofluorocarbons) in CO2 equivalent, PFCs (perfluorinated compounds) in CO2 equivalent, SF6 in CO2 equivalent, and NF3 in CO2 equivalent.
The decoupling of transport-related GHG emissions and the economic growth of the EU member states presents the ratio of percentage units of changes in GHG emissions produced by the transport sector and the percentage of units of change in gross domestic product of the EU member states in the analysed time period. For a more precise analysis, the decoupling indicator will be distributed to the different stages according to Table 1.
For the purpose of this study, we have performed the analysis of the relation between economic growth of EU member states and transport-related GHG emissions.
The analysed period covers a 20-year span, from 1997 to 2017. ∆GDPt and ∆GHGt values were calculated using data from available databases of the Eurostat using eq. (1) and eq. (2). Subsequently, the value of decoupling index DIt was calculated using eq. (3). We used Greenhouse Gas Emissions as variable Et and Gross Domestic Product as variable Gt.
First, we divided the analysed period into 4-year intervals. Table 2 shows the results of the decoupling index of 28 EU countries as well as stages of decoupling achieved by the countries within the monitored intervals.
Based on the decoupling analysis of the EU 28 in the period 1997–2017, countries spread into four categories. Absolute (strong) decoupling, which is also the equivalent of the green growth, occurs in 48 cases (34%). In this subcategory, the GDP increases, and negative environmental impacts decrease. Thus the decoupling index is below 0. This is the best case for both the economy and the environment. Interval 2009–2013 can be considered as the most successful as the absolute decoupling was reached by a total of 18 European countries.
Relative (weak) decoupling occurs when the growth rate of the transport-related GHG emissions is positive but less than the growth rate of the economic variable (GDP). Decoupling occurs to some extent because GHG emissions grow more slowly than the GDP, but it is weak since the absolute amount of GHG emissions produced by the transport sector nevertheless continues to grow. Relative decoupling is the most frequent stage of decoupling in our study, as it occurs in 77 cases (55%). This form of decoupling most often occurred in the period 2001–2005, when a total of 21 European countries achieved relative decoupling.
Table 2. Decoupling index of the EU 28 within 5 time periods
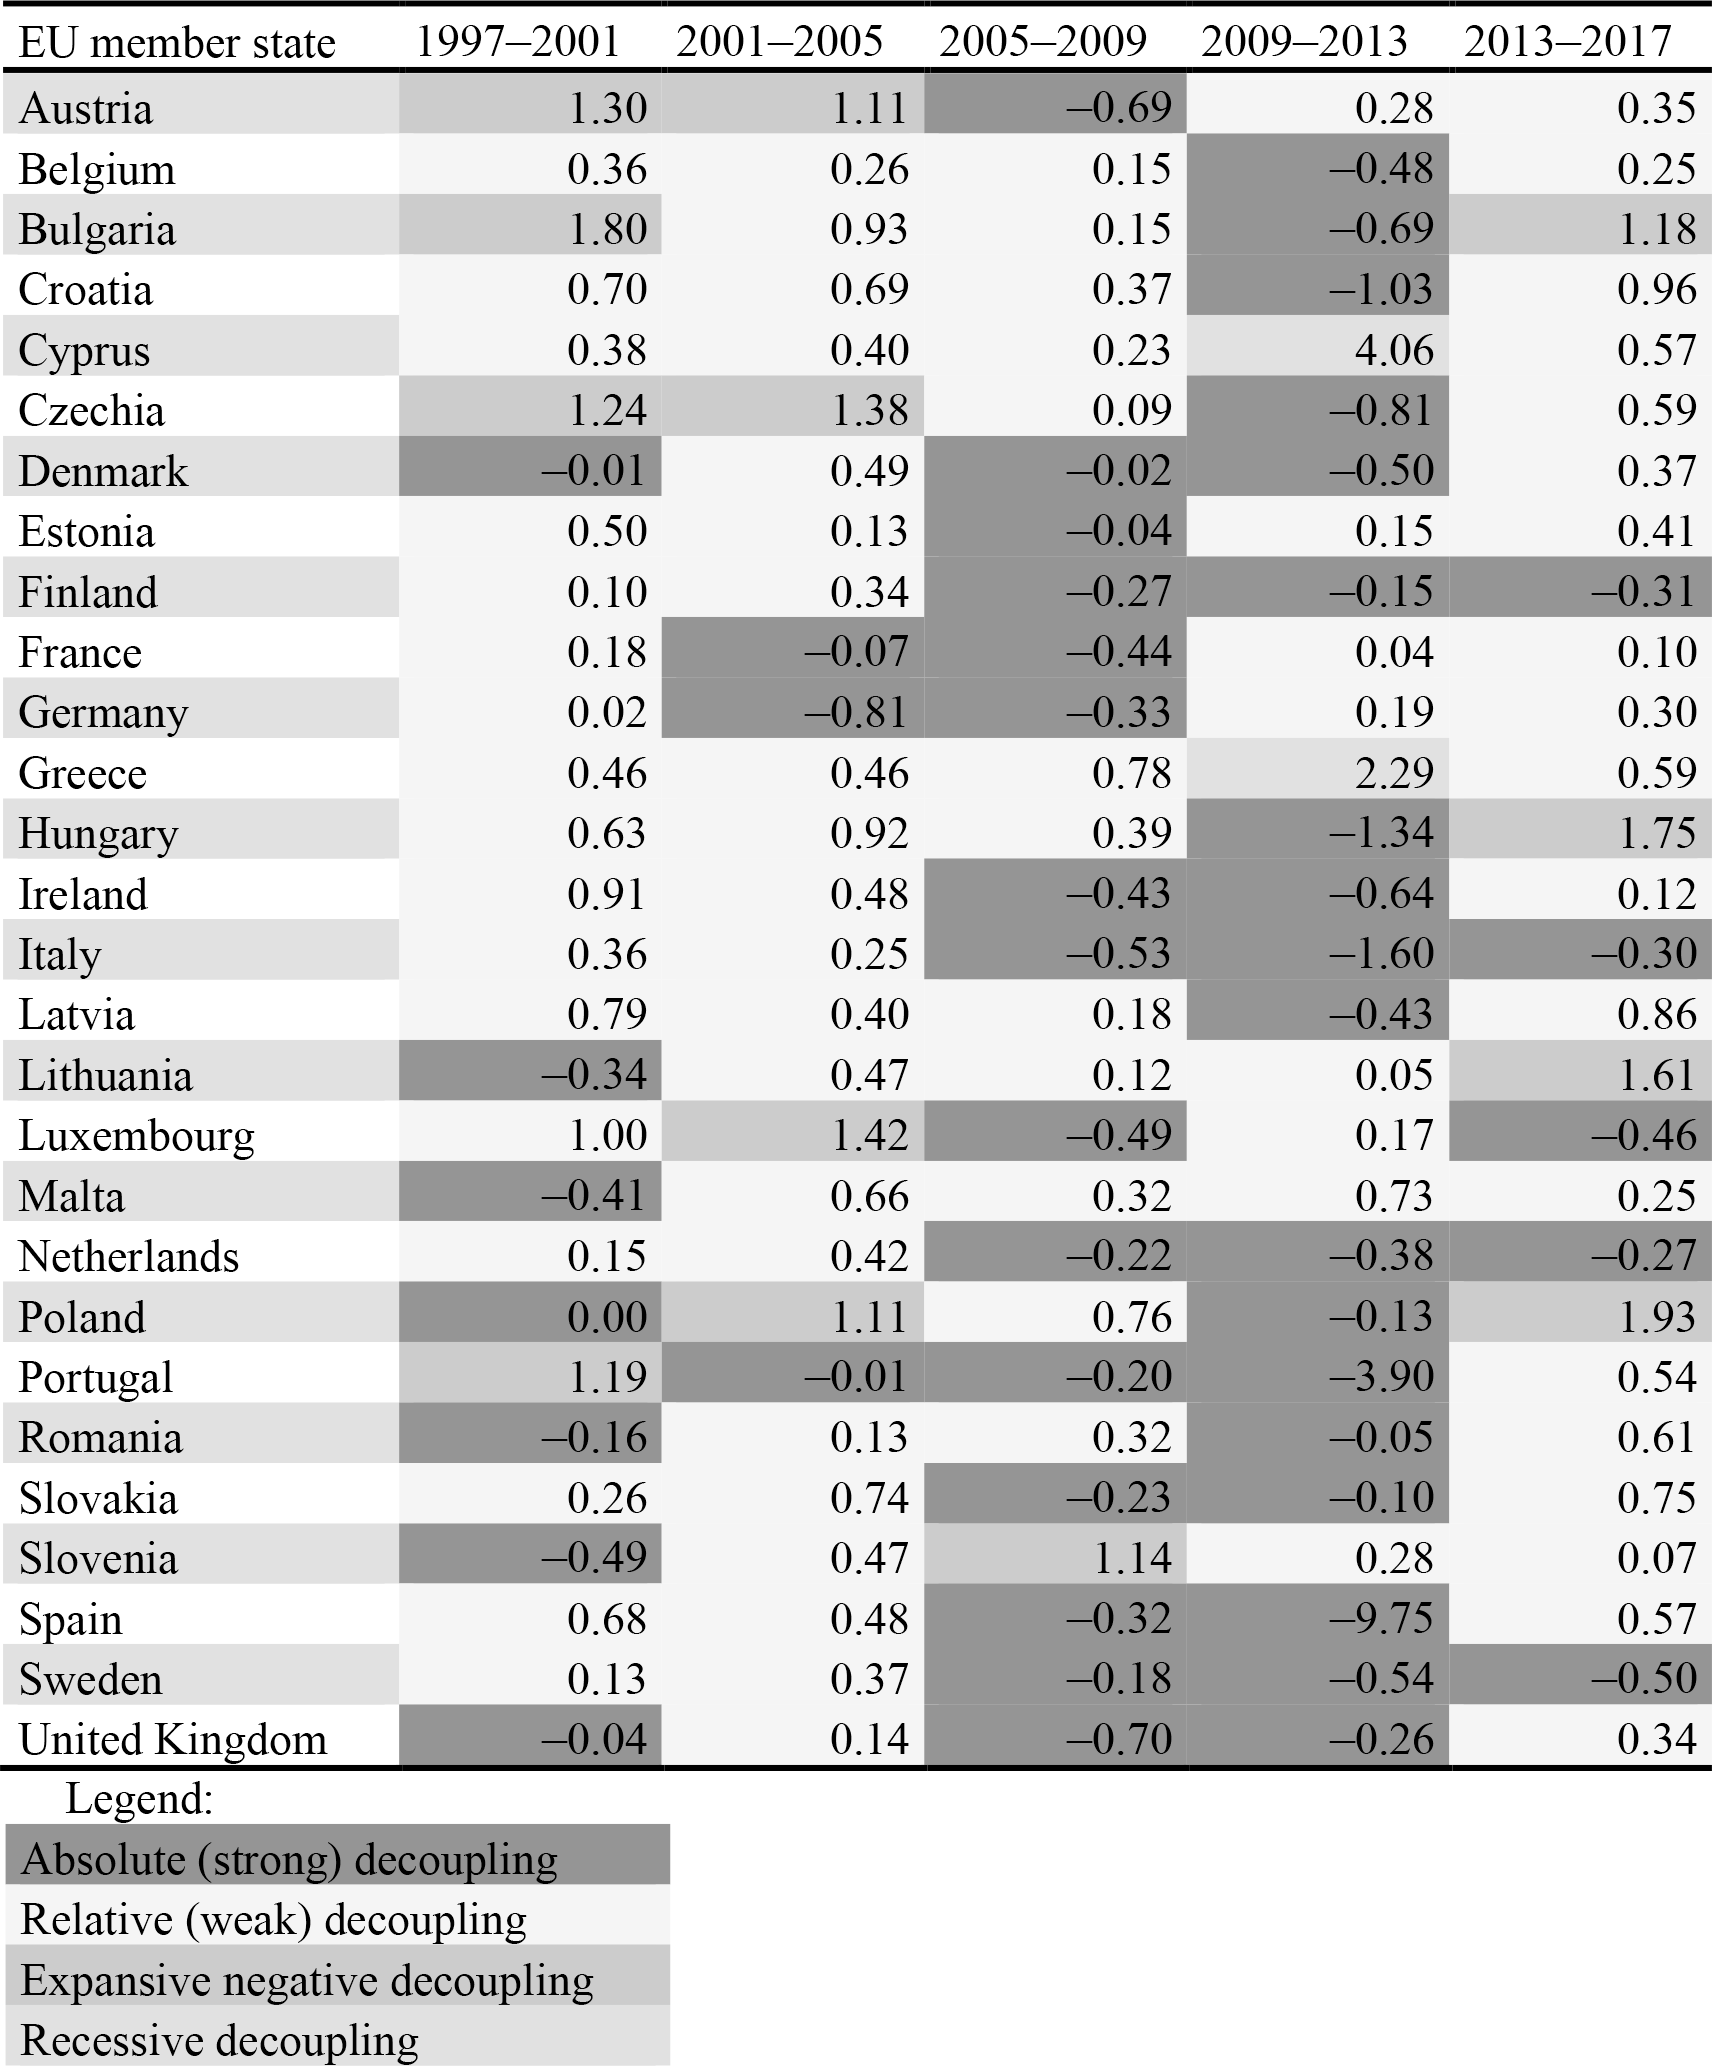
Expansive negative decoupling reflects the high rate of economic growth associated with the increase in traffic intensity and the even greater increase in transport-related GHG emissions. During the studied period, there were detected 13 cases (9%) of expansive relative decoupling, relatively evenly distributed between the examined intervals, with the exception of the period 2005–2009, where there is only one case and the period 2009–2013, where there is no case of expansive negative decoupling. This is a period of the financial and economic crisis in which none of the European countries have experienced high economic activity.
Recessive decoupling occurs in only two cases, namely Greece and Cyprus in the period 2009–2013. This is the period after the financial crisis, which significantly affected the economic development of both countries.
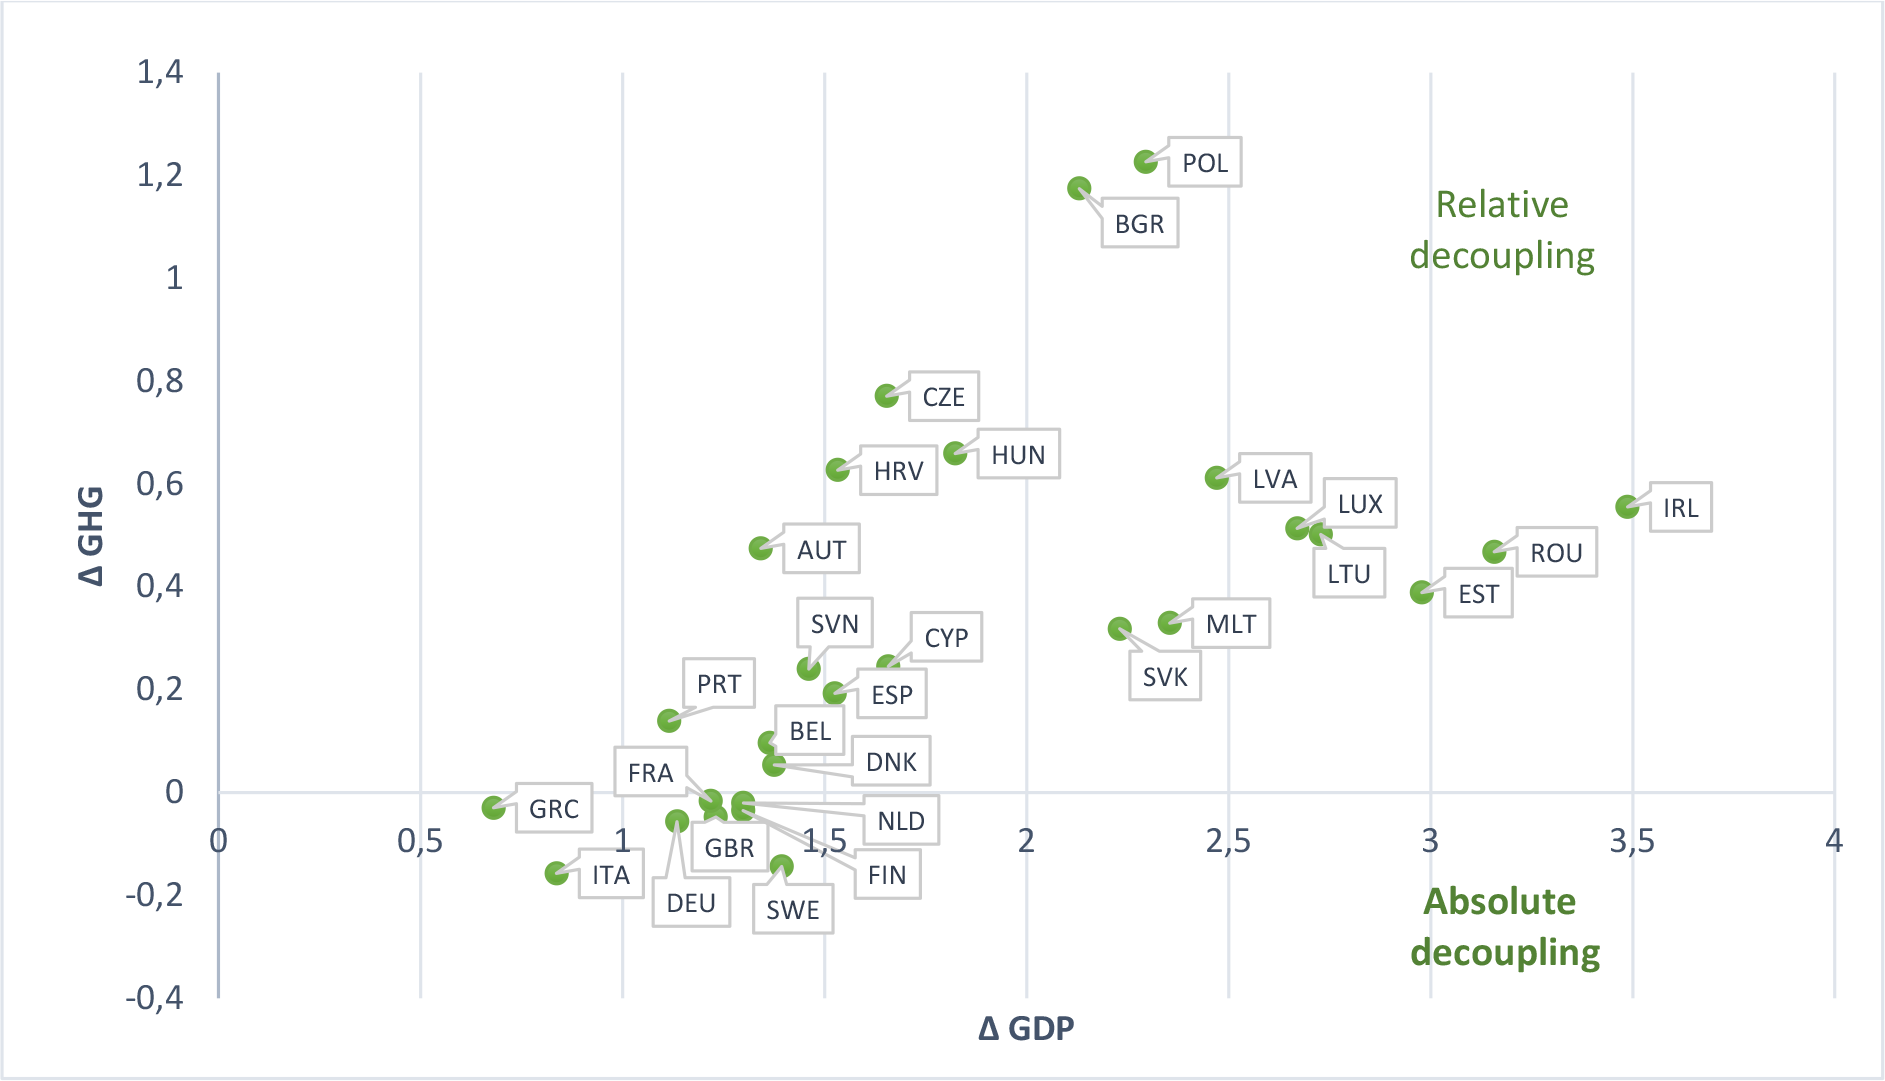
In the next part of our analysis, a summary decoupling index for individual European countries is calculated, where we worked with boundary values, i.e. t (2017) and t–1 (1997). The calculated decoupling indicator allows constructing a country ranking according to the size of the achieved degree of decoupling.
As can be seen from Table 3, the results of the decoupling index for individual EU countries are not very favourable in the long run. Only 8 countries achieved absolute (strong) decoupling in the whole evaluated period 1997–2017, namely Italy, Sweden, Germany, Greece, United Kingdom, Finland, Netherland, and France. These countries have managed to achieve economic growth without simultaneously increasing transport-related GHG emissions. These results are also consistent with the studies of Alises et al. [28] and Sorrell [26].
Decoupling index and country ranking (1997-2017)
| Country | ∆Et | ∆Gt | DIt | Decoupling stage | Ranking |
|---|---|---|---|---|---|
| Italy | –0.15705 | 0.836387 | –0.18777 | Absolute (strong) decoupling | 1 |
| Sweden | –0.14374 | 1.39383 | –0.10312 | Absolute (strong) decoupling | 2 |
| Germany | –0.05667 | 1.134713 | –0.04994 | Absolute (strong) decoupling | 3 |
| Greece | –0.02949 | 0.680658 | –0.04333 | Absolute (strong) decoupling | 4 |
| United Kingdom | –0.04751 | 1.231052 | –0.03859 | Absolute (strong) decoupling | 5 |
| Finland | –0.03506 | 1.298298 | –0.027 | Absolute (strong) decoupling | 6 |
| Netherlands | –0.02023 | 1.299204 | –0.01557 | Absolute (strong) decoupling | 7 |
| France | –0.01648 | 1.21877 | –0.01352 | Absolute (strong) decoupling | 8 |
| Denmark | 0.053767 | 1.375553 | 0.039087 | Relative (weak) decoupling | 9 |
| Belgium | 0.096866 | 1.364541 | 0.070988 | Relative (weak) decoupling | 10 |
| Portugal | 0.139129 | 1.115516 | 0.124721 | Relative (weak) decoupling | 11 |
| Spain | 0.192976 | 1.5255 | 0.1265 | Relative (weak) decoupling | 12 |
| Estonia | 0.388883 | 2.97817 | 0.130578 | Relative (weak) decoupling | 13 |
| Malta | 0.329529 | 2.354239 | 0.139973 | Relative (weak) decoupling | 14 |
| Slovakia | 0.318527 | 2.230406 | 0.142811 | Relative (weak) decoupling | 15 |
| Cyprus | 0.245417 | 1.657763 | 0.148041 | Relative (weak) decoupling | 16 |
| Romania | 0.468255 | 3.157272 | 0.14831 | Relative (weak) decoupling | 17 |
| Ireland | 0.555495 | 3.487366 | 0.159288 | Relative (weak) decoupling | 18 |
| Slovenia | 0.240291 | 1.460971 | 0.164473 | Relative (weak) decoupling | 19 |
| Lithuania | 0.501909 | 2.727932 | 0.183989 | Relative (weak) decoupling | 20 |
| Luxembourg | 0.513792 | 2.669545 | 0.192464 | Relative (weak) decoupling | 21 |
| Latvia | 0.611984 | 2.470548 | 0.247712 | Relative (weak) decoupling | 22 |
| Austria | 0.474944 | 1.342358 | 0.353813 | Relative (weak) decoupling | 23 |
| Hungary | 0.65933 | 1.82326 | 0.361621 | Relative (weak) decoupling | 24 |
| Croatia | 0.626928 | 1.532513 | 0.409085 | Relative (weak) decoupling | 25 |
| Czechia | 0.770858 | 1.653707 | 0.46614 | Relative (weak) decoupling | 26 |
| Poland | 1.226651 | 2.295111 | 0.534462 | Relative (weak) decoupling | 27 |
| Bulgaria | 1.174275 | 2.130356 | 0.551211 | Relative (weak) decoupling | 28 |
Other countries achieved relative decoupling during the period under review, which can be considered a partial success, as continuous economic growth was associated with growth in GHG emissions, but these grew at a slightly slower pace.
A graphical representation of the results of the decoupling analysis is presented in Figure 4.
Distribution of the EU countries into decoupling stages
As part of the evaluation of the entire group of EU countries, the dependence between economic growth and transport-related GHG emissions was determined, using correlation and regression analysis. The results of the correlation analysis suggest that the dependence between the monitored variables was not confirmed within the entire observed period 1997–2017 (R = 0.10).
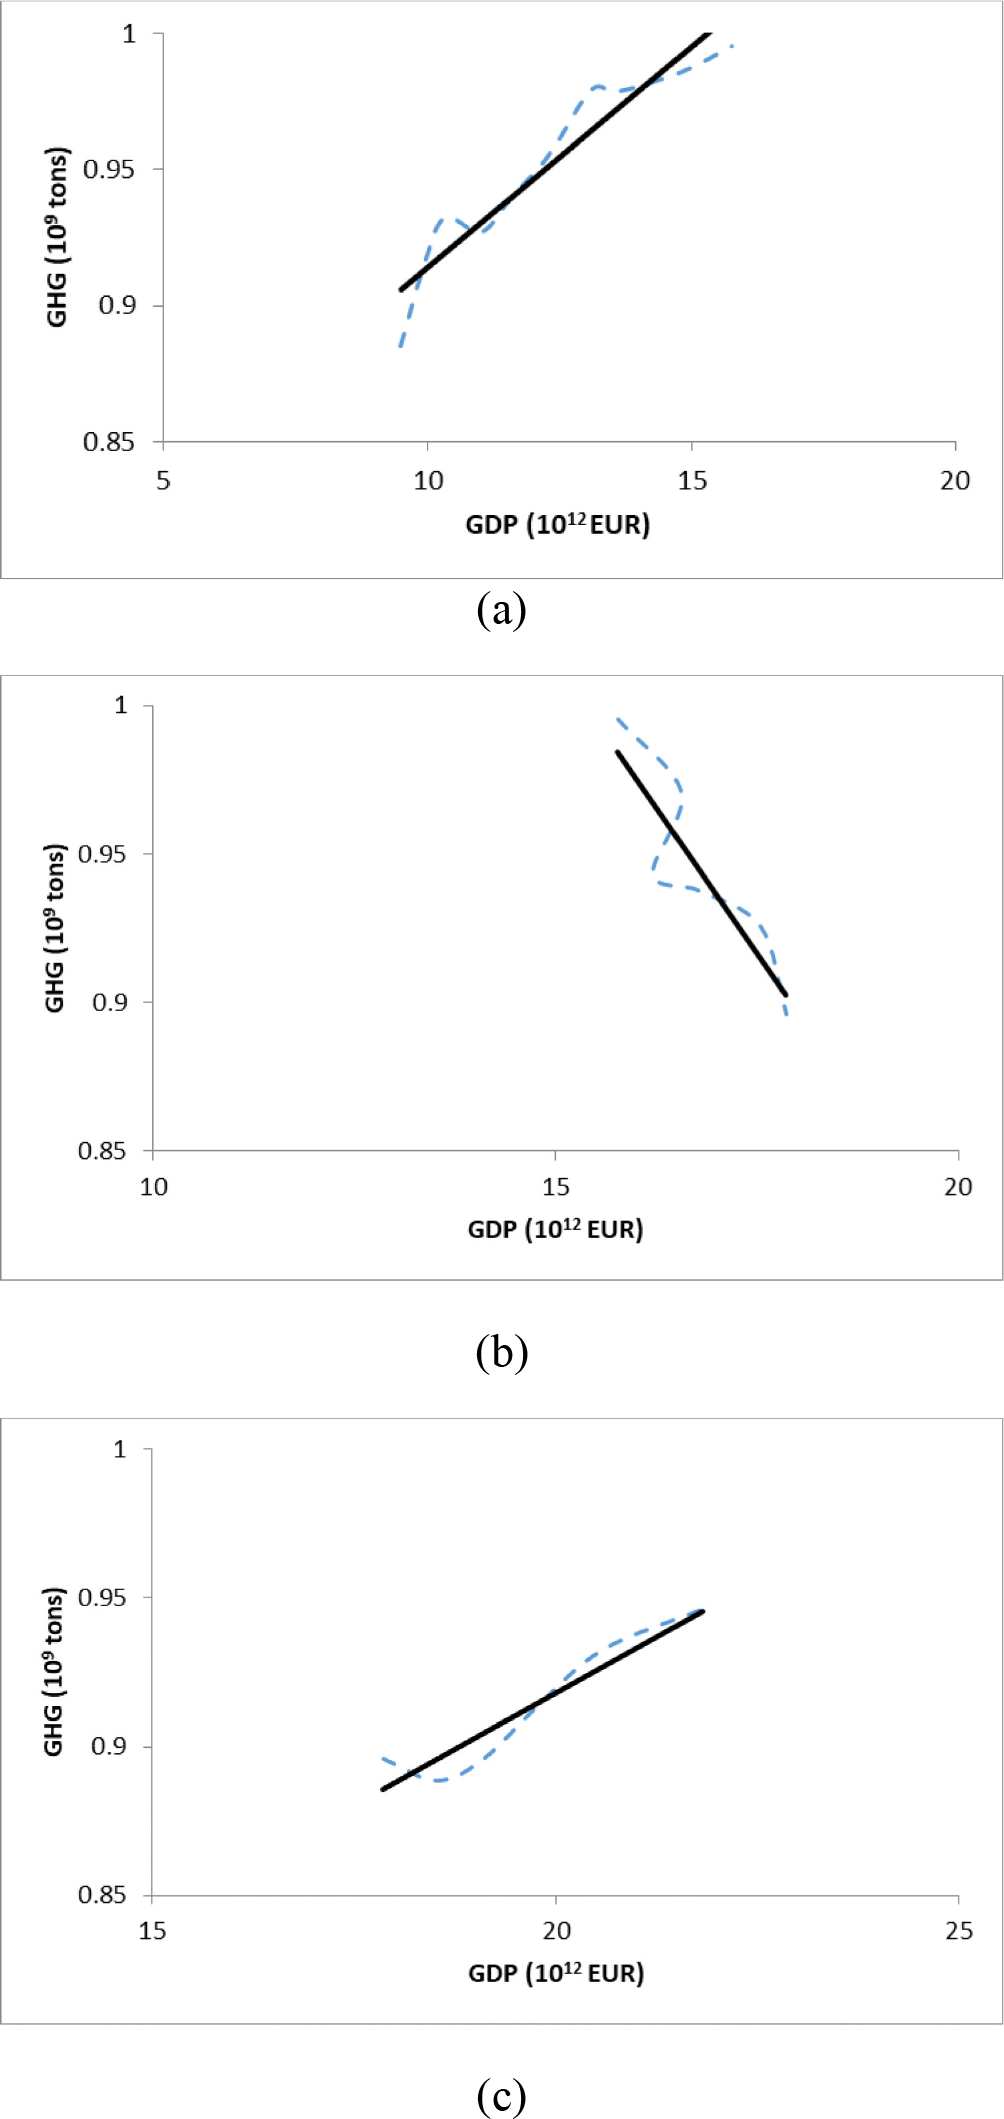
The period under review was characterized by several turbulences due to the financial and economic crisis. However, when dividing this period into smaller parts, there can be found a positive correlation in the period from 1997–2007 (Figure 5a) and also from 2012–2017 (Figure 5c) (in both cases R = 0.95). The statistical significance of the correlation coefficient for both of these periods was confirmed by the tests. During this period, EU countries manage to expand economically, but at the same time, this growth also brings an increase in transport-related GHG emissions. This analysis also confirms the previous findings that there is only a relative decoupling of transport-related GHG emissions from economic growth within EU countries.
Subsequently, a correlation analysis of the EU countries in the period 2007–2012 was performed, i.e. the period when the consequences of the financial and economic crisis became evident. The results of the analysis confirm the negative dependence of the monitored variables (R = -0.90). The significance of the coefficient was also confirmed by the test. During this period, despite of slight but continuing economic growth there is a significant decrease in transport-related GHG emissions. This period represents the decreasing part of the Environmental Kuznets Curve (Figure 5b).
Figure 5 shows the course of emissions depending on the economic development within the sub-monitored periods. Using regression analysis, the development trend in these periods was calculated.
The x-axis shows GDP in EUR billions (1012), the y-axis shows transport-related GHG emission in milliards (109) of tons. The dashed line shows the real values and the solid line is the development trend obtained by regression analysis.
Development trend of the relationship between economy and transport-related GHG emissions in sub-monitored periods: 1997–2007 (a); 2007–2012 (b); 2012–2017 (c)
The question remains whether the current observed rate of decoupling in the European Union corresponds to an increase in long-term climate change mitigation ambitions. In December 2019, the European Council decided on the goal of achieving climate neutrality by 2050 in line with the Paris Agreement [48], a commitment that will also be reflected in the currently proposed European Climate Law [49]. In this proposal, European Commission announced its intention to increase the Union's greenhouse gas emission reduction target for 2030 from 40% to 50–55% emission reduction compared with 1990 levels. If the countries of the European Union really want to aim at "net zero" in terms of carbon emissions by the middle of the 21st century, it requires some kind of qualitative breakthrough, systematic and continual decarbonisation of the economy, the higher level decoupling.
It is also worth noticing the fact that in practice it is much easier to achieve emission savings at the beginning of the timeline (thanks to the so-called low-hanging fruits). On the contrary, EU forecasts predict an accelerating pace of decarbonisation after 2030.
The European Commission underlines that all Union policies should contribute to the climate-neutrality objective and that all sectors should play their part [49]. Based on previous empirical research, the majority of sectors including energy [50], industry [55] and agriculture [56] have been successful in their decarbonisation efforts and many countries already achieved absolute decoupling. Especially in case of energy sector, a vast number of evidence from different countries and regions, e.g., V4 (Visegrád Group) countries [51], [52], Baltic states [53] and Danube region countries [54] confirms that decoupling of carbon emissions from economic growth from is possible. However, as the results of our research show, it is not the case of the transport sector, where GHG emissions still have a growing tendency.
The emerging trend of (limited) decoupling of the transport-related GHG emissions and economic growth in the European Union in recent years may be helped in the future by greater use of mitigation measures. These can be based on carbon charging, such as the EU ETS (Emissions Trading System) – the intended European carbon taxes at the national level, on fixed standards (tightening emission limits for newly manufactured vehicles) or on investment and operational support for emission savings and low-emission and renewable energy sources in transport.
However, technological innovation cannot be seen as a silver bullet for all sustainability issues caused by transport. Mattioli [57] points out that the 20th century brought a huge number of technological improvements, however, these were offset by the “human factor” (in terms of increased travel distances, increased car modal share, decreased vehicle occupancy rates, and a shift towards larger and more fuel-intensive vehicles). This so-called rebound effect occurs when savings in fuel consumption and production of emissions brought by technological innovations may not lead to minimizing the travel or energy consumption of individuals, households, and companies, but rather to their increase [58]. Therefore Schwanen [59] calls for the concepts that disrupt habitual thinking, based on oil-dependent transport configuration typical for the mid-20th century.
The use of decoupling in the assessment of sustainable development has several benefits: it is relatively simple and easy to understand and provides a quantifiable view of the relationship between economic growth and the associated environmental impacts. Due to the quantification of the decoupling index, we can assess the sufficiency of decoupling strategies and achieving the goals of environmental sustainability. It allows us to track the trends, compare the decoupling development among countries, and set appropriate decoupling strategies, policies, and targets. Nevertheless, it is necessary to mention the limits of the use of this method. The first shortcoming may be the division of the observed period into shorter time intervals. The results may be skewed due to the selection of boundary values for each time interval. Another limiting factor of this method is that the evaluation does not consider the biological capacity of the evaluated countries, i.e. the ability to absorb or cope with the environmental pressures associated with economic activity in a particular country.
Even achieving absolute (strong) decoupling does not automatically mean a reduction in negative environmental impacts, while the economy is growing. Especially in the case of developed economies (such as EU countries), which have shifted from production-oriented economies to service-oriented economies, growth in imports of semi-finished or finished products is typical. In this case, negative externalities occur in other (production-oriented) countries. Developed countries may thus appear to be more energy and material efficient, as they produce fewer emissions per unit of GDP. Globally, however, the same (or greater) pollution is produced, but off-shored.
Another disadvantage (but not just of the decoupling method) is the use of GDP. Although this paper may not have the ambition to address in-depth the issue of economic performance indicators, it is desirable to summarize the main shortcomings of GDP as the main standardized metric. By its very nature, GDP cannot measure: negative externalities (environmental, health, etc.); non-market transactions (household or family services, barter); income inequality; accumulated wealth; the value of freely shared information; sustainability in any sense of the word.
Against this background, the often recurring question is to what extent it makes sense to use GDP as the proper metric for the success of the economic unit and/or quality of life. Possible missing evidence of adequate decoupling analysis can then serve as a supporting argument for abandoning this metric and searching for other alternatives that can be used, e.g., Human Development Index (HDI), Genuine Progress Indicator (GPI), Gross National Happiness (GNH), etc.
Although the European Union has been able to expand economically while reducing its emission footprint in recent decades, as soon as growth exceeded a certain level, greenhouse gas emissions also began to stagnate or grow. At the same time, the current European climate ambitions, led by the goal of climate neutrality by the middle of the 21st century, call for a several-fold acceleration of the observed rate of transport-related emission savings.
The analysis of decoupling of transport-related GHG emissions and economic growth shows that although some countries experienced absolute (strong) decoupling in certain time periods, in the long run (in the period 1997–2017) only eight European countries (Italy, Sweden, Germany, Greece, United Kingdom, Finland, Netherlands, and France) achieved this stage of decoupling. Other European countries achieved only relative (weak) decoupling during this period. This may seem like a partial success, as emissions are rising but slower than economic growth. However, in the light of the EU's high ambitions to achieve climate neutrality by the middle of the century, a business as usual (or more precisely transport as usual) approach will not be possible.
The contraction of the economy caused by the current coronavirus crisis may have the similar impact – from a climate policy perspective –. as the financial and the economic crisis of 2008, which led to a dramatic (albeit only temporary) downward shift in GHG emission curves. Despite all negatives associated with the crisis, this can be seen as an opportunity also for the transport sector to embark on a trajectory leading to the fulfilment of Europe's climate ambitions in the coming decades.
| DI | decoupling index | |
| E | emission production | [t/year] |
| G | economic variable | [EUR/year] |
| GDP | Gross Domestic Product | [EUR/year] |
| R | correlation coefficient | |
| t | time | [4 years], [10 years] |
| ΔE | change in the rate of GHG emissions | |
| ΔG | change in the rate of economic growth |
Subscript
| t | at time t |
Abbreviations
| EKC | Environmental Kuznets Curve |
| GHG | Greenhouse Gas |
| SDG | Sustainable Development Goal |
This work was supported by the Scientific Grant Agency of the Ministry of Education, Science, Research and Sport of the Slovak Republic and the Slovak Academy of Sciences under grant VEGA 1/0508/21.
- National accounts aggregates by industry (up to NACE A*64), https://appsso.eurostat.ec.europa.eu/nui/show.do?dataset=nama_10_a64&lang=en, [Accessed: 02-March-2021]
- National accounts employment data by industry (up to NACE A*64), http://appsso.eurostat.ec.europa.eu/nui/show.do?dataset=nama_10_a64_e&lang=en, [Accessed: 02-March-2021]
- Transport: increasing oil consumption and greenhouse gas emissions hamper EU progress towards environment and climate objectives, https://www.eea.europa.eu/publications/transport-increasing-oil-consumption-and, [Accessed: 02-March-2021]
- Sustainable Mobility for the 21st Century, http://www.worldbank.org/en/news/feature/2017/07/10/sustainable-mobility-for-the-21st-century%3E, [Accessed: 03-March-2021]
- 5th Assessment Report (AR5), http://www.ipcc.ch/report/ar5, [Accessed: 08-January-2021]
- , The First and Last Mile — the Key to Sustainable Urban Transport. Publications. Luxembourg; 2019
- ,
(De)coupling Analysis with Focus on Energy Consumption in EU Countries and Its Spatial Evaluation, ,Polish J Environ Stud. , Vol. 29 (3),pp 2091-2100 , 2020, https://doi.org/https://doi.org/10.15244/pjoes/110613 - ,
The Driving Forces of Change in Environmental Indicators: An Analysis Based on Divisia Index Decomposition Techniques ,Lect Notes Energy , 2014, https://doi.org/https://doi.org/10.1007/978-3-319-07506-8 - White paper European transport policy for 2010: time to decide. (COM(2001) 370 final), https://ec.europa.eu/transport/sites/transport/files/themes/strategies/doc/2001_white_paper/lb_com_2001_0370_en.pdf, [Accessed: 12-February-2021]
- White paper Roadmap to a Single European Transport Area – Towards a competitive and resource efficient transport system (COM/2011/0144 final), https://eur-lex.europa.eu/legal-content/EN/TXT/HTML/?uri=CELEX:52011DC0144&from=EN, [Accessed: 12-February-2021]
- ,
Communication from the Commission to the European parliament, the council, the European economic and social committee and the committee of the regions. A Roadmap for moving to a competitive low carbon economy in 2050 (COM/2011/0112 final) , https://eur-lex.europa.eu/legal-content/EN/TXT/HTML/?uri=CELEX:52011DC0112&from=EN, EC, [Accessed: 12-February-2021] - Energy Roadmap 2050. Luxembourg; 2012, https://ec.europa.eu/energy/sites/ener/files/documents/2012_energy_roadmap_2050_en_0.pdf, [Accessed: 15-February-2021]
- Directive 2014/94/EU of the European Parliament and of the Council of 22 October 2014 on the deployment of alternative fuels infrastructure. Text with EEA relevance, https://eur-lex.europa.eu/legal-content/EN/TXT/HTML/?uri=CELEX:32014L0094&from=EN, [Accessed: 15-February-2021]
- Regulation (EU) 2019/631 of the European Parliament and of the Council of 17 April 2019 setting CO2 emission performance standards for new passenger cars and for new light commercial vehicles, and repealing Regulations (EC) No 443/2009 and (EU) No 510/201, https://eur-lex.europa.eu/legal-content/EN/TXT/PDF/?uri=CELEX:32019R0631&from=EN, [Accessed: 15-February-2021]
- Directive (EU) 2019/1161 of the European Parliament and of the Council of 20 June 2019 amending Directive 2009/33/EC on the promotion of clean and energy-efficient road transport vehicles, https://eur-lex.europa.eu/legal-content/EN/TXT/PDF/?uri=CELEX:32019L1161&from=EN, [Accessed: 15-February-2021]
- Directive 2002/49/EC of the European Parliament and of the Council of 25 June 2002 relating to the assessment and management of environmental noise, https://eur-lex.europa.eu/legal-content/EN/TXT/PDF/?uri=CELEX:32002L0049&from=EN, [Accessed: 18-February-2021]
- , The European Environment — State and Outlook 2020, Knowledge for Transition to a Sustainable Europe, 2019
- ,
Rethinking Economic Energy Policy Research –Developing Qualitative Scenarios to Identify Feasible Energy Policies ,J. sustain. dev. energy water environ. syst. , Vol. 9 (2),pp 1080331 , 2021, https://doi.org/https://doi.org/10.13044/j.sdewes.d8.0331 - Communication from the Commission to the European Parliament, the European Council, the Council, the European Economic and Social Committee, the Committee of the Regions and the European Investment Bank: A Clean Planet for all A European strategic long-te, https://eur-lex.europa.eu/legal-content/EN/TXT/HTML/?uri=CELEX:52018DC0773&from=EN, [Accessed: 18-February-2021]
- ,
Eco-efficiency indicators for urban transport ,J. Sustain. Dev. Energy, Water Environ. Syst. , Vol. 3 (2),pp 183–195 , 2015, https://doi.org/https://doi.org/10.13044/j.sdewes.2015.03.0015 - ,
Environmental impacts of promoting new public transport systems in urban mobility: A case study ,J. Sustain. Dev. Energy, Water Environ. Syst. , Vol. 5 (3),pp 377–395 , 2017, https://doi.org/https://doi.org/10.13044/j.sdewes.d5.0143 - ,
Communication from the Commission to the European Parliament, the Council, the European Economic and Social Committee and the Committee of the Regions: Sustainable and Smart Mobility Strategy – putting European transport on track for the future , https://ec.europa.eu/transport/sites/default/files/legislation/com20200789.pdf, EC, [Accessed: 02-July-2021] - ,
Towards a theory of decoupling: Degrees of decoupling in the EU and the case of road traffic in Finland between 1970 and 2001 ,Transp Policy , Vol. 12 (2),pp 137-151 , 2005, https://doi.org/https://doi.org/10.1016/j.tranpol.2005.01.001 - ,
The economics of the greenhouse effect: Evaluating the climate change impact due to the transport sector in Italy ,Energy Policy , Vol. 28 (13),pp 957-966 , 2000, https://doi.org/https://doi.org/10.1016/S0301-4215(00)00078-1 - ,
Decoupling of road freight transport and economic growth trends in the UK: An exploratory analysis ,Transp Rev. , Vol. 27 (1),pp 37-64 , 2007, https://doi.org/https://doi.org/10.1080/01441640600825952 - ,
The Rebound Effect: An Assessment of the Evidence for Economy-Wide Energy Savings from Improved Energy Efficiency , 2007, https://doi.org/https://doi.org/1-903144-0-35 - , Decoupling the Link between Economic Growth, Transport Growth and Carbon Emissions in Scotlan, 2006
- ,
Road freight transport decoupling: A comparative analysis between the United Kingdom and Spain ,Transp Policy , Vol. 32 ,pp 186-193 , 2014, https://doi.org/https://doi.org/10.1016/j.tranpol.2014.01.013 - ,
Carbon emissions and policies in China’s building and construction industry: Evidence from 1994 to 2012 ,Build Environ , Vol. 95 ,pp 94-103 , 2016, https://doi.org/https://doi.org/10.1016/j.buildenv.2015.09.011 - ,
Decoupling relationship between economic output and carbon emission in the Chinese construction industry ,Environ Impact Assess Rev. , Vol. 71 ,pp 60-69 , 2018, https://doi.org/https://doi.org/10.1016/j.eiar.2018.04.001 - ,
Analysis of CO2 emissions in China’s manufacturing industry based on extended logarithmic mean division index decomposition ,Sustain. , Vol. 11 (1),pp 226 , 2019, https://doi.org/https://doi.org/10.3390/su11010226 - ,
Using LMDI to analyze the decoupling of carbon dioxide emissions by China’s manufacturing industry ,Environ Dev , Vol. 9 ,pp 61-75 , 2014, https://doi.org/https://doi.org/10.1016/j.envdev.2013.11.003 - ,
Decoupling indicators of CO2 emissions from the tourism industry in China: 1990-2012 ,Ecol Indic , Vol. 46 ,pp 390-397 , 2014, https://doi.org/https://doi.org/10.1016/j.ecolind.2014.06.041 - ,
Investigating the factors influencing the decoupling of transport-related carbon emissions from turnover volume in China ,Sustain. , Vol. 10 (9),pp 3034 , 2018, https://doi.org/https://doi.org/10.3390/su10093034 - ,
Reduction potentials of energy demand and GHG emissions in China’s road transport sector ,Energy Policy , Vol. 37 (2),pp 658-668 , 2009, https://doi.org/https://doi.org/10.1016/j.enpol.2008.10.008 - ,
Differences in carbon emission levels and influencing factors in the logistics industry of Beijing-Tianjin-Hebei region ,Environ Eng Manag J. , Vol. 19 (9), 2020, https://doi.org/https://doi.org/10.30638/eemj.2020.144 - ,
An analysis of decoupling and influencing factors of carbon emissions from the transportation sector in the Beijing-Tianjin-Hebei Area China ,Sustain. , Vol. 9 (5),pp 7222017 , , https://doi.org/https://doi.org/10.3390/su9050722 - ,
Decomposition analysis of energy-related carbon emissions from the transportation sector in Beijing ,Transp Res Part D Transp Environ , Vol. 42 ,pp 135-145 , 2016, https://doi.org/https://doi.org/10.1016/j.trd.2015.11.001 - ,
Factor decomposition analysis and causal mechanism investigation on urban transport CO2 emissions: Comparative study on Shanghai and Tokyo ,Energy Polic. , Vol. 107 ,pp 658-668 , 2017, https://doi.org/https://doi.org/10.1016/j.enpol.2017.02.049 - ,
Determinants of decoupling economic output from carbon emission in the transport sector: A comparison study of four municipalities in China ,Int J Environ Res Public Health , Vol. 16 (19),pp 3729 , 2019, https://doi.org/https://doi.org/10.3390/ijerph16193729 - ,
The impacts of individual behavior on household daily travel carbon emissions in Beijing, China ,Energy Procedia , Vol. 61 ,pp 1318-1322 , 2014, https://doi.org/https://doi.org/10.1016/j.egypro.2014.11.1090 - ,
Decomposition and decoupling effects of carbon dioxide emission from highway transportation in Taiwan, GermanyEnergy Policy ,Japan and South Korea , Vol. 35 (6),pp 3226-3235 , 2007, https://doi.org/https://doi.org/10.1016/j.enpol.2006.11.003 - ,
CO2 emissions from passenger transport: A comparison of international trends from 1973 to 1992 ,Energy Policy , Vol. 24 (1),pp 17-30 , 1996, https://doi.org/https://doi.org/10.1016/0301-4215(95)00148-4 - ,
Decoupling transport from economic growth: Extending the debate to include environmental and social externalities ,J Transp Geogr. , Vol. 57 ,pp 134-144 , 2016, https://doi.org/https://doi.org/10.1016/j.jtrangeo.2016.10.006 - , Indicators To Measure Decoupling of Environmental Pressure From Economic Growth, OECD Environ Program, 2002
- ,
Decomposition analysis of the decoupling indicator of carbon emissions due to fossil energy consumption from economic growth in China ,Energy Effic. , Vol. 10 (6),pp 1365-1380 , 2017, https://doi.org/https://doi.org/10.1007/s12053-017-9522-7 - ,
Beyond the question “Is there decoupling?”: A decoupling ranking ,Econstor. , 2017 - European Council meeting (12 December, 2019) – Conclusions, https://data.consilium.europa.eu/doc/document/ST-29-2019-INIT/en/pdf, [Accessed: 25-February-2021]
- Regulation of the European Parliament and of the Council establishing the framework for achieving climate neutrality and amending Regulation (EU) 2018/1999 (European Climate Law), https://eur-lex.europa.eu/legal-content/EN/TXT/HTML/?uri=CELEX:52020PC0080&from=EN, [Accessed: 25-February-2021]
- ,
Energy demand and comparison of current defrosting technologies of frozen raw materials in defrosting tunnels ,Appl Energy , Vol. 87 (8),pp 2447-2454 , 2010, https://doi.org/https://doi.org/10.1016/j.apenergy.2010.02.031 - ,
Decoupling economic growth from greenhouse gas emissions: the case of the energy sector in V4 countries ,Equilibrium , Vol. 5 (2),pp 235-251 , 2020, https://doi.org/https://doi.org/10.24136/eq.2020.011 - ,
Decoupling analysis of energy consumption and economic growth of v4 countries ,Probl Ekorozwoju , Vol. 14 (1), 2019 - , The main drivers of GHG emission reduction in Baltic States, Proceedings of Economics and Finance Conferences, International Institute of Social and Economic Sciences, 2017
- ,
Economic Development, CO2 Emissions and Energy Use Nexus-Evidence from the Danube Region Countries ,Energies , Vol. 14 ,pp 3165 , 2021, https://doi.org/https://doi.org/10.3390/en14113165 - ,
Applying ex post index decomposition analysis to final energy consumption for evaluating European energy efficiency policies and targets ,Energy Effic. , Vol. 12 (5),pp 1329-1357 , 2019, https://doi.org/https://doi.org/10.1007/s12053-018-09772-w - ,
Lithuanian achievements in terms of CO2 emissions based on production side in the context of the EU-27 ,Technol Econ Dev Econ. , Vol. 23 (3),pp 483-503 , 2017, https://doi.org/https://doi.org/10.3846/20294913.2015.1056278 - ,
Transport needs in a climate-constrained world. A novel framework to reconcile social and environmental sustainability in transport ,Energy Res Soc Sci. , Vol. 18 ,pp 118-128 , 2016, https://doi.org/https://doi.org/10.1016/j.erss.2016.03.025 - ,
Rebound effects in UK road freight transport ,Transp Res Part D Transp Environ , Vol. 63 ,pp 156-174 , 2018, https://doi.org/https://doi.org/10.1016/j.trd.2018.05.006 - ,
Transport geography, climate change and space: opportunity for new thinking ,J Transp Geogr. , Vol. 81 ,pp 102530 , 2019, https://doi.org/https://doi.org/10.1016/j.jtrangeo.2019.102530