

Energy affordability has become an increasingly critical dimension of sustainability in the context of rising energy prices, climate policy, and economic uncertainty. Energy services are essential for maintaining healthy and socially acceptable living conditions, including thermal comfort that prevents heat-related and cold-related health risks. For example, energy usage is often required to maintain a comfortable indoor temperature to avoid health risks such as heatstroke and heat shock [1]. In Japan, energy prices rose after the Fukushima Daiichi nuclear power plant accident in March 2011, and there has been a rapid increase in public concern regarding the burden of energy costs on household budgets. Economic recovery from the COVID-19 pandemic and the rise in energy prices owing to Russia's invasion of Ukraine have further increased household energy expenditures, placing additional pressure on household budgets. In many countries, recent energy price shocks - driven by geopolitical conflict, inflationary pressures, and decarbonisation policies such as carbon pricing - have intensified concerns about household vulnerability to energy costs, particularly among low-income and socially vulnerable groups.
A substantial body of literature has examined fuel or energy poverty as a framework for understanding such vulnerability. Early conceptual work, notably by Boardman [2], established fuel poverty as a condition in which households are unable to secure adequate energy services at reasonable cost, laying the foundation for policy-oriented indicators. Subsequently, two indicator traditions have become dominant in applied research and policy practice: the “10% indicator,” which defines fuel poverty based on the share of energy expenditure in household income, and the Low-Income High-Cost (LIHC) indicator, which combines relative income thresholds with above-median energy costs [3]. These approaches have been widely adopted, particularly in Europe, and have informed national monitoring systems and policy interventions.
Carbon pricing and energy-price shocks can accelerate decarbonisation, yet they may also widen energy affordability gaps and increase the risk of energy/fuel poverty among vulnerable households, undermining the “just transition” objective unless distributional safeguards are embedded in policy design [4], [5]. Recent international studies have demonstrated that climate and energy policies, while essential for decarbonisation, can exacerbate energy poverty unless distributional safeguards are embedded in policy design. Despite the growing literature on fuel/energy poverty indicators, the diversity and complexity of existing measures often limit their practical use as sustainability indicators for timely monitoring and policy communication [3], [6]. Many studies have been conducted on policy evaluations using fuel poverty indicators. Vandyck et al. [5] combines policy review and quantitative scenario analysis to examine EU climate policies through an energy‑poverty lens. Using an affordability‑based definition of energy poverty and EU household data, the authors simulate the distributional impacts of carbon pricing. They show that climate policies can increase energy poverty unless revenue‑recycling and income‑targeted compensation schemes are applied, and that well‑designed recycling could lift over one million households out of energy poverty. Martín‑Consuegra et al. [7] developed a multidimensional fuel poverty index by integrating urban deprivation indicators with fuel‑poverty‑specific variables. Using spatial analysis and cross‑referenced secondary datasets from Madrid’s Urban Deprivation Observatory, they map fuel poverty at neighbourhood scale. The results show that poor building thermal quality is a key driver of vulnerability and demonstrate the value of multidimensional, area‑based approaches for urban policy targeting. Olang et al. [8] applied a household survey, energy‑stacking analysis, and a multidimensional energy poverty (MEP) index to study lighting and cooking fuel choices in Kisumu, Kenya. The authors find that fuel choice depends not only on access but also on usage preferences and appliance characteristics. Reaños et al. [9] Used a bespoke survey of Irish homeowners and econometric analysis, this study investigates links between financial literacy, energy efficiency, and fuel poverty. While higher energy efficiency is associated with lower fuel poverty, financial literacy shows only a weak direct effect. Income emerges as the dominant factor, and administrative barriers to retrofit schemes are identified as major constraints, suggesting limits of efficiency‑only policy approaches. Shabbir et al. [10] employed national household survey data (PSLM, Pakistan) and a multidimensional energy poverty framework to assess impacts on social wellbeing and financial outcomes. Empirical analysis shows that energy‑poor households face worse health, lower education attainment, and fewer employment opportunities. The results highlight strong links between fuel type, renewable energy access, and family prosperity, positioning energy poverty as a development and social justice issue. Nadimi et al. [11] propose an Energy Poverty Possibility Indicator combining affordability thresholds with clustering techniques and show that energy price spikes following recent global shocks have widened regional disparities in energy poverty within Japan, while coordinated price stabilisation and targeted income support can effectively reduce household burdens. Complementing this quantitative evidence, Koga [12] provides qualitative insights from Sapporo City, demonstrating that energy deprivation is often underestimated within the Japanese social welfare system due to limited institutional recognition of energy needs and households’ tendency to downplay their own difficulties. These findings suggest that without clear and operational indicators, energy vulnerability may remain hidden within existing welfare frameworks. At the policy‑design level, Cui and Wu [13] analyse the distributional impacts of the EU Emissions Trading System for buildings and transport using a multiregional input–output model, showing that targeted rebates or fuel‑specific subsidies are more effective in protecting vulnerable households than uniform compensation. Together, these studies emphasise the importance of translating energy price changes and policy interventions into distributional outcomes that are readily interpretable by policymakers.
Recent review studies, however, have highlighted persistent limitations in the current state of the art. Brabo‑Catala et al. [3] systematically reviewed fuel poverty indicators and concluded that, while multidimensional indices capture diverse aspects of deprivation, their complexity often limits transparency, interpretability, and practical uptake by policymakers.
Similarly, a growing body of research has examined the impacts of rising energy prices using macro‑level economic data and aggregate indicators. For example, Čermáková and Hromada [14] quantify how the combined costs of acquiring and operating housing using primary Czech data within a housing affordability framework. Their results indicate a marked deterioration in owner-occupied affordability, driven by large regional increases in purchase prices and a sharp rise in energy prices, with distributional implications that extend into the middle class, thereby motivating policy attention to energy poverty as an integral component of housing policy. Kilian and Zhou [15] focus on the macro transmission of energy price movements through retail gasoline prices. They find sizable but short-lived effects on headline inflation and limited effects on core inflation and long-run expectations, implying that concerns about a lasting de-anchoring of inflation expectations from an oil-price surge are overstated. These papers suggest a scale-sensitive policy lesson: stabilizing headline inflation does not guarantee relief from energy-driven welfare losses, because even when macro pass-through fades, energy costs embedded in housing and other fixed expenditures can persistently erode affordability and amplify vulnerability. While these studies make a significant contribution to fuel/ energy poverty policies, fundamental challenges still exist: the impact of rising energy prices on household finances is difficult to understand from a macro perspective using statistical data. It is possible that the true nature of the problem will not be understood without empirical analysis from a micro perspective along with consideration of human welfare, the environment, and the economy. These comparative and policy-focused studies have shown that many existing indicators are poorly suited for rapid assessment of distributional impacts under sudden energy price shocks, such as those induced by carbon pricing or supply disruptions. As a result, there remains a gap between academically sophisticated fuel poverty metrics and indicators that can be operationalised as sustainability indicators for timely policy design, communication, and adjustment.
Three specific research gaps can be identified from the recent literature. First, existing fuel and energy poverty indicators often involve complex, multidimensional constructions that hinder their use as simple and communicable sustainability indicators, particularly at the local and regional policy level. Second, most indicators are not explicitly designed to evaluate short‑term energy price shocks or policy‑induced price changes, despite growing recognition that carbon pricing and energy market volatility can generate abrupt affordability stress for households. Third, behavioural energy‑saving measures (e.g. changes in appliance usage) and income‑based policy interventions (e.g. subsidies or transfers) are typically analysed separately, making it difficult for policymakers to compare their effectiveness within a unified analytical framework.
Against this background, the present study contributes to the literature by advancing a policy‑relevant fuel poverty indicator framework that addresses these gaps. This study aims to propose a policy-relevant sustainability-indicator approach by empirically quantifying household vulnerability to rising energy prices in Japan and translating mitigation options into changes in the fuel-poor headcount. Building on the established 10% and LIHC traditions, this study employs a transparent, hybrid fuel poverty index that bridges expenditure‑based and income‑based thresholds, thereby retaining conceptual continuity with existing approaches while enhancing operational simplicity. The key methodological contribution lies in demonstrating how this indicator can be used not only to identify fuel‑poor households, but also to quantify the effects of both behavioural energy‑saving measures and income support policies within a single, interpretable metric.
Importantly, this study treats regional electricity service areas not as the object of the hypothesis, but as case studies to test a broader methodological proposition: that a simple, indicator‑based approach can function as a sustainability indicator for monitoring household vulnerability under energy price shocks and evaluating compensatory policy options. Two major electricity service areas in Japan - those served by the Tokyo Electric Power Company (TEPCO) and the Kyushu Electric Power Company (Kyuden) - are used to empirically examine how differences in income distribution, energy expenditure patterns, and behavioural responses influence fuel poverty outcomes under rising energy prices. By situating a case‑based empirical analysis within a generalisable indicator framework, this study seeks to contribute methodological knowledge rather than merely documenting localised conditions. Specifically, it addresses the scientific challenge of translating abstract fuel poverty concepts into policy‑ready sustainability indicators capable of supporting “just transition” objectives. In doing so, the study provides new insights into how simple, transparent indicators can be used to assess distributional impacts of energy price increases and to inform integrated energy and social policy design in contexts facing carbon‑pricing‑related shocks.
The remainder of this article is structured as follows. Section 2 presents the analytical framework and methodological approach, including the construction of the fuel poverty indicator, data sources, and simulation design. Section 3 reports the empirical results and discusses their implications, with particular attention to regional differences and the drivers of household vulnerability under rising energy prices. Section 4 concludes the article by summarizing the key scientific findings, highlighting the methodological contribution, discussing policy implications in relation to the Sustainable Development Goals (SDGs), and outlining directions for future research.
This section describes the analytical framework, data sources, and empirical procedures used to operationalise a fuel poverty indicator as a policy‑relevant sustainability indicator. The methodological focus is placed on the indicator construction and simulation approach, while regional electricity service areas are introduced subsequently as case studies to empirically test the proposed framework.
This study adopts an indicator‑based analytical framework to quantify household vulnerability to rising energy prices and to evaluate mitigation measures within a unified metric. The framework integrates two established fuel poverty traditions - the 10% expenditure‑based indicator and the LIHC indicator - into a hybrid fuel poverty index that balances conceptual robustness with operational simplicity.
The analytical procedure consists of three steps. First, fuel‑poor households are identified using combined expenditure and income thresholds, allowing the indicator to capture both affordability stress and relative income vulnerability. Second, household fuel expenditures are modelled as a function of dwelling characteristics, household size, and behavioural variables related to energy use. Third, counterfactual simulations are conducted to assess how changes in energy prices, behavioural energy‑saving measures, and income support policies affect the fuel‑poor headcount. This framework is designed to function as a sustainability indicator that can be applied to monitor short‑term energy price shocks - such as those induced by carbon pricing - while remaining interpretable for policy design and communication.
To empirically examine the applicability of the proposed framework, this study employs a comparative case study design using two major electricity service areas in Japan: those served by the Tokyo Electric Power Company (TEPCO) and the Kyushu Electric Power Company (Kyuden). These areas were selected because they experienced differing trajectories of electricity price increases during the recent energy price surge, providing a suitable context for testing the sensitivity of the indicator to heterogeneous affordability conditions. It is emphasised that the service areas themselves do not constitute the core hypothesis of the study. Rather, they serve as empirical settings to test whether the indicator framework can detect distributional vulnerability and evaluate mitigation measures across regions with different income distributions, energy expenditure patterns, and behavioural responses.
This study conducted a web-based survey to investigate fuel costs in 2021 (before the recent rise in energy prices) and 2022 (after the recent rise in energy prices), determine the number of fuel-poor households, and analyse trends in fuel usage and costs. This study surveyed residents of the Tokyo Electric Power Company (TEPCO) service area, which is based in the Kanto region of Japan, and the Kyushu Electric Power Company (Kyuden) service area, which is based in the Kyushu region of Japan. The TEPCO service area had an average increase in the unit price of household electricity of 50.1% between December 2021 and December 2022, while the Kyuden service area had an average increase of 29.5% [16].
The main questions in the survey are listed in Table 1. These questions included household income, financial assets, and monthly fuel costs (e.g. electricity, gas, and kerosene) for 2021 and 2022. However, to reduce the burden on respondents, questions were asked in the form of ‘What percentage higher (or lower) was/were household income, financial assets, and fuel costs in 2021 compared to those in 2022?’. There were 1,030 respondents from each service area. The survey targeted respondents aged 20–64 years. The survey period was 26–27 February 2024 for the TEPCO service area and 7–9 March 2024 for the Kyuden service area.
| Demographics | Age, number of household members, type of building in which you live, construction date, total floor area, insulation renovation, etc. |
| Main questions | Annual household income, household financial assets, monthly fuel bill (electricity, gas, kerosene, other), number of air conditioners and other heating (cooling) equipment in use, temperature setting of air conditioners, etc. |
Fuel‑poor households were identified using a hybrid indicator that combines the 10% and LIHC criteria. Specifically, households were classified as fuel poor if (i) annual fuel expenditures exceeded 10% of annual household income and (ii) household income fell below 60% of the median income within the relevant service area. This combined approach retains consistency with widely used international definitions while avoiding reliance on complex multidimensional indices. The resulting indicator provides a transparent and reproducible measure suitable for policy monitoring and simulation analysis.
Household fuel expenditure was modelled using a two‑equation approach developed in previous work [17]. The model consists of two regression equations: a binomial logistic regression equation [eq. (1)] and a multiple regression equation [eq. (2)]. First, eq. (2) was used to calculate the annual fuel bill by inputting the total floor area of the home, number of people in the household, and summer air conditioner temperature settings as parameters. Next, eq. (1) was modified to include the parameters for annual household income and annual fuel bill as follows:
where FP represents the identification of households in fuel poverty (If FP = 1, the household is in a state of fuel poverty; if FP = 0, the household is not in a state of fuel poverty), f is the annual fuel bill (JPY†), i is the annual household income (10,000 JPY), a is the total floor area of the home (Letters a–f correspond to numbers 1–6 as follows: 1, below 29 m2; 2, 30–49 m2; 3, 50–69 m2; 4, 70–99 m2; 5, 100–149 m2; and 6, exceeds 150 m2), p is the number of people in the household (persons), and t is the summer air conditioner temperature setting (℃). By combining these regression equations, it is possible to determine whether or not a household will experience a state of fuel poverty when air conditioner temperature is set to 28°C.
Two classes of mitigation measures were examined. First, behavioural energy‑saving measures were simulated by fixing summer air conditioner temperature settings across households within a specified range. In line with national guidelines, a setting of 28°C was examined as a reference scenario representing energy conservation without intentional deprivation. Temperature setting is based on Japan’s Ministry of the Environment [18] that they recommend that the room temperature in summer (June to August) be set to 28°C to save energy without compromising comfort. this study hypothesise that by setting the air conditioner to a temperature of 28°C, energy costs can be reduced without compromising wellbeing. Second, income‑based support measures were simulated by introducing hypothetical subsidies corresponding to a percentage of annual household income. These simulations were designed to assess how different policy levers affect the fuel‑poor headcount within the same indicator framework, enabling direct comparison of behavioural and income‑based interventions.
Several methodological limitations should be acknowledged. The web‑based survey design may introduce selection bias, as participation requires internet access and voluntary response. Retrospective reporting of 2021 values introduces recall bias, and the resulting estimates should be interpreted as indicative rather than precise. In addition, simulations involving higher air conditioner temperature settings do not explicitly model health risks such as heat stroke, which may disproportionately affect older or medically vulnerable populations. Accordingly, the indicator outcomes should be interpreted as policy reference values rather than prescriptive behavioural recommendations. The results are therefore context-specific and shaped by Japan’s institutional, tariff, and climatic conditions, although the analytical framework itself is transferable.
This section describes the empirical results and interprets them through the lens of the proposed indicator‑based framework. The purpose is not merely to document regional conditions, but to demonstrate how a simple, transparent fuel poverty index can (i) detect distributional vulnerability under energy price shocks and (ii) compare the effectiveness and feasibility of behavioural and income‑based mitigation options within a unified sustainability‑indicator metric.
Table 2 presents the survey results. The figures for 2021 were rough estimates for the aforementioned reasons. Annual household income was lower in the Kyuden service area and higher in the TEPCO service area. The same trend was observed for financial assets. Annual fuel and electricity bills were also higher in the TEPCO service area. The monthly electricity bill was approximately 8,638 JPY for TEPCO (as of December 2022, the unit price of electricity is 33.85 JPY/kWh) and 7,792 JPY for Kyuden (as of December 2022, the unit price of electricity is 26.58 JPY/kWh.), with a difference of approximately 846 JPY. Table 3 presents the results for each indicator used to calculate the number of fuel-poor households. There were 89 and 135 fuel-poor households in the TEPCO and Kyuden service areas, respectively. The ratio of fuel-poor households to the total number of households was 5.4% and 7.6% in the TEPCO and Kyuden service areas, respectively. The proportion of fuel-poor households in the TEPCO service area decreased between 2021 and 2022, whereas that in the Kyuden service area increased. This divergence provides a useful test of whether the indicator framework can reveal vulnerability patterns that are not explained by electricity price movements alone.
| TEPCO | Kyuden | |
|---|---|---|
| Age [yr] | 44.54 | 44.28 |
| Number of household members [persons] | 2.56 | 2.79 |
| Annual household income in 2022 [MJPY] | 7.26 | 5.81 |
| Annual household income in 2021 [MJPY] | 7.47 | 5.96 |
| Household financial assets in 2022 [MJPY] | 16.15 | 2.65 |
| Household financial assets in 2021 [MJPY] | 16.55 | 2.62 |
| Annual fuel bill in 2022 [JPY] | 185,490 | 166,882 |
| Annual fuel bill in 2021 [JPY] | 176,407 | 145,019 |
| Annual electricity bill in 2022 [JPY] | 103,653 | 93,450 |
| Annual electricity bill in 2021 [JPY] | 98,068 | 84,437 |
| 2022 | 2021 | ||
|---|---|---|---|
| (1) 10% indicator | TEPCO | 65 (6.3%) | 69 (6.7%) |
| Kyuden | 91 (8.8%) | 68 (6.6%) | |
| (2) LIHC indicator | TEPCO | 167 (16.2%) | 182 (17.7%) |
| Kyuden | 218 (21.2%) | 188 (18.3%) | |
| Number of fuel-poor households (combination of (1) and (2)) | TEPCO | 56 (5.4%) | 62 (6.0%) |
| Kyuden | 78 (7.6%) | 60 (5.8%) |
An important finding is that Kyuden shows a higher fuel poverty rate than TEPCO in 2022 despite a lower increase in electricity unit prices over the period referenced in the study context. The manuscript notes that household electricity unit prices increased by 50.1% in TEPCO and 29.5% in Kyuden between December 2021 and December 2022. The indicator results therefore suggest that vulnerability is driven by factors beyond electricity price escalation alone. The first explanatory factor is income distribution. The Kyuden service area has a lower average annual income, and fuel costs account for a larger share of income, making it easier for households to cross the 10% affordability threshold even when electricity prices rise less steeply. The second factor is the LIHC income threshold. The LIHC indicator value for the Kyuden service area (2.7 million JPY) was also lower than that for the TEPCO service area (3.3 million JPY) due to the Kyuden service area’s relatively lower median household income. this implies that a larger proportion of households may fall below the income threshold when combined with high relative fuel expenditure. The third factor relates to behavioural and/or structural constraints on demand reduction. This study estimated the amount of electricity used based on the electricity bills using the household electricity unit price [16] for each service area and found that it decreased in each service area between 2021 and 2022. The decrease in electricity usage in the TEPCO service area was 19.6%, whereas the decrease in electricity usage in the Kyuden service area was only 5.3%. In addition, Kyuden experienced a high rate of increase in non electricity fuel bills between 2021 and 2022, likely increasing the number of households meeting the 10% criterion. Taken together, these results support the methodological point that an indicator framework focused on affordability can detect “hidden” vulnerability created by income constraints, fuel mix differences, and limited capacity to reduce consumption.
Finally, the data are consistent with the possibility that behavioural settings differ between the two areas. Table 4 shows the electricity bills and average summer air conditioner temperature settings for each service area. Electricity bills were higher for residents of the TEPCO service area than for residents of the Kyuden service area for all age groups. However, the average summer air conditioner temperature setting was lower for residents of the Kyuden service area than for residents of the TEPCO service area for all age groups. Both service areas are located in the warm humid climate zone of the Köppen climate classification. The average temperature in the 23 wards of Tokyo, which has the highest population in the TEPCO service area, is 15.8 °C; while that in Fukuoka City, which has the highest population in the Kyuden service area, is 17.1 °C [19]. Average summer air conditioner temperature settings were lower in Kyuden than in TEPCO across all age groups reported, implying higher cooling demand (and potentially higher electricity use) in Kyuden, although climate and comfort needs may contribute to this pattern. Importantly, this study treats such behavioural differences as an empirical feature captured by the survey and modelling framework, rather than as a region specific claim that would limit generalizability.
| Average annual electricity bill [JPY] | Average summer air conditioner temperature setting [°C] | |||
|---|---|---|---|---|
| Age group [yr] | TEPCO | Kyuden | TEPCO | Kyuden |
| 20s | 91,097 | 71,947 | 23.46 | 22.75 |
| 30s | 103,437 | 96,044 | 24.05 | 23.63 |
| 40s | 113,199 | 93,723 | 24.85 | 23.96 |
| 50s | 105,034 | 106,956 | 24.74 | 24.06 |
| 60–64 | 105,500 | 98,578 | 25.39 | 24.7 |
| Total | 103,653 | 93,450 | 24.50 | 23.79 |
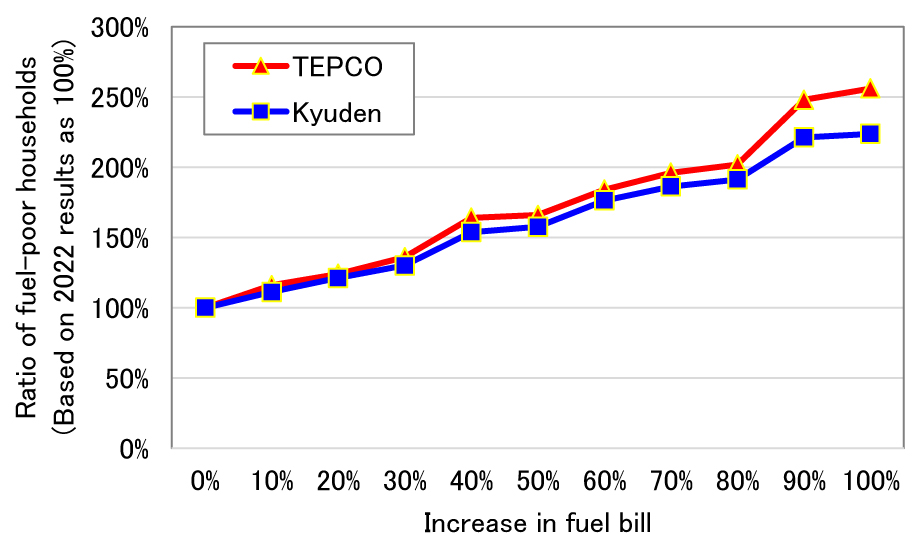
Sensitivity analysis was conducted into the extent of change in the number of fuel-poor households when fuel costs were varied from 0% to 100% of the baseline (100%), utilising a fixed household income and fuel costs in 2022 as the baseline. Figure 1 shows the relationship between the fuel bill and the ratio of fuel-poor households. The findings indicated that when fuel expenses escalated by 120%, there was a 24% and 21% surge in fuel-poor households for Tokyo Electric Power Company and Kyushu Electric Power Company, respectively, in comparison to the baseline. This sensitivity analysis illustrates the policy relevance of the indicator approach for carbon‑pricing contexts, where price‑induced affordability stress can emerge rapidly and requires monitoring with an interpretable metric.
Based on the above results, this study investigated the change in the number of fuel-poor households when the summer air conditioner temperature setting was fixed at 19–35 ℃ rather than the temperature set by each household. The air conditioner temperature of each household was assumed to be the same. For example, if the air conditioner temperature was fixed at 28 ℃, the air conditioner temperature of all households would be set to 28 ℃. The number of fuel-poor households was then calculated. Figure 2 shows the relationship between the temperature setting of air conditioners and the number of fuel-poor households based on the baseline (i.e. 100%) of the number of fuel-poor households at the temperature setting of air conditioners for all age groups listed in Table 4 (24.50 °C in the TEPCO service area and 23.79 °C in the Kyuden service area). The results reveal that the number of fuel-poor households decreased substantially when the air conditioner temperature was fixed at 26 °C in both the TEPCO and Kyuden service areas. When the temperature setting of each household's air conditioner was fixed at 28 °C, the number of fuel-poor households decreased by 36.7% and 27.9% from the baseline in the TEPCO and Kyuden service areas, respectively.
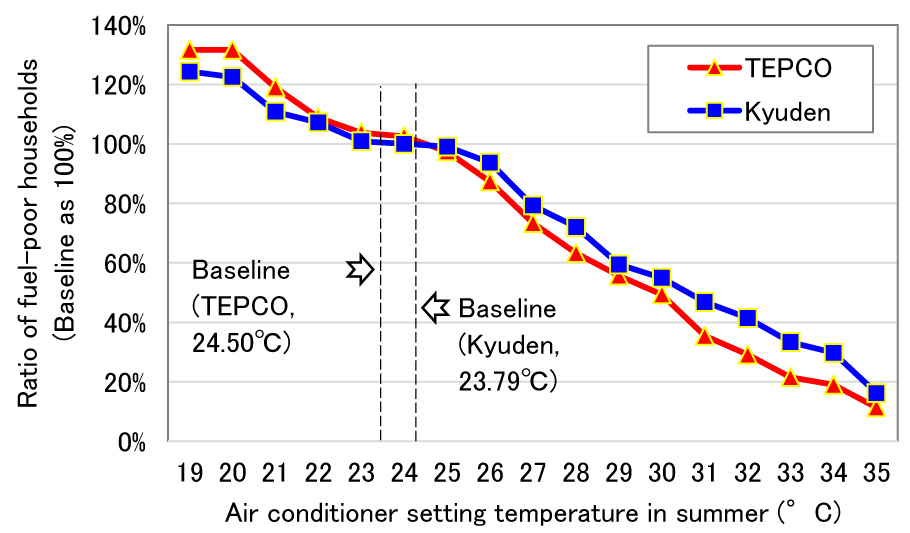
The number of fuel-poor households decreased as the air conditioner temperature setting increased. At the same time, this result appropriately notes a key feasibility constraint: increasing temperature settings beyond a certain level may not be advisable in practice due to increased risk of heat stroke. This constraint is critical for interpreting behavioural mitigation as a policy relevant option rather than a prescriptive recommendation. In a sustainability indicator context, the results should therefore be framed as quantifying the upper bound potential of a behavioural measure under a standard guideline scenario, while acknowledging heterogeneity in health risk and comfort needs across households.
Recognizing that behavioral measures alone may not eliminate fuel poverty for households with low income, the study simulated income support by providing subsidies equal to 0–100% of annual household income and recalculating the fuel poor headcount under the 28°C temperature scenario. Figure 3 shows the relationship between the percentage of subsidy provided and the number of fuel-poor households based on the baseline number of fuel-poor households when no subsidy was provided. The results reveal that when a subsidy of 30% of the annual household income was provided, the number of fuel-poor households was reduced by approximately 50% from the baseline in both the TEPCO and Kyuden service areas.
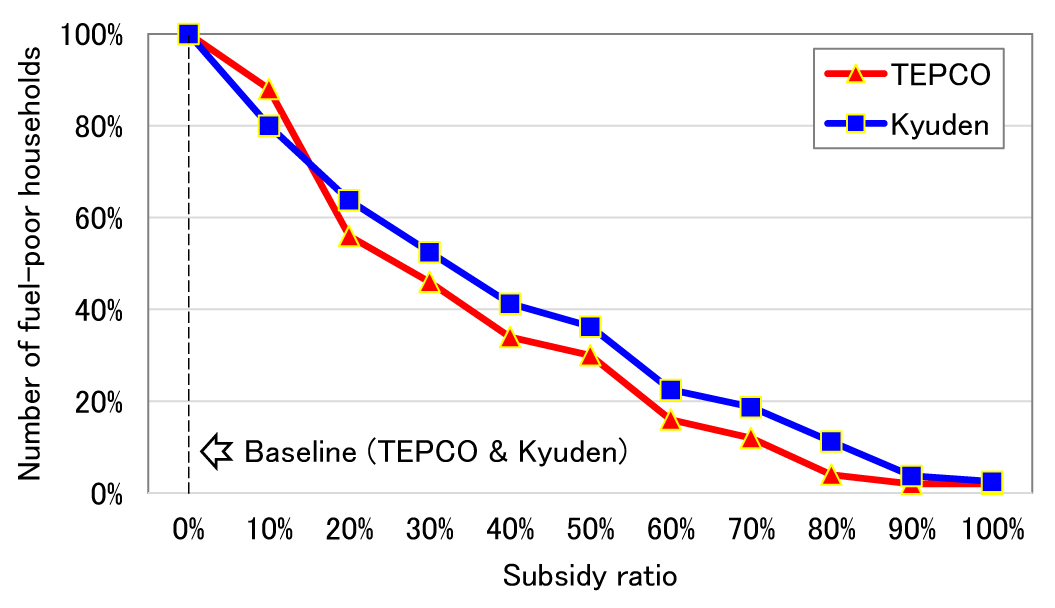
The number of fuel-poor households decreased as the percentage of subsidy provided increased. While the model implies monotonic reductions as subsidies rise, the manuscript correctly notes the practical limitation that unlimited subsidies are unrealistic and that governments and municipalities must examine how to set limits for benefit payments when establishing reduction targets for vulnerable households.
Although the empirical analysis uses two Japanese service areas, the indicator‑simulation framework is designed to be transferable to other jurisdictions experiencing energy price shocks, including those driven by carbon pricing. The essential requirements for transfer are (i) household‑level data on income and energy expenditures, (ii) a transparent affordability threshold definition, and (iii) a parsimonious behavioural or dwelling‑characteristic model that enables counterfactual scenarios. In this sense, the case studies demonstrate a broader methodological proposition: that a simple and interpretable sustainability indicator can support rapid vulnerability monitoring and policy stress‑testing under price shocks.
The findings of this study are broadly consistent with previous international research that identifies income constraints and affordability, rather than energy prices alone, as dominant drivers of fuel or energy poverty. Studies based on European household data have repeatedly shown that price-based climate policies, such as carbon pricing, can exacerbate energy poverty unless distributional safeguards are introduced, particularly for low-income households. The present results align with this literature by demonstrating that regions with lower average income levels can exhibit higher fuel-poverty rates even when electricity price increases are relatively modest. At the same time, this study extends existing international evidence in several important ways. While many previous studies rely on macro-level indicators or complex multidimensional indices, the present analysis uses a simple, transparent indicator framework combined with micro-level household data and behavioural simulation. This enables a direct comparison of behavioural energy-saving measures and income-based support within a single metric, which remains uncommon in the international literature. In addition, the case-study results highlight how differences in fuel mix and demand-reduction capacity can shape affordability outcomes, complementing international findings that emphasize income and housing conditions as key determinants of vulnerability. Compared with international studies focusing primarily on structural energy efficiency or long-term housing retrofits, the present framework places greater emphasis on short-term affordability stress under energy price shocks. In this respect, the analysis contributes to the emerging literature on energy poverty in the context of rapid price volatility and carbon pricing, offering a policy-ready sustainability indicator that can support timely monitoring and targeted intervention across diverse institutional settings.
The interpretation of results should explicitly acknowledge key limitations. The web‑based survey approach may introduce measurement inaccuracies and selection bias, and the 2021 values are described as rough estimates, implying potential recall error in retrospective reporting. In addition, behavioural scenarios that increase air‑conditioner temperature settings face health‑risk constraints (heat stroke) that are not modelled explicitly in the current simulation. These limitations do not negate the value of the indicator approach, but they bound the claims: the results are best interpreted as a transparent, policy‑relevant approximation for monitoring and comparing mitigation options, rather than as precise causal estimates of household behaviour or health outcomes.
This study proposed and empirically tested a policy‑relevant fuel poverty indicator framework to quantify household vulnerability to rising energy prices and to evaluate mitigation options under energy price shocks. By bridging the established 10% expenditure‑based indicator and the Low‑Income High‑Cost (LIHC) tradition, the study demonstrated how a simple and transparent indicator can function as a sustainability indicator that is both analytically robust and operationally suitable for policy monitoring. Using household‑level survey data from two electricity service areas in Japan as case studies, the indicator framework revealed substantial differences in fuel‑poverty outcomes that are not explained by electricity price movements alone. In 2022, the proportion of fuel‑poor households was 5.4% in the Tokyo Electric Power Company (TEPCO) service area and 7.6% in the Kyushu Electric Power Company (Kyuden) service area. Despite lower electricity price increases in Kyuden, fuel poverty was more prevalent, reflecting lower household income levels, a higher share of income devoted to fuel costs, and limited scope for demand reduction. These findings illustrate the methodological value of affordability‑based indicators in detecting distributional vulnerability that may remain hidden when policy attention focuses solely on energy prices. The simulation analysis further demonstrated the capacity of the indicator framework to compare mitigation measures within a unified metric. Behavioural energy‑saving measures, represented by adjusting summer air‑conditioner temperature settings, were shown to substantially reduce fuel poverty. When air‑conditioner settings were fixed at 28°C, consistent with national energy‑saving guidelines, the number of fuel‑poor households decreased by 43.8% in the TEPCO service area and 40.7% in the Kyuden service area, depending on the baseline definition used. These results highlight the significant potential of low‑cost behavioural measures to alleviate affordability stress under energy price shocks. At the same time, the analysis underscores an important practical constraint: behavioural measures alone cannot fully eliminate fuel poverty for households with persistently low incomes, and excessive temperature adjustments may raise health risks such as heat stroke.
Income‑based support measures were therefore examined as a complementary policy lever. Simulation results indicated that providing subsidies equivalent to 30% of annual household income reduced the fuel‑poor headcount by approximately 50% in both service areas under the reference behavioural scenario. While such subsidy levels are illustrative rather than prescriptive, the analysis demonstrates how the proposed indicator framework enables policymakers to compare the relative effectiveness of behavioural and fiscal interventions using a common outcome measure. This feature is particularly relevant for designing targeted and fiscally constrained support packages in periods of sustained energy price volatility or carbon‑pricing implementation. From a sustainability perspective, the findings have direct implications for the achievement of the United Nations Sustainable Development Goals. By reducing the number of households unable to afford adequate energy services, the proposed indicator framework supports SDG 7 (Affordable and Clean Energy), particularly the objective of ensuring universal access to affordable and reliable energy. At the same time, by mitigating energy‑induced financial stress among low‑income households, the framework contributes to SDG 1 (No Poverty) by addressing a specific and increasingly important channel of economic vulnerability. The indicator‑based approach provides policymakers with a concrete tool for setting reduction targets, evaluating policy trade‑offs, and communicating distributional impacts in an accessible manner. More broadly, this study contributes methodological knowledge by demonstrating that fuel poverty indicators can be operationalised as policy‑ready sustainability indicators capable of responding to short‑term energy price shocks. Although the empirical analysis focused on two Japanese electricity service areas, the framework itself is transferable to other regions facing similar challenges, provided that basic household income and energy expenditure data are available. Future research should extend the framework by explicitly integrating health‑risk constraints, refining behavioural assumptions, and applying the indicator to different institutional and climatic contexts. Such extensions would further strengthen the role of simple, transparent indicators in supporting equitable and evidence‑based energy transition policies.
- ,
What are the effects of energy poverty and interventions to ameliorate it on people's health and well-being?: A scoping review with an equity lens ,Energy Research & Social Science , Vol. 87 , 2022, https://doi.org/10.1016/j.erss.2021.102456 - , , Fixing Fuel Poverty: Challenges and Solutions, 2010
- ,
Key fuel poverty indicators and variables: A systematic literature review ,Economics of Energy & Environmental Policy , Vol. 13 , :167-1862024, https://doi.org/10.5547/2160-5890.13.1.lbra - The poverty and distributional impacts of carbon pricing: Channels and policy implications IMF Working Paper (accessed )
- ,
EU climate action through an energy poverty lens ,Scientific Reports , Vol. 13 , 2023, https://doi.org/10.1038/s41598-023-32705-2 - Getting the measure of fuel poverty: Final report of the fuel poverty review (accessed )
- ,
Multidimensional index of fuel poverty in deprived neighbourhoods. Case study of Madrid ,Energy and Buildings , Vol. 224 , 2020, https://doi.org/10.1016/j.enbuild.2020.110205 - ,
Lighting and cooking fuel choices of households in Kisumu City, Kenya: A multidimensional energy poverty perspective ,Energy for Sustainable Development , Vol. 42 , :1-132018, https://doi.org/10.1016/j.esd.2017.09.006 - ,
Looking beyond energy efficiency and the role of financial literacy in experiencing fuel poverty: Evidence from Irish homeowners ,Energy Research & Social Science , Vol. 112 , 2024, https://doi.org/10.1016/j.erss.2024.103515 - ,
Energy deprivation to financial prosperity: Unveiling multidimensional energy Poverty's influence ,Energy Strategy Reviews , Vol. 54 , 2024, https://doi.org/10.1016/j.esr.2024.101473 - ,
Assessing Japan's energy poverty vulnerability amidst global conflict impacts using energy poverty possibility indicator ,Energy Efficiency , Vol. 17 , 2024, https://doi.org/10.1007/s12053-024-10237-6 - ,
Vulnerability to energy poverty under the Japanese social welfare system: An analysis of lived experiences in Sapporo City ,Social Policy and Labor Studies , Vol. 16 (1), :314-3262024, https://doi.org/10.24533/spls.16.1_314 - ,
The economic burden of EU ETS2 carbon pricing on single and childless households: Focusing on transport and building sectors ,Frontiers in Environmental Science , Vol. 13 , 2025, https://doi.org/10.3389/fenvs.2025.1572246 - ,
Change in the affordability of owner-occupied housing in the context of rising energy prices ,Energies , Vol. 15 , 2022, https://doi.org/10.3390/en15041281 - ,
The impact of rising oil prices on U.S. inflation and inflation expectations in 2020–23 ,Energy Economics , Vol. 113 , 2022, https://doi.org/10.1016/j.eneco.2022.106228 - , Trends in unit electricity rates
- ,
Analysing the Impact of Energy Price Increases on the Vulnerable Using the Fuel Poverty Index: A Case Study of Kobe, Japan ,Energy Efficiency , Vol. 18 , 2025, https://doi.org/10.1007/s12053-024-10292-z - , COOLBIZ
- , Historical meteorological data