

Pulp and paper are products with many uses, origination from carbon binding trees with a large potential to be one of the pillars for the green economy. However, the pulp and paper process are very water dependent and water consuming. Hence, the industry uses large volumes of water, it is also dependent on access to water of good quality and therefore highly aware of water issues. The pulp and paper industry faces several major challenges concerning water management: The industry is highly water-intensive, using significant amounts of water in various stages of production, from pulping to papermaking. Traditionally, the focus of improvement for the sector have mainly been targeted towards chemical and energy effectiveness and productivity improvements. However, the access to water is under climate pressure [1] and focus on water in the process increases in interest [2]. UN SDG 6 define this in the sub target 6.3: improve water quality by reducing pollution, eliminating dumping and minimizing release of hazardous chemicals and materials, halving the proportion of untreated wastewater and considerably increasing recycling and safe reuse globally; 6.4 substantially increase water-use efficiency across all sectors and ensure sustainable withdrawals and supply of freshwater to address water scarcity and substantially reduce the number of people suffering from water scarcity and 6.5 implement integrated water resources management at all levels, including through transboundary cooperation as appropriate. Awareness of the need to improve water management has indeed been on the agenda for the past 20 years; however, it has not been central to business practices. For example, the European union compiled a BAT document (Best Available Techniques) in 2015 [3] concerning efficient use and treatment of water to reduce consumption and improve effluent quality, with recommendations for process design for the sector to be implemented. A typical water passing through the pulp and paper process end up containing suspended solids (>500 mg/L), carbohydrates (100-500 mg/L), ammonia nitrogen (50-200 mg/L), cyanide (5-20 mg/L), sulphate compound (100-200 mg/L) and phosphate (>20 mg/L) [4]. The sector has worked towards divide streams, decrease chemicals, reuse water (counter-flow principle) and closed recirculating e.g. cooling systems [5]. There are several technologies [6] that can help the sector move towards a cleaner technology and ultimately net zero emissions [7]. However, there are very large volumes of water and large investments involved, once a process is set up it is not easily changed. Moreover, a more circular process is best suited to be incorporated into the basic design of a new facility [8]. Furthermore, contaminants and concentration should be closely monitored when increasing circularity [8]. Furthermore, Ocklind et. al (2024) [9] conclude that the sector has potential to develop further, however, also contribute as a possibly bio-refineries for multiple products in the future [10]. Nevertheless, there are great opportunities to save water, energy and resources if the efficiency of water flows in various process steps and areas of use can be improved.
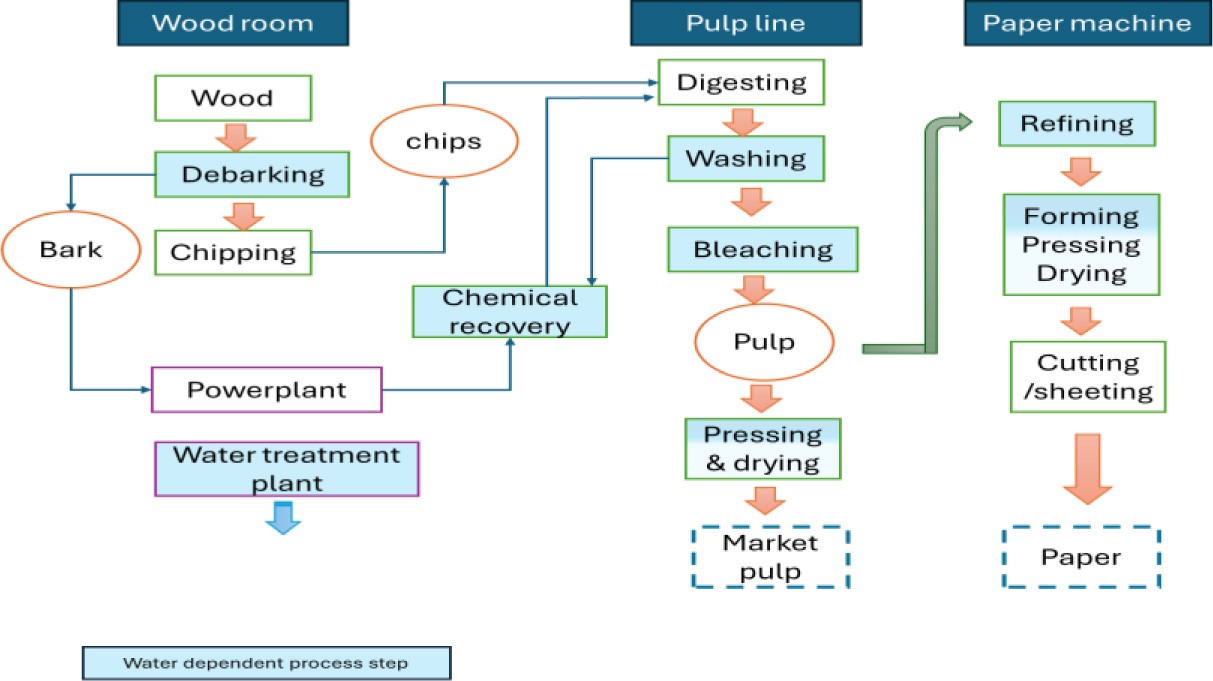
In this study, water management practices and water‑use efficiency are assessed and compared across three pulp and paper mills belonging to the same company, with sites located in Sweden, France, and Brazil. The Swedish pulp and paper mill has the Magnefite pulp process with BAT-associated wastewater flow 45-70 m3/t. (Air Dried tonne, 10% moisture) [3]. The French mill and Brazilian mill have the kraft pulp process with BAT-associated wastewater flow 25-50 m3/ t. All the mills have an integrated pulp and paper process. Previously, water efficiency efforts at the Swedish mill been concentrated on minimizing steam use for water heating, reducing chemical consumption in water treatment, and decreasing electricity demand associated with pumping. Water is a fundamental input throughout the pulp and paper production process, particularly during wood processing, where large volumes of water are required to separate cellulose fibres from lignin. Each step involves water, and the resulting effluents can contain chemicals and suspended solids [11], see Figure 1. Chemical pulping processes separate cellulose fibres from lignin and other components. The sulphate process mainly uses the chemicals sodium hydroxide (NaOH) and sodium sulphide (Na₂S), wood chips are cooked in a "white liquor" solution under high pressure and temperature. Byproducts are lignin and other organics that are traditionally burned to recover energy and chemicals. Moreover, softwood sulphate pulp is generally regarded as producing the strongest pulp for packaging, printing papers, and other high‑strength paper products. The sulphite process uses Sulphurous acid (H₂SO₃) and bisulphite ions (e.g., Ca, Mg, Na, or NH₄ bases), in acidic conditions, dissolving lignin [12]. Suitable products from this pulp are tissue, writing paper, and specialty papers [13].
Previous studies emphasize that water management has evolved from a purely technical concern to a multidisciplinary operational practice embedded in industrial decision‑making. Olusanmi, Emeni, Uwuigbe and Oyedayo [14] argue that water can no longer be viewed as a free natural resource, it must instead be recognized as an economic and ecological asset, requiring clearly defined system boundaries from water intake to discharge. External drivers such as water scarcity, stricter environmental regulation, and increasing energy and production costs, further motivate the implementation of structured water management practices [15]. In addition, Barrington, Prior and Ho [16] demonstrates that even highly efficient process industries can identify substantial water conservation potential through systematic water auditing, highlighting the importance of technical, organizational, and behavioural measures in achieving continuous improvement.
Sweden, France and Brazil have all noticed increasing climate footprint effects during the past [10]-[15] years. In Sweden there is an increased climate and water awareness on several levels of government, however, previously the area was underdeveloped and experiences how to address the issue was limited.
Considering what data appropriate to use for water use by the sector, there are some different views. Several articles in the sector [10], [11] base their comparison of water use on raw water intake. Pulp and paper production is not a process that consumes any water, the wood is solved in water and then dried, returning the water. Some amounts may be lost in steam or drying process; however, leaks and redundant base flow can use up unnecessary volumes. The BAT document uses effluent water as their main basis when assessing water footprint. Furthermore, a mill’s production is not constant it adapts to the market, changing both volumes and fractions and most constantly try to improve productivity. Therefore, water use per tonne product is probably a better measure to compare.
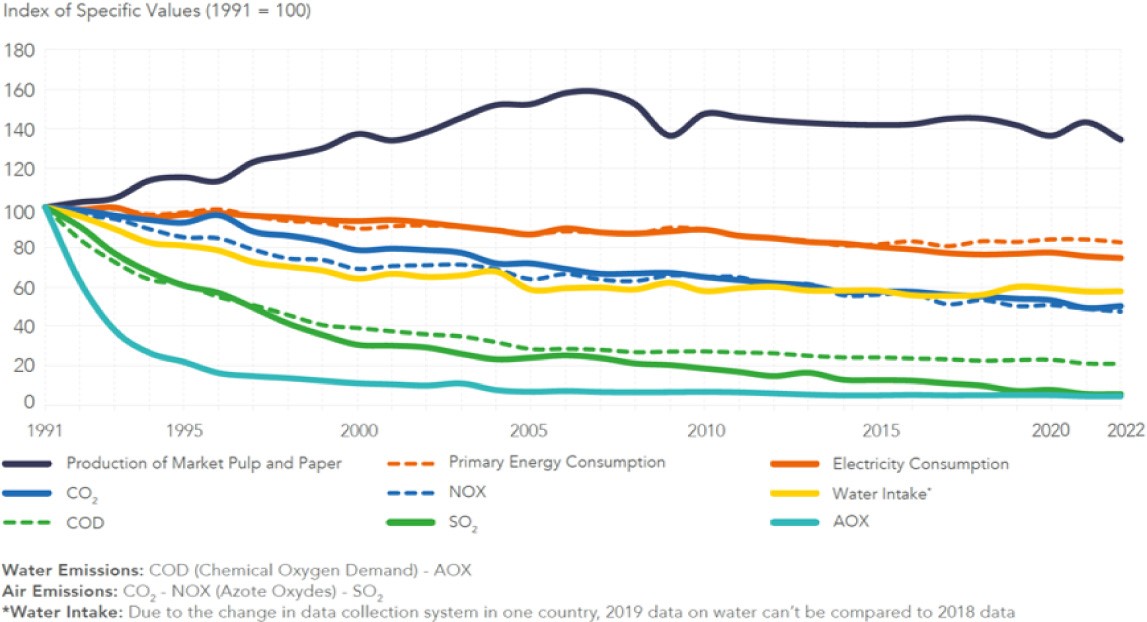
Also, to define the water streams to take in consideration in the study the ISO standard for water footprint [17] was used as a baseline and evaluation of water utilization. High water consumption can strain local water resources, especially in regions facing water scarcity. Water management in the pulp and paper sector has evolved differently across regions, largely influenced by the availability of water resources. In Cepi’s report [18] for the European pulp & paper industry shows, based on the water intake, that from 1991 good improvements in water savings (yellow line in Figure 2) were made during 10 years and then levelled off.
The hypothesis is that Pulp and paper mills operating in a region with larger risk of water shortages have the issue higher in their agenda and therefore invested more and developed their water management to a higher level.
Weather data was collected from global water monitor [19]. The platform provides maps and time series for any global region, offering metrics like actual values, anomalies, deviations, and seasonal trends to compare current conditions with historical data. When comparing the processes in the 3 mills with the design of today 2012 was the best base year since the process design has been mainly the same during these years. So, water data from the 3 different pulp and paper mills over 12 years could be collected for this study from the company environmental database. To anonymize specific mills, 2012 will be used as base and the water data will be indexed. In this case study one Swedish integrated pulp and paper mill (Sw-mill) is studied and compared with one French mill (Fr-mill) and one South American mill (Br-mill).
The mills do not have the same process, not comparable due to the specific amount of water per tonne of paper, according to BAT sulphate process demands less water than the sulphite process [3]. Sulphite and sulphate mills operate under fundamentally different process conditions, each with inherent technical limitations and distinct BAT‑defined water‑use benchmarks; therefore, water‑use performance must be evaluated within the context of the respective process rather than directly compared. The three mills are since some years back in the same company; however, they have no historical connection since they were part of different mother companies. With the background from the ISO standard of Water footprint [17], footprint boundaries were defined. The water data was collected from the environmental reports of the three pulp and paper mills.
The data was investigated and compared which water processes and streams that were included and thereafter balanced from the facilities and was further evaluated with semi-structured interviews with water management at each site-organisation. For the semi‑structured interviews, the primary respondents were the individuals responsible for water management at each mill. In cases where no formally appointed water manager was in place, the interviews were instead conducted with the environmental engineer or designated provider of environmental performance data.
The interviews were performed during April - May 2025 (2-3h including self-assessment session), followed a standardized format and addressed data sources, water‑related KPIs, current water management practices, risk assessment, and the use of self‑assessment and auditing tools. Respondents were also invited to comment on data validity and completeness and to consent to potential follow‑up inquiries.
Furthermore, a self‑assessment tool for water management was developed to enable the participating mills to systematically evaluate their performance. The assessment framework was structured around three key reference areas: Best Available Techniques (BAT), water footprint methodologies, and water‑related risk management. For each area, a set of evaluative questions was derived from relevant standards and guiding documents. Responses were assessed using a six‑level graded scoring scale, allowing for a structured comparison of practices and levels of maturity across the mills.
Scoring:
None
Ad hoc
Implemented but not in use
For trouble shooting
On demand / requested from authorities or ISO or similar
By routine
World class or best practice for sharing
Respondents completed the self‑assessment by jointly discussing and assigning scores during a dedicated session conducted together with one of the authors.
The pulp and paper mill in Sweden has a Sulphite process and the mill in France and Brazil both uses sulphate process. According to the BAT study [3] a sulphate process is more water efficient than the sulphite process. By using the index changes and improvements in the two different processes can be compared.
The weather and water data collected from the Global Water Monitor [19] provide an insightful overview of hydrological developments in the three countries. Clearly, all three have been affected by climate change. [20].
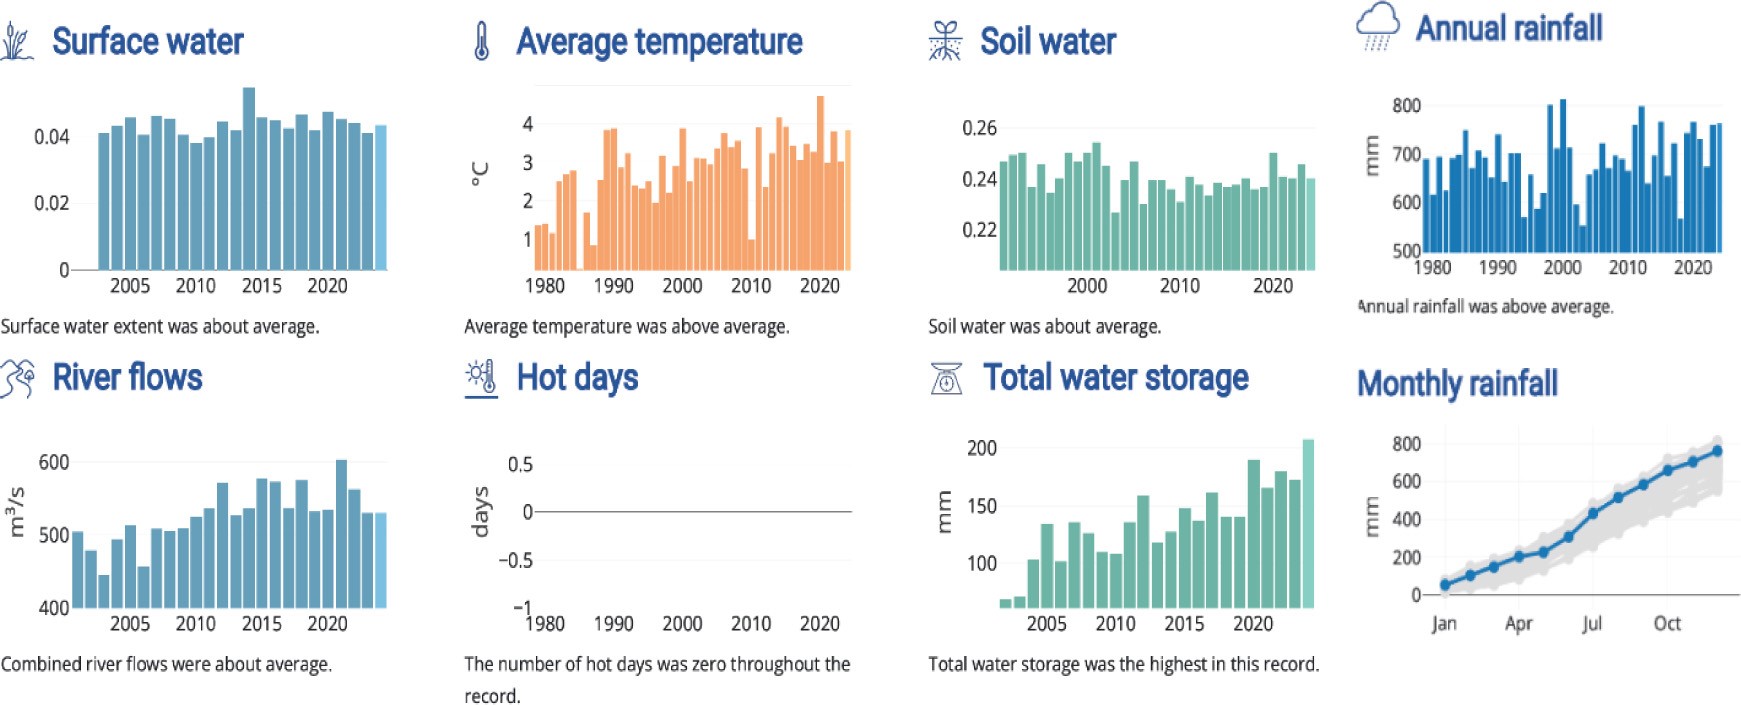
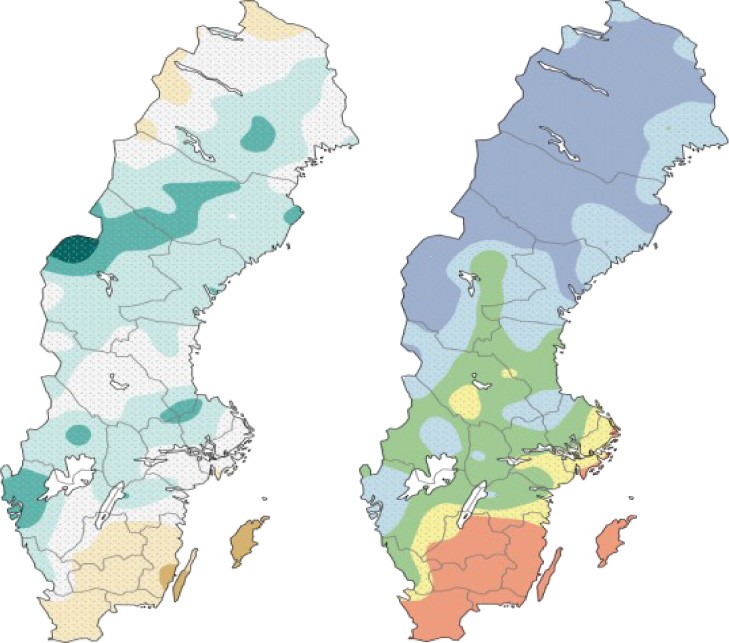
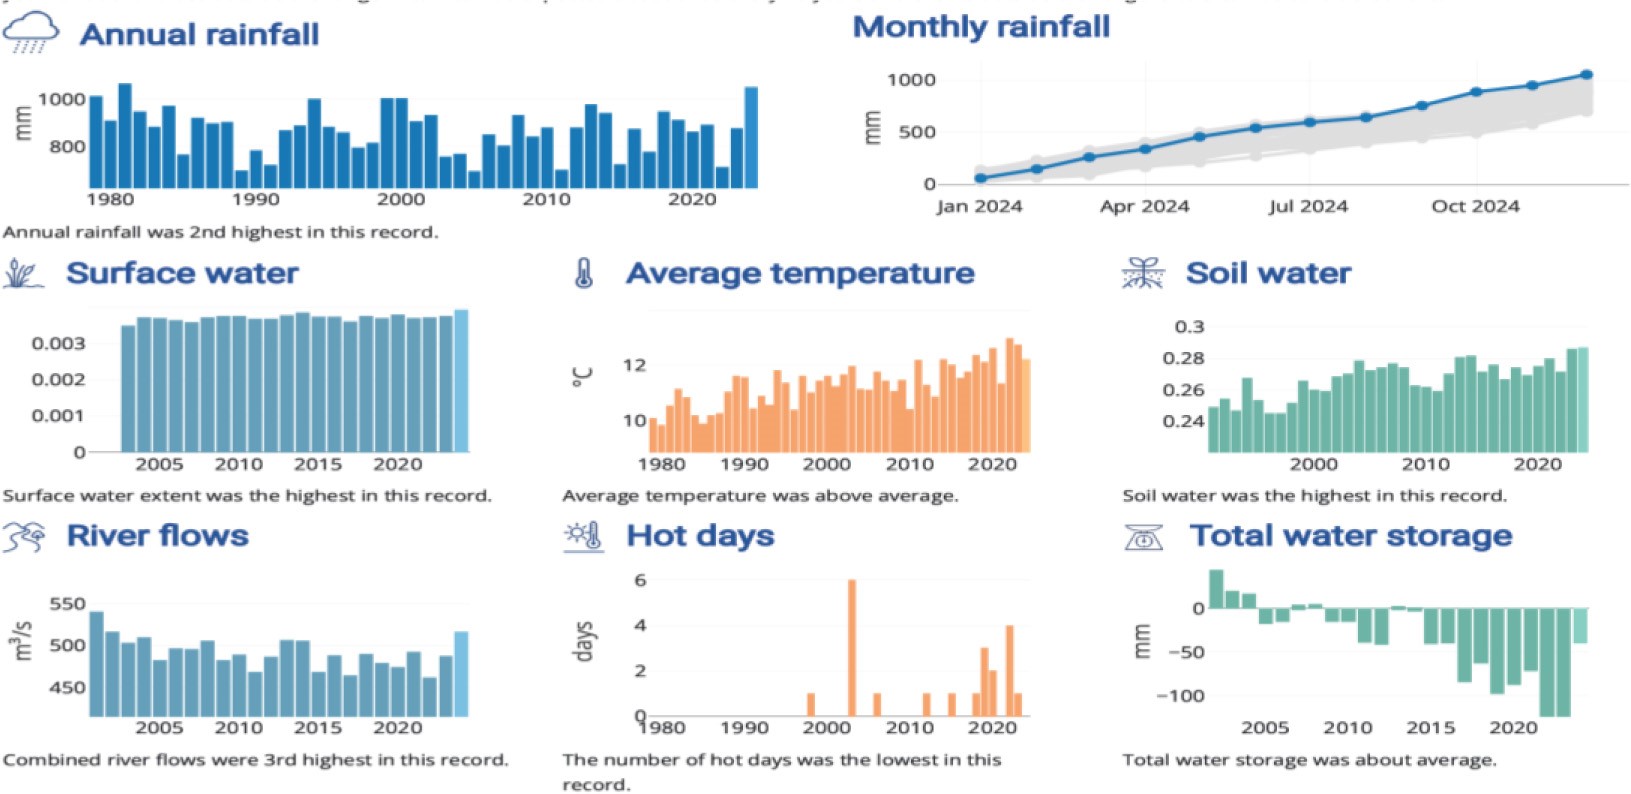
Of the three countries, Sweden has experienced the strongest warming trend, with average temperatures increasing by nearly 3°C since 1980. Annual precipitation has also increased, resulting in greater overall water storage (see Figure 3). However, precipitation patterns have changed, with longer dry periods occurring between rainfall events. In addition, precipitation has become more concentrated in western Sweden, while southeastern and eastern regions receive less rainfall. Consequently, groundwater levels have declined in these parts of the country (Figure 4) [21].
France has also experienced a significant increase in average temperature, with warming exceeding 2°C between 1980 and 2024, alongside an increase in annual precipitation. Despite this, river flows show a declining trend, which has contributed to a reduction in overall water storage (see Figure 5).
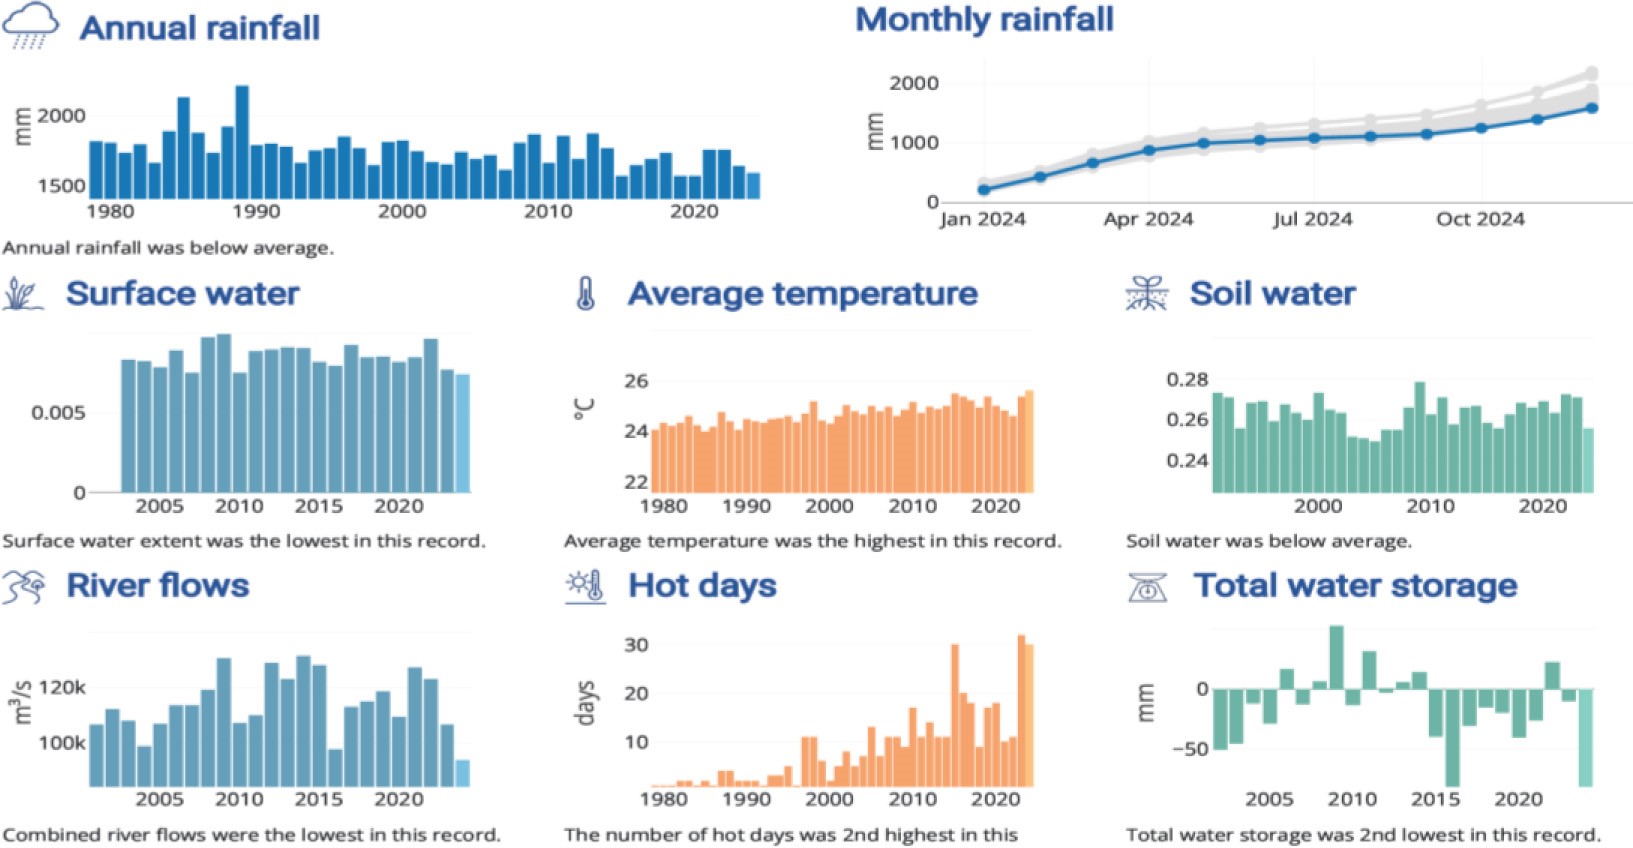
For Brazil (Figure 6) there is a very clear trend of increasing temperatures both as an average (1 degree, since 1980) and the number of hot days. Additionally, it also seems to be similar all over the country. Moreover, the annual rainfall has a decreasing trend, resulting in a lower flow (m3/s) in the rivers and a very clear trend of lower total water storage [19].
The results presented in this section integrate long‑term quantitative water‑use data with qualitative insights derived from semi‑structured interviews, providing a comprehensive view of water management across the three mills. The findings reveal distinct patterns in water consumption and operational behaviour, and by combining numerical trends with contextual information from local water managers, a more nuanced understanding of site‑specific challenges and adaptive responses emerges.
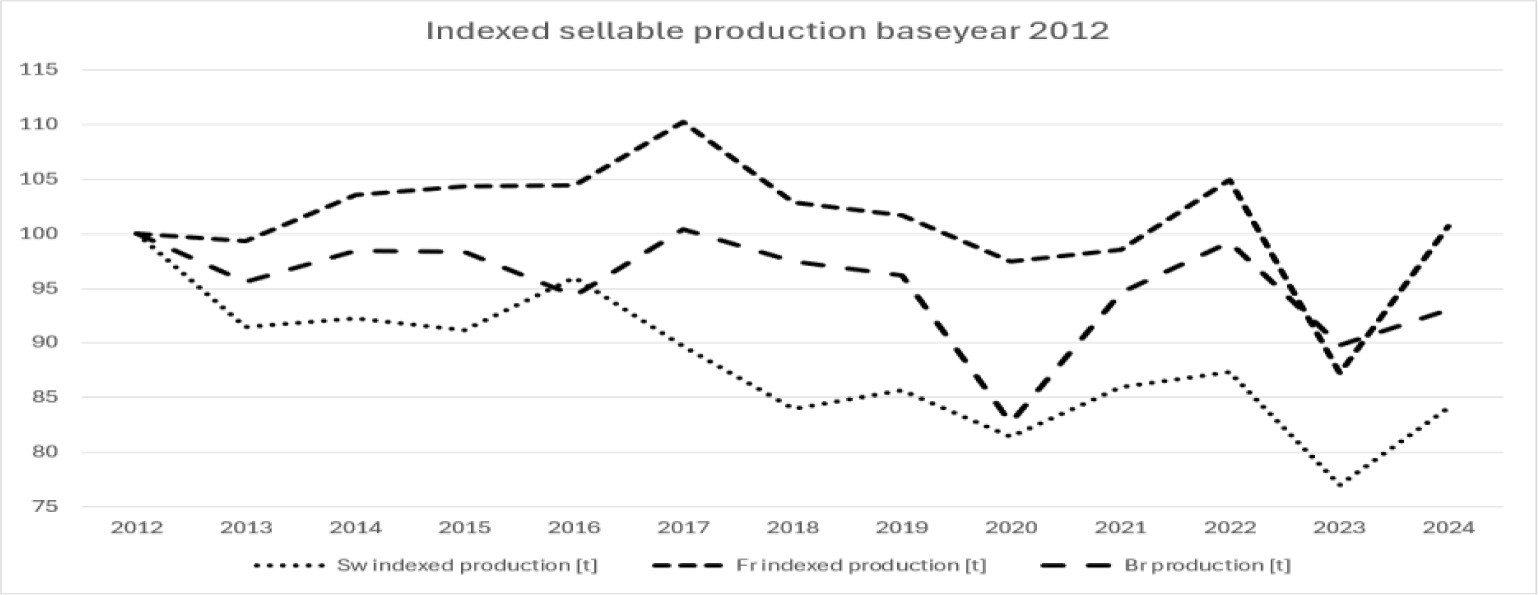
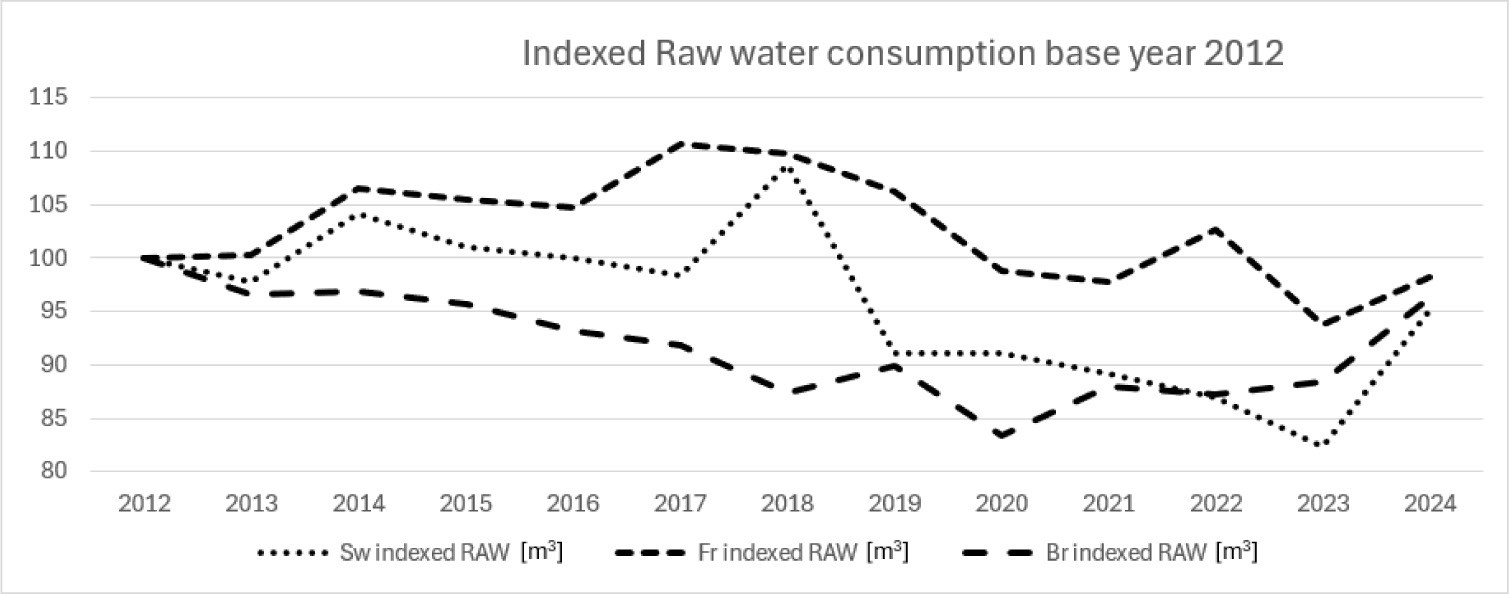
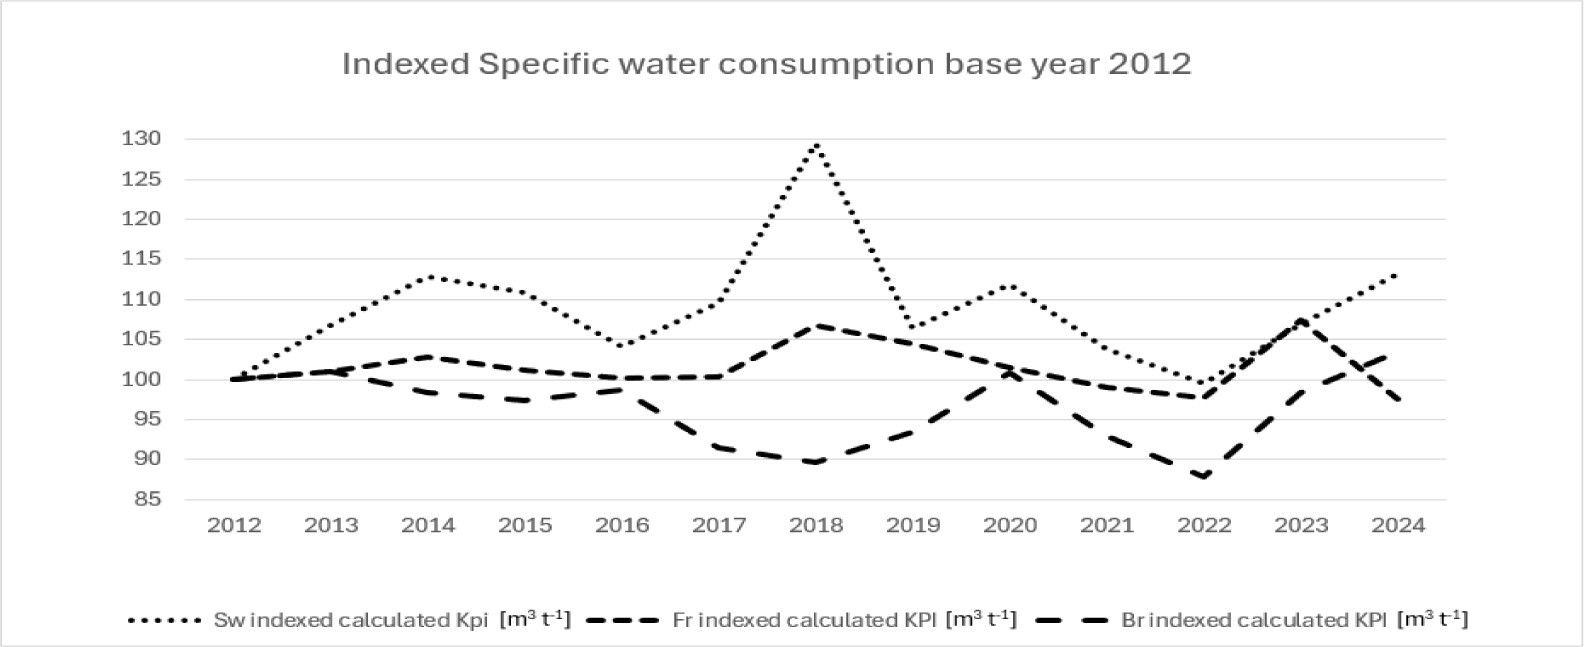
The mills operate in a competitive market, the amount of pulp or paper (sellable product) that has been able to be sold on the market has fluctuated over the years, depending on the general economic situation, pricing and demand for the products (Figure 7). Additionally, the three mills total water consumption have developed differently over the past 12 years. At a first glance, it seems that the mills in Sweden and Brazil both have manged to decrease and the mill in France have increased their intake of raw water (Figure 8). However, when calculated per tonne sellable product (Figure 9), the French mill has a plainer curve.
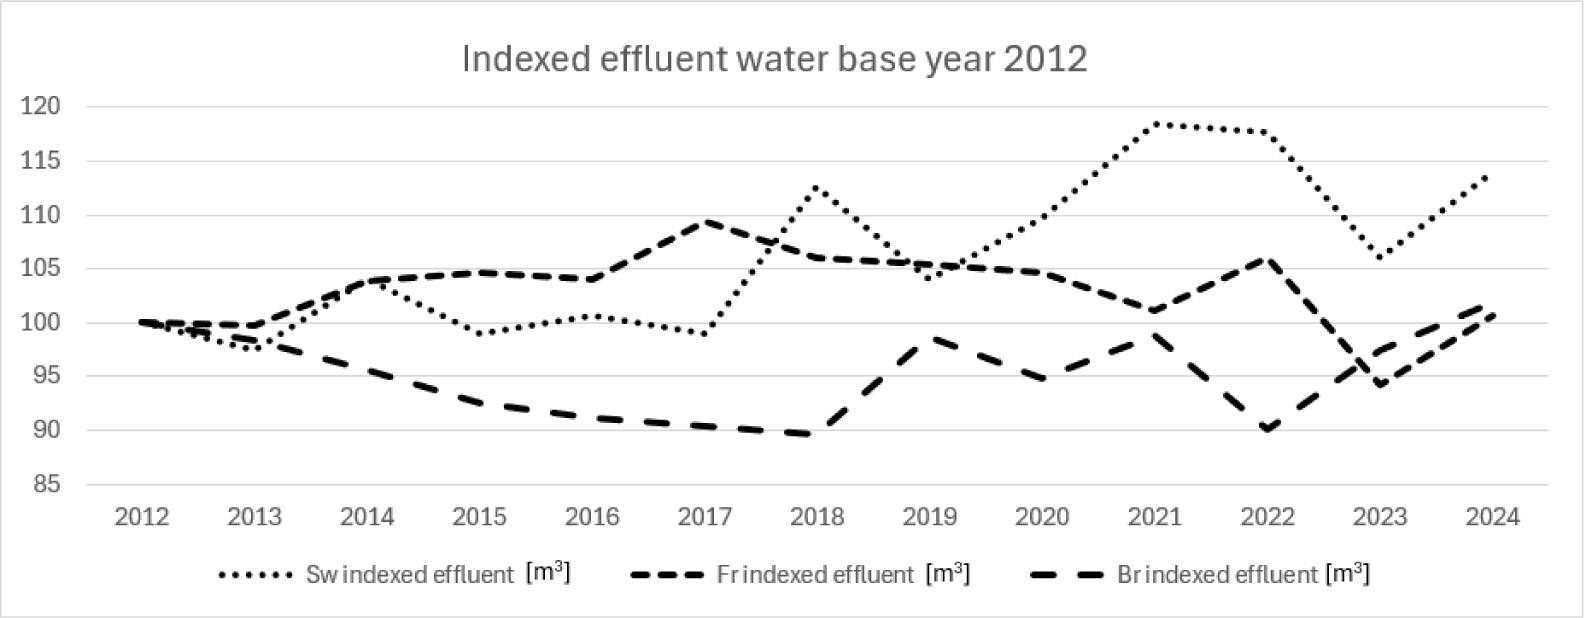
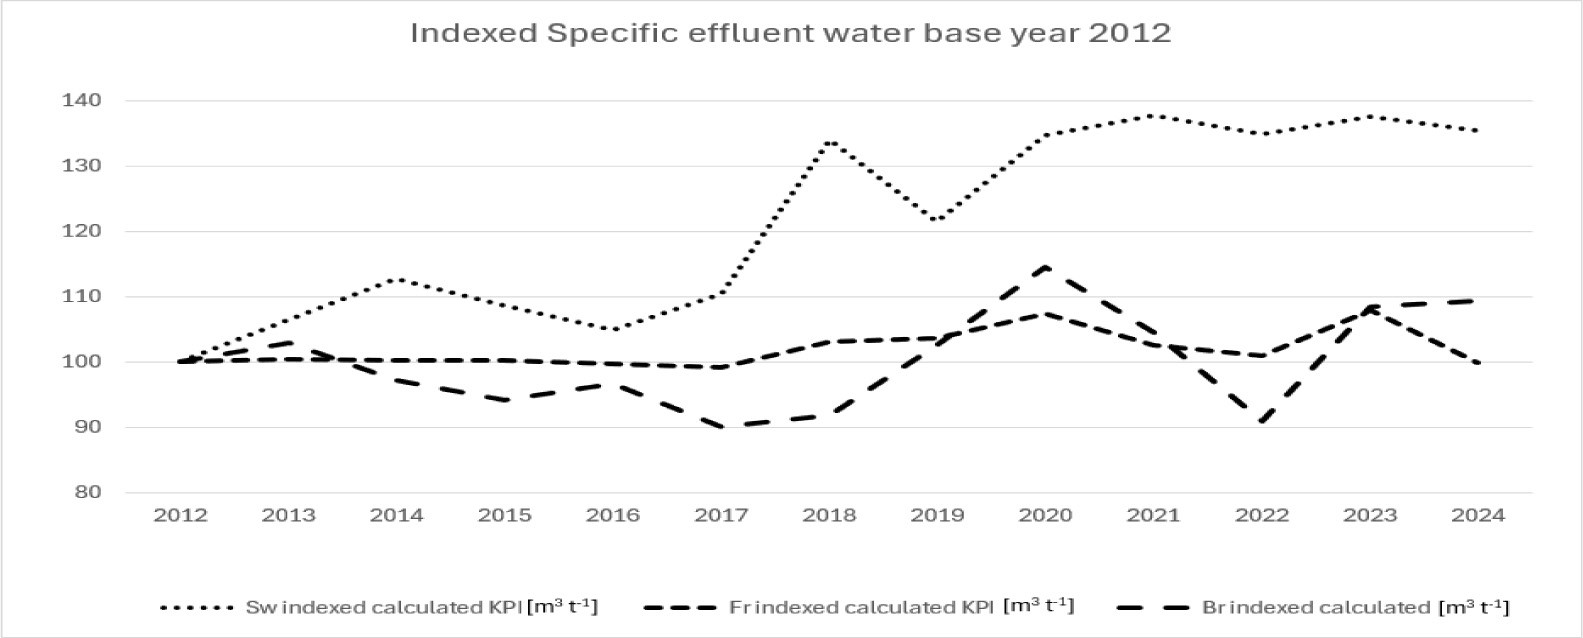
The amount of raw water used by the mills has an overall trend of decreased use for all three, even though 2024 increased again. 2018 stands out for the Swedish mill, 2018 was an extreme year in Sweden with a severe draught, which led to water shortages that had a major impact on production capacity. They had low water in the lake that is their water source and therefore had to stop production for 1.5 months in October and November. The mill has an effluent baseflow at zero production of 120 m3/h. In 2018 Sweden had a water shortage for the first time and it was followed by water-saving actions at the mill, that seems to have improved water awareness, with a lower water intake as a result. However, the flow of effluent water is still high. The mill in France have worked with water management for several years, they appointed a water responsible person and performed project for determination of waters true cost. The mill in South America have had recurring water shortage over the years and a continuous focus on water access, resulting in the lowest intake of water. Interviews have also confirmed that water management is high on their agenda and that they are always aware of the possibility of a process stop due to water shortage. Moreover, in times of strained water situation they form a weekly water management group and have a higher awareness of water.
This study focuses on the management and optimisation of existing internal water flows within the production process, as significant efficiency improvements can often be achieved without major capital investments. In contrast, the fundamental process design of pulp and paper mills is largely static, since substantial modifications typically require extensive capital expenditure and long implementation timelines. To deepen the understanding of site‑specific water management practices and to contextualize the quantitative data obtained from the three mills, semi‑structured interviews were conducted with personnel responsible for water governance at each facility. This qualitative component was designed to elicit nuanced insights into operational routines, managerial priorities, and organizational responses to both acute and chronic water‑related challenges. The interviews also served to illuminate how institutional culture, regulatory environments, and local hydrological conditions shape decision‑making and influence the development of water management strategies. By integrating these perspectives with the technical data analysis, the study aims to provide a more comprehensive and multidimensional understanding of water management across the mills.
In 2018, the facility experienced its first significant water shortage, triggered by an extended period of drought that lasted from April through the end of October. As of April 2026, hydrological conditions are once again approaching those critical levels, with precipitation patterns and reservoir levels closely resembling those of 2018. This recurrence has raised concerns about the facility’s resilience to prolonged dry periods and the adequacy of current water management strategies.
In response to the 2018 event, a comprehensive package of water conservation measures was developed and partially implemented. While these measures succeeded in reducing water consumption, they also had a substantial impact on production capacity, underscoring the need for more integrated and efficiency-oriented solutions. To strengthen governance and strategic oversight, a dedicated Water Manager was appointed, and a cross-functional steering group was established to coordinate water-related initiatives. Although key performance indicators (KPIs) have been defined for certain parts of the process, they are not yet actively used for operational decision-making. Trend data is available at an aggregated level, and while some sub-process measurements exist, they are insufficient to support a real-time, plant-wide water balance. As a result, water management remains largely reactive, with environmental reporting conducted retrospectively on a monthly, quarterly, and annual basis.
Despite these limitations, a quantified action plan for water use reduction has been developed, identifying specific measures and their expected impacts. However, these initiatives require structured project planning and prioritization to move from concept to execution. Investment decisions are supported by cost calculations that include chemical usage, thermal energy, and pumping energy, although there is currently no water tax or fees in the country to further incentivize conservation.
Looking ahead, several major process modifications are under evaluation, with water demand explicitly considered in feasibility assessments. The company also plans to implement a Manufacturing Excellence framework, including Six Sigma methodologies at the Green Belt level, in areas where energy and water efficiency have been identified as strategic priorities. Furthermore, water-related goals and KPIs are being aligned with ISO 14001 (Environmental Management) and ISO 50001 (Energy Management) standards, supporting the integration of water efficiency into broader sustainability and operational excellence objectives.
At the French mill a designated Water Manager is in place, providing leadership and oversight for water-related initiatives. Since the introduction of the Manufacturing Excellence program around 2015–2016, a structured water conservation strategy has been implemented. As part of this initiative, a Green Belt project focusing on water efficiency was launched and is now being adapted for deployment at the Swedish mill. This project introduced systematic measurement practices, including both temporary and permanent monitoring systems, which laid the foundation for the development of a comprehensive water balance model.
An actionable roadmap was subsequently formulated, identifying specific measures to enhance water efficiency. External consultants were engaged to conduct a cost-benefit analysis, quantifying both the financial and operational impacts of proposed interventions. This analysis contributed to the formulation of a "true cost" model for water, incorporating not only volumetric pricing but also associated energy consumption per cubic meter of water handled, an important driver in many cases.
Despite these advancements, it remains unclear whether water-related initiatives are formally integrated into the company’s ISO 14001 (Environmental Management) or ISO 50001 (Energy Management) systems. Clarifying this alignment would be beneficial for ensuring that water management is embedded within the broader sustainability and energy efficiency frameworks.
Water shortages occur intermittently, and while awareness tends to increase during periods of visible scarcity, such as when watercourses run dry, this awareness often diminishes once conditions normalize. In recent years, however, the strategic importance of water management has been elevated within the organization. A central working group has been established at the corporate level to address water-related issues more systematically. This initiative gained further momentum in the autumn of 2024, when representatives from the group’s Sustainability division conducted a comprehensive review, providing valuable insights and reinforcing the urgency of proactive water governance.
Water abstraction is subject to volumetric pricing on a monthly basis, and treated effluent is also metered and priced based on both volume and chemical oxygen demand (COD), using a fixed-rate model. Despite these mechanisms, the current pricing structure is widely regarded as insufficient to function as an effective policy instrument at the national level, offering limited incentive for significant behavioural or technological change.
Systematic efforts to reduce water consumption have been implemented over time, and long-term trend data is available. However, while key performance indicators (KPIs) for water use have been defined, they are not actively integrated into operational management or decision-making processes. Water-related targets are formally linked to the ISO 14001 environmental management system, yet the practical application of these targets remains limited. Furthermore, it remains unclear whether a comprehensive and transparent water pricing model is in place across all operational units.
The organization has expressed interest in adopting a structured self-assessment tool to evaluate water performance and identify areas for improvement. A water-related questionnaire has also been circulated, indicating a growing recognition of the need for more robust internal diagnostics and stakeholder engagement in water management. A cross-case comparison over the information collected from interview of the water management at the three mills is visualised in Table 1.
Question Areas |
Swedish Mill |
French Mill |
Brazilian Mill |
|---|---|---|---|
Bat |
European mill and followed |
European mill and followed |
Not covered by the European BAT Framework |
Water risks |
Awareness since lack water for the first time 2018 |
No water related risks identified |
Water risks are on the agenda |
Water management |
Water contact person & water responsible |
Water contact person & water responsible |
Water contact person |
Water footprint |
Ten toes and Paper profile have no water footprint questions |
Implemented |
Implemented |
Water scarcity |
Occurred first time ever 2018 |
No |
On the agenda and readiness |
Water targets |
ISO 50001 & ISO 14001 |
ISO 14001 |
ISO 14001 |
Water kpi |
Defined on paper mill but not in used on daily base |
- |
Defined not in use |
Water price |
Calculated on demand |
True cost calculated |
- |
Water fee |
No |
Water intake and water effluent |
Water intake and water effluent |
Water fee as driving force |
n/a |
No, too low to drive water savings |
No, too low to drive water savings |
Action list |
List actions available |
Structured working model for water savings |
Systematic working model |
Training & education |
Part ISO 50001 & ISO 14001 |
- |
October 2024 – March 2025 |
Continues improvement |
Manufacturing Excellence Green Belt to be implemented 2025 |
Manufacturing excellence Green Belt |
Systematic approach for improvements |
In the semi-structured interviews, it emerged that a self-assessment is considered to be an interesting tool. However, it should be carried out at the mill level, and the results can serve as a basis for experience exchange. It was deemed not possible to conduct a self-assessment at the corporate group level because the questions are specific. At the different paper mills, they were asked to self-assess their experiences and how far they have come in their water-saving efforts. They were asked to analyze based on three different aspects: BAT (Best Available Techniques), Water footprint, Water Risk.
In the self-assessment according to the industry-specific BAT criteria, the French mill scored high technically, while the Swedish mill generally scored the lowest (Figure 12). It is particularly interesting to compare how each mill has implemented technical solutions. While “Monitoring and optimizing water usage” is twofold: there can be measurement and monitoring without optimization being carried out in practice, and to some extent also the opposite.
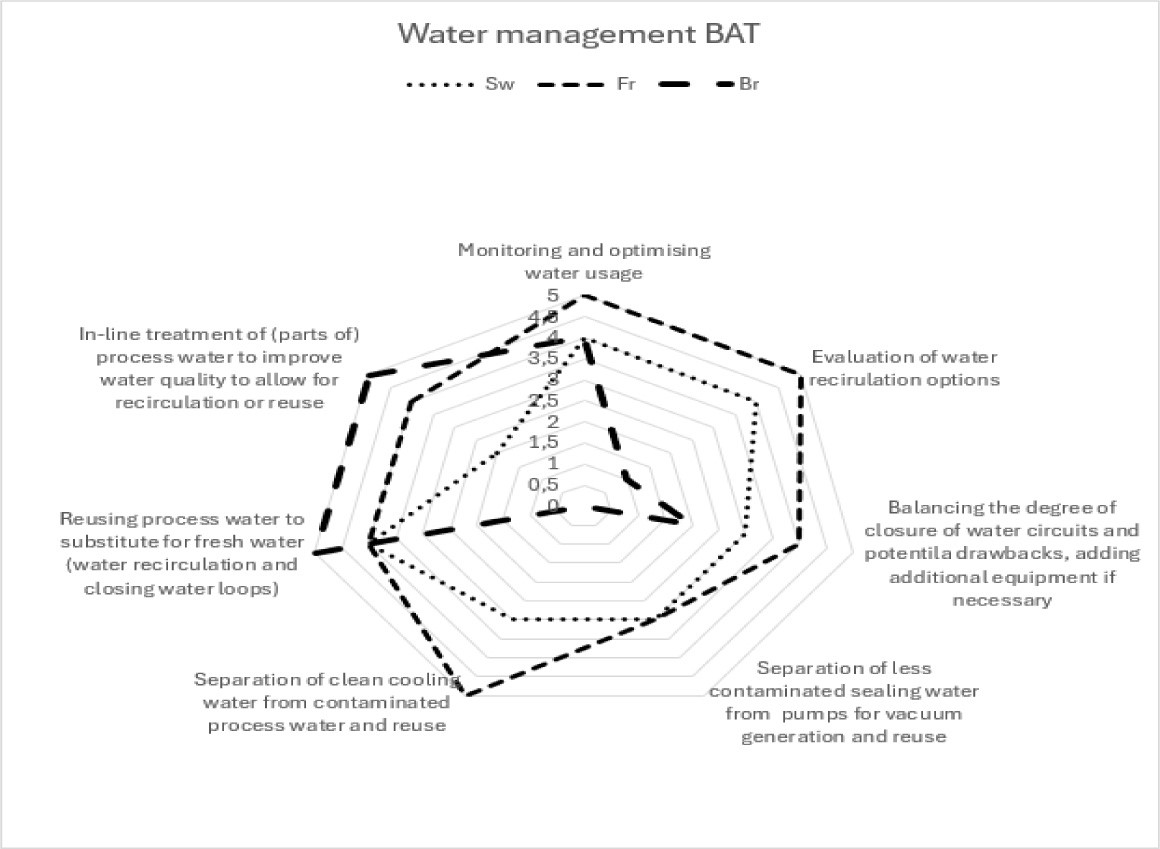
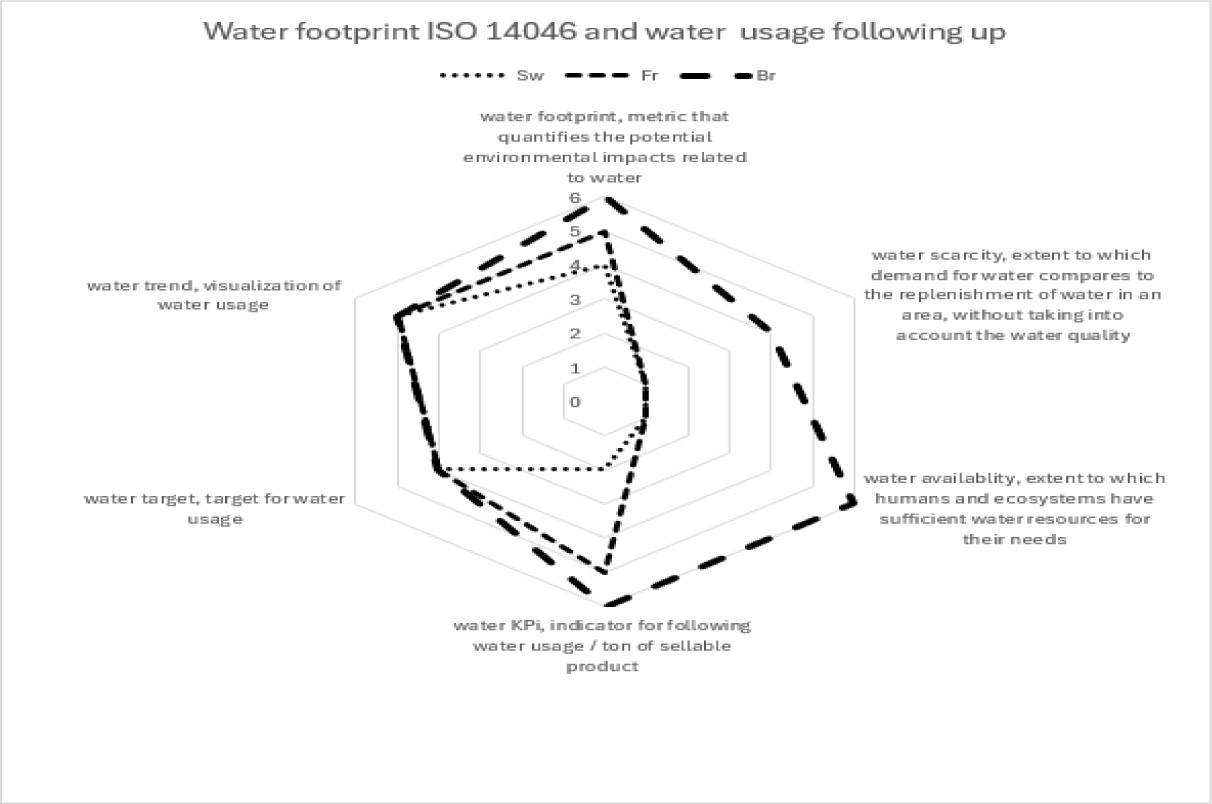
The ISO 14046 standard for water footprint provides a framework for how water management can be implemented in a structured way, even though issues such as KPIs are also indirectly addressed in the environmental management standard ISO 14001 and the energy management standard ISO 50001. In the context of water footprint, the water issue becomes clear and in focus. The Brazilian mill scores high on water availability, while the other two mills score equally low. This is an area that could serve as a basis for discussion between the mills for knowledge and experience exchange (Figure 13).
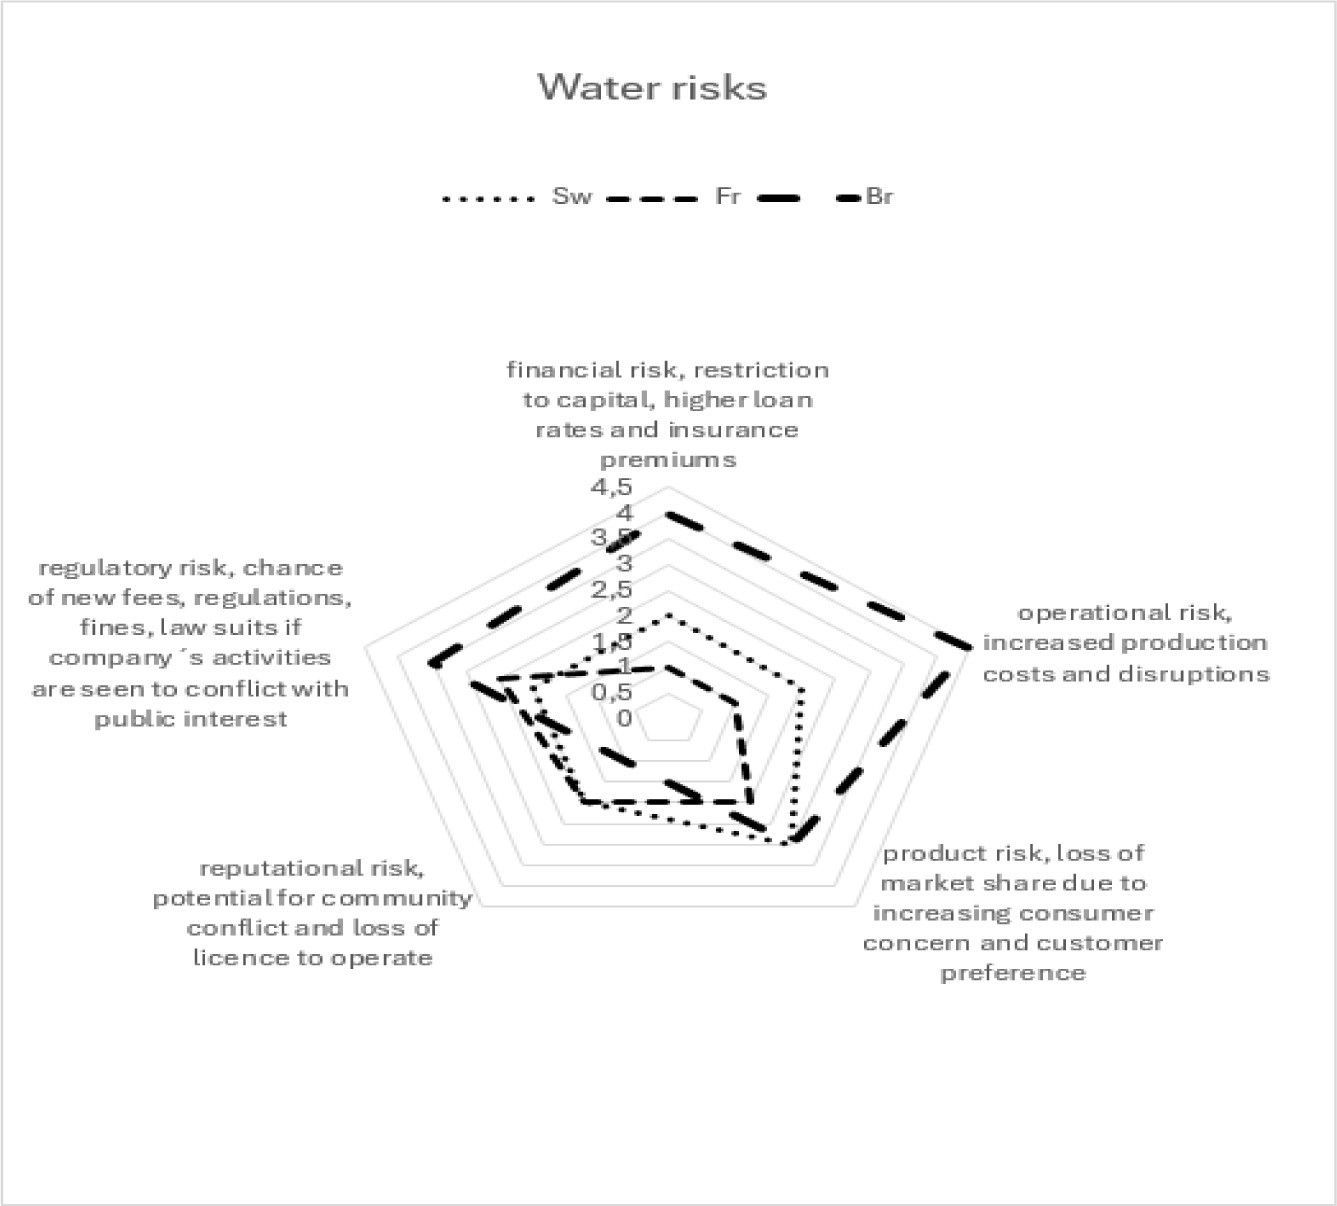
In the self-assessment regarding water-related risks (Figure 14), it emerged that all three mills perceived a low risk of reputational damage and conflict with the surrounding community.
The French mill consistently experienced and scored low. The Brazilian mill, with recurring risks of water shortage situations, generally scored higher and expressed a higher level of water-related risks. The Swedish mill scored higher than the French mill, but the pattern of the curve is similar for all mills, though at different levels. The French mill has not experienced any water shortage situations, which the other two mills have.
The hypothesis is largely fulfilled by the empirical findings of the study through both quantitative trends and qualitative evidence from the case mills. The company has made meaningful progress in water management; however, it still faces several strategic and operational gaps that need to be addressed to fully integrate water management into its sustainability framework.
A clear example of progress can be seen at the French mill, it focused on the water issue 2016-17, water reductions was identified as profitable and personnel trained in water management, which improved their water competence to reduce. The appointment of a dedicated Water Manager and the initiation of a structured water conservation program under the Manufacturing Excellence initiative demonstrate a clear organizational commitment to improving water efficiency. The Green Belt project appears to have been a catalyst for introducing measurement systems and developing a water balance, which are foundational steps in any robust water management strategy. The use of external consultants to evaluate the cost-effectiveness of water-saving measures and the development of a "true cost" model, factoring in energy consumption per cubic meter of water, reflect a mature approach to resource valuation. This is especially important in industrial settings where water and energy use are tightly coupled, and where operational decisions can have cascading effects on both cost and environmental impact.
In Brazil, the mill has adopted a routine practice of comparing raw water intake with effluent discharge to detect anomalies and inefficiencies. Historical operational disruptions due to water shortages have heightened awareness and led to the implementation of weekly water management meetings during the dry season, an initiative credited with saving approximately 1.5 million cubic meters of water annually. This heightened awareness has also driven staff training in water and sustainability practices. While the mill has invested in additional water measurement points and process improvements, it has not yet undertaken major layout changes.
Three paper mills in Brazil, France, and Sweden self-assessed their performance (Figure 12 - Figure 14) in water management (BAT), water footprint (ISO 14046), and water-related risks. The Brazilian mill shows the most advanced technical solutions and strong operational KPI tracking but faces higher operational and financial risks due to recurring water shortages. The French mill excels in water footprint and scarcity analysis but lacks full integration of operational KPIs and reports the lowest risk exposure. The Swedish mill scores lowest on BAT and moderately on footprint and risks, indicating the need for foundational improvements and stronger risk awareness. The self-evaluations are a good tool for starting discussions between the different water management teams.
This study focus on water management within the mills, covering water intake and its internal use in the production processes up to the point where water enters the wastewater treatment system, which marks the final step of the defined water system boundary. The operation and management of the wastewater treatment plant were excluded from the scope of the study. As the mills employ different pulp production processes, they are not directly comparable in terms of specific water consumption per tonne of paper produced.
Clearly, there is competence developed at the different mills that can be beneficial for others. The approach taken in this work to identify and document best practices for potential transfer across other mills within the organization represents a strategic and scalable pathway for operational improvement.
However, the discussion also reveals several areas where integration and governance could be strengthened. For instance, while KPIs and trend data exist, they are not actively used in day-to-day management, which limits the ability to make data-driven decisions. Moreover, the lack of clarity around whether water initiatives are formally linked to ISO 14001 or ISO 50001 suggests a missed opportunity to embed water management within the company’s certified environmental and energy management systems. The interest in a self-assessment tool and the circulation of a water questionnaire indicates a growing awareness and willingness to improve. These tools could help bridge the gap between strategic intent and operational execution by enabling more consistent evaluation, benchmarking, and continuous improvement.
In summary, the company is progressing along a promising trajectory, with essential foundational elements already established. The next phase should prioritize the systematic transfer of best practices across all mills, the integration of water management into certified environmental and energy management systems, the operationalization of KPIs, and enhancing real-time monitoring capabilities to improve resilience to water scarcity.
In line with the contemporary literature on industrial water management, the findings of this study reinforce the view that effective water management is primarily driven by governance, organizational capability, and systematic use of data rather than by large‑scale technological change alone. Previous research highlights that significant improvements in water efficiency can be achieved within existing process configurations by strengthening monitoring, responsibility, and decision‑making structures. The results further demonstrate that mills exposed to higher water‑related risks tend to prioritize water management more strongly, supporting the argument that water scarcity functions as a key driver for organizational learning and maturity in water stewardship.
Based on both the empirical findings and established best practice in the field, three key elements emerge as critical for advancing industrial water management:
Apply a system perspective to water management with demonstrated leadership and organizational commitment across all levels of the organization.
Define roles, responsibilities, and authorities for water management, including designated water coordinators and accountable process owners for water‑dependent operations.
Establish systematic monitoring, measurement, and evaluation of water performance, preferably through real‑time or online water balances, to support continuous improvement and informed decision‑making.
These elements provide a practical and scalable foundation for strengthening water management within existing industrial systems while aligning with recognized standards and sustainability frameworks.
- ,
The blue revolution: sustainable water management for a thirsty world ,Discover Sustainability , Vol. 6 , 2025, https://doi.org/10.1007/s43621-024-00631-6 - ,
Modelling effluent reuse in the pulp and paper industry to predict consequences on conductivity ,Water Science and Technology , Vol. 89 (10), :2646-26602024, https://doi.org/10.2166/wst.2024.113 - Best Available Techniques (BAT) Reference Document for the Production of Pulp, Paper and Board Industrial Emissions Directive 2010/75/EU (Integrated Pollution Prevention and Control), 2015Report, EUR 27235 EN, JRC95678
- ,
Sustainable Utilization of Pulp and Paper Wastewater ,Water , Vol. 15 (23), :41352023, https://doi.org/10.3390/w15234135 - , Sustainable Practices in Pulp and Paper Industry Effluent Management: A Review of Current Trends, Technological Advancements in Waste Management: Challenges and Opportunities, 2025
- ,
A Comprehensive Review on Pulp and Paper Industries Wastewater Treatment Advances ,Industrial & Engineering Chemistry Research , Vol. 62 (21), :8119-81452023, https://doi.org/10.1021/acs.iecr.2c04393 - ,
Wastewater Treatment and Reclamation: A Review of Pulp and Paper Industry Practices and Opportunities ,Bioresources , Vol. 11 (3), :7953-80912016, https://doi.org/10.15376/biores.11.3.Hubbe - ,
A review of process and wastewater reuse in the recycled paper industry ,Environmental Technology & Innovation , Vol. 24 , 2021, https://doi.org/10.1016/j.eti.2021.101860 - ,
Optimisation of Water-Use in Pulp and Paper Mills: A Streamlined Review of Scientific Journal Publications ,Studia Ecologiae et Bioethicae , Vol. 22 (3), :95-1052024, https://doi.org/10.21697/seb.5813 - ,
Integrated forest biorefinery network design under demand uncertainty: a case study on canadian pulp & paper industry ,International Journal of Production Research , Vol. 60 (16), :4954-49722022, https://doi.org/10.1080/00207543.2021.1944688 - ,
Energy efficiency and environmental assessment of papermaking from chemical pulp - A Finland case study ,Journal of Cleaner Production , Vol. 198 , :96-1112018, https://doi.org/10.1016/j.jclepro.2018.07.018 - ,
Uncovering energy use, carbon emissions and environmental burdens of pulp and paper industry: A systematic review and meta-analysis ,Renewable and Sustainable Energy Reviews , Vol. 92 , :823-8332018, https://doi.org/10.1016/j.rser.2018.04.036 - ,
Optimizing Brown Stock Washing in the Pulp and Paper Industry: A System Dynamics Approach ,Processes , Vol. 13 (2), 2025, https://doi.org/10.3390/pr13020368 - ,
A bibliometric study on water management accounting research from 2000 to 2018 in Scopus database ,Cogent Soc. Sci. , Vol. 7 (1), 2021, https://doi.org/10.1080/23311886.2021.1886645 - ,
Management of Water Consumption in Pulp and Paper Industry - A Case Study using Water Sources Diagram ,Chemical Engineering Transactions , Vol. 39 , :1255-12602014, https://doi.org/10.3303/CET1439210 - ,
The role of water auditing in achieving water conservation in the process industry ,Journal of Cleaner Production , Vol. 52 , :356-3612013, https://doi.org/10.1016/j.jclepro.2013.03.032 - , Environmental Management – Water Footprint – Principles, Requirements and Guidelines (ISO 14046:2014), 2014
- , Key Statistics 2023: European Pulp & Paper Industry, 2024
- , Regional Scorecard, Global Water Monitor
- Climate Change 2023: Synthesis Report. Contribution of Working Groups I, II and III to the Sixth Assessment Report of the Intergovernmental Panel on Climate Change 35-115, 2023Report, Core Writing Team
- , Actual groundwater levels (in Swedish, Aktuella grundvattennivåer)