


When it comes to renewable energy sources, Photovoltaic (PV) systems play an important role in energy production. Mostly, PV systems are based on polycrystalline silicon technology, which cover over 90% of the market [1]. This technology is commercially widely available. In order to predict the energy output of typical PV system, one needs to take into account the operating temperature of the PV panel, because this information dictates the amount of yielded power from the system. This is widely known as a thermal degradation effect, and its influence on efficiency ranges from 0.25%/°C to 0.5%/°C [2], and it is a subject of many studies which have a goal of reducing the PV panel operating temperature [3]. This dictates the change in Nominal Operating Cell Temperature (NOCT), a data which is used for calculation of average power yield, depending on mean ambient temperature. Nominal operating cell temperature is usually a rough estimate of mean ambient temperature, but it presents the only input which can be used for taking the thermal degradation into account [4].
PV panel’s operating temperature depends of several factors, such as ambient temperature, wind intensity, reflectivity of surrounding and solar inclination and irradiance. Furthermore, PV operating temperature is also dependant of its electrical energy yield. Namely, solar irradiance absorbed in PV cell (aside from higher wavelength irradiance) can either be turned into electrical current, thus leaving the PV panel, or it can be turned into heat by recombination of electron-hole pairs. This shows that electrical power yield indeed is a form of cooling the PV panel. Significant number of researchers modelled the thermal flow from the PV panel. In Nižetić et al. [5], the power yield is presented as a heat loss, but no detailed analysis was performed to define the exact heat loss and its influence on panel’s temperature. In addition, heat flow was modelled in Chopde et al. [6], where the power yield is also presented as a heat loss in global heat equation. When modelling a PhotoVoltaic/Thermal (PV/T) system, Gang et al. [7] proposed a novel system which can simultaneously produce thermal and electrical energy. Experimental results were used for simulation, where electrical energy is taken as a heat loss. In Gagliano et al. [8], a comparison between hybrid and two separate PV and thermal systems was done, again by taking electricity as a heat loss. Zondag et al. [9] also modelled a PV/T and considered generated electrical power yield as a heat loss, in order to get more accurate heat calculation. Study conducted Malwi et al. [10] takes into account a PV/T system with phase change material placed on the back side. Here, authors clearly implement the gained electricity as a heat sink on the PV cell. This should be seen as a correct approach, which yields realistic results. Arcuri et al. [11] modelled air and water cooling methods for PV panels, with electricity taken as a heat loss. In Schiro et al. [12], electricity is taken into account as a heat loss for specific water cooling model of PV panel. The same was done in Vittorini and Cipollone [13], for fin-cooled PV panels. In research by Li et al. [14], a passive cooled PV was modelled, again with electricity taken as a heat loss. Amr et al. [15] analyse thermal equilibrium of PV cell and take into account electrical energy as energy output from the cell. On the other hand, there are studies which do not take electricity as a heat loss. Such study is Bahaidarah et al. [16], where authors model back side water cooling without the electricity. In Laurentiu Alboteanu et al. [17], authors simplify the numerical model and fail to incorporate electricity. In Popovici et al. [18], authors research fin-cooled PV panels and do not integrate electricity into the numerical model. Sarhaddi et al. [19] model a PV/T system also without electricity as a heat flow. In study presented in Shan et al. [20], authors propose a numerical model of a PV/T systems applied on buildings. The presented model does not take into account electricity as a heat flow. All this can be significantly misleading when observing the gained results, since electrical yield corresponds with up to 15% of solar irradiated energy (which represents the peak electrical efficiency of typical commercial PV panel). In Alobaid et al. [21], authors model the PV/T system also without taking into account the electrical yield. The model results differ from experimental ones by up to 5 °C that can be related to the inconsistent modelling (without taking the electricity as heat flow). This can be characterized as an incomplete model, which can be used qualitatively, but its quantitative results are to be taken with caution. Furthermore, modelling of Building Integrated PhotoVoltaics (BIPV) in Abu Hamed et al. [22] also does not take into account electrical energy as heat flow. A question arises, can the results of modelling without proper addressing of the electrical yield be usable and viable in future research.
In order to clearly show that indeed electrical yield should be taken into consideration as a heat flow away from the panel, an experimental and numerical procedure will be used. In this work, a previously developed model in Nižetić et al. [5] will be examined for different heat inputs, in order to simulate the change in heat input for panel with and without electrical yield. The model will be confirmed with in situ thermal imaging. The results should show the difference in temperature between loaded and non-loaded panel (i.e. panel with and without electricity flow).
Two similar PV panels are positioned close to one another and tested in operative conditions of Mediterranean climate in city of Split. First testing condition is the situation where both panels are non-loaded. Both panels are of similar dimensions and identical nominal peak power of 260 WP. This will prove as a good example of the same input parameters and similar thermal field on both panels, when there is no electricity flow. Measurement setup can be seen on Figure 1.
Two PV panels used for measurement
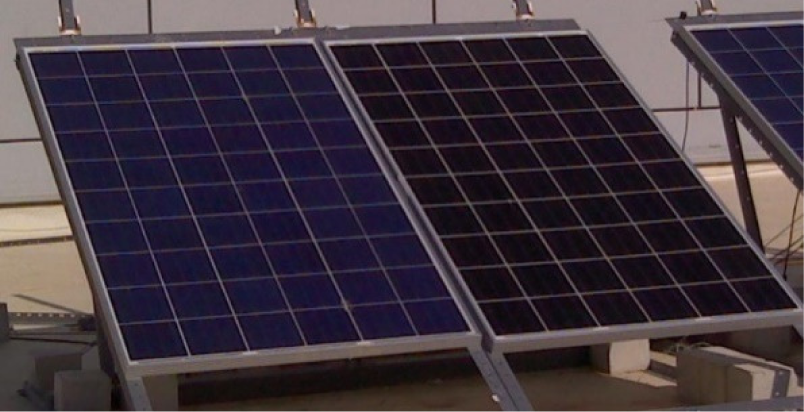
Although at first glance there is a visible difference between panels, the panels are similar in all characteristics except the front appearance, which is the result of different anti-reflection coating. The difference in anti-reflection coating affects mostly the reflection of specific wavelength. In overall, different anti-reflection coatings are used to optimize PV panel for specific wavelength [23]. Since both panels are polycrystalline silicon technology, of similar size and identical peak power, it can be concluded that, for total solar spectrum, there is little difference in reflectivity when total solar spectrum is taken into account. The characteristics of panels in Figure 1 are given in Table 1.
Panel characteristics
| Left panel | Right panel | |
|---|---|---|
| Rated power (PMPP) [W] | 260 (+4.9) | 260 |
| Short circuit current (ISC) [A] | 8.9 | 8.75 |
| Open circuit voltage (VOC) [V] | 38.4 | 36.7 |
| Dimensions [mm] | 1,650 × 992 × 40 | 1,640 × 990 × 34 |
| Weight [kg] | 18.7 | 18 |
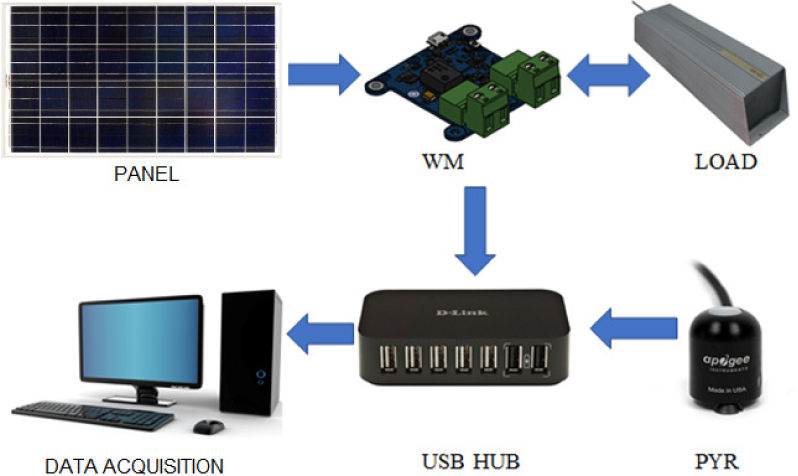
For this measurement, thermal imaging, temperature and solar irradiance measurements were made. Measurement setup and equipment is explained in detail in Henrie et al. [23]. For herein conducted experiment, measurement procedure can be divided on two separate cases. The first case is a comparison of the panels when there is no electrical load on either one of the panels. The second case is a comparison of the panels when one of the panels is under electrical load, and the other is under no load. Solar irradiance was measured with Apogee SP-420 USB Smart Pyranometer. Ambient temperature was measured with the total of 6 PICO K-type thermocouple sensors (detailed position given in Grubišić Čabo et al. [24]). The electrical energy from the panel under load (case 2) is measured with Yoctopuce’s YoctoWatt USB wattmeter. A simplified setup of electricity measurements is presented in Figure 2.
Measurement setup
Measurement error of used equipment is given in Table 2.
Measurement error
| Sensor type | Guaranteed error [%] |
|---|---|
| Pyranometer | < 1.0 |
| Wattmeter | ±1.5 |
| Thermocouple | ±0.2 |
Thermal imaging on this experiment was done with FLIR T 335 camera, equipped with supreme non-cooled micro-bolometer matrix (320 × 240 IR resolution detection and switchable automatic/manual IR focus,) 7.5-13 μm IR range, thermal sensitivity 0.05 °C at 30 °C and temperature range −20 °C to +650 °C.
Additionally, vane anemometer was used to sample wind speed for three consecutive days. It was shown that for this specific location wind speed was not greater than 2 m/s.
Measured results for solar irradiance and temperature are given in Table 3.
Measurement results
| Solar irradiance [W/m2] | 1,075 |
| Yielded electrical power [W] | 0 |
| Yielded electrical power per square meter (surface area of 1.35 m2) [W/m2] | 0 |
| Ambient temperature [°C] | 26 |
Solar irradiance and temperature measurements were used to modify an existing numerical model.
A model developed in Nižetić et al. [5] is used for examining the specific gained results. The model developed in Nižetić et al. [5] is a Computational Fluid Dynamics (CFD) numerical model, where a single panel was examined under realistic conditions. ANSYS Fluent 17.2 was used for the numerical modelling. The flow equations for the surrounding air are based on Reynolds Averaged Navier-Stokes (RANS) equations. Specifically, SST k-v turbulence model was used since is the commonly used for the present application and it was shown to provides good result. Regarding the air density, Boussinesq approximation was used. The heat transfer within the solid domain was modelled with a standard heat equation. Since the solar irradiance is fairly hard to accurately describe in numerical model, the irradiance is removed from both modelling and results in the CFD. Instead, a direct heat load was put in the middle of the panel, thus simulating the absorption of the PV cell. To determine the heat load which will be used in the model, a following approach was used.
Total solar irradiance of 1,075 W/m2 presents insolation intensity from the Sun. However, when determining a heat load on the panel, following needs to be taken into account. The reflection of frontal polypropylene surface can be approximated to 6%, while reflection from silicon cell is around 11%. This gives a heat load of 899 W/m2. This heat load dissipates via two mechanisms, convective and radiative. To simplify the modelling, it will be considered that the radiative component is dissipated in a way that the heat load will be reduced by its radiative dissipation component. To accurately define the radiative component, much more data is needed. Such data is the emissivity, absorbance, stratosphere temperature, air speed, velocity and humidity, etc. This is above the scope of this research, since the purpose of the manuscript is not to accurately model the constantly changing PV operating conditions. An approach from Grubišić Čabo et al. [24] will be used, where it was shown that radiative component could be estimated to 40% of the total heat dissipation. This, of course, depends of many parameters, but this approximation will be sufficient for simple modelling. This gives a heat load of 539 W/m2, which will be used in the model.
The model takes into account the frontal wind of 2 m/s. This is a realistic assumption proven by measurements, however, it is expected that the wind direction in situ will not necessarily be frontal, and it could have a high turbulent component. The results of the model are presented in continuation. It can be seen that model predicts maximal temperature of around 57 °C which should be the case for both panels. Average panel temperature is around 50 °C. This is shown on Figure 3. The temperature data in the numerical simulation can be extracted on the surface nodes of the cell faces on both sides of the interface between the polypropylene layer and the air. Here, nodes on the polypropylene sides were used and the plotted temperature values obtained by interpolating the results between the nodal values.
Temperature distribution on the upper surface of the PV panel from the numerical simulation
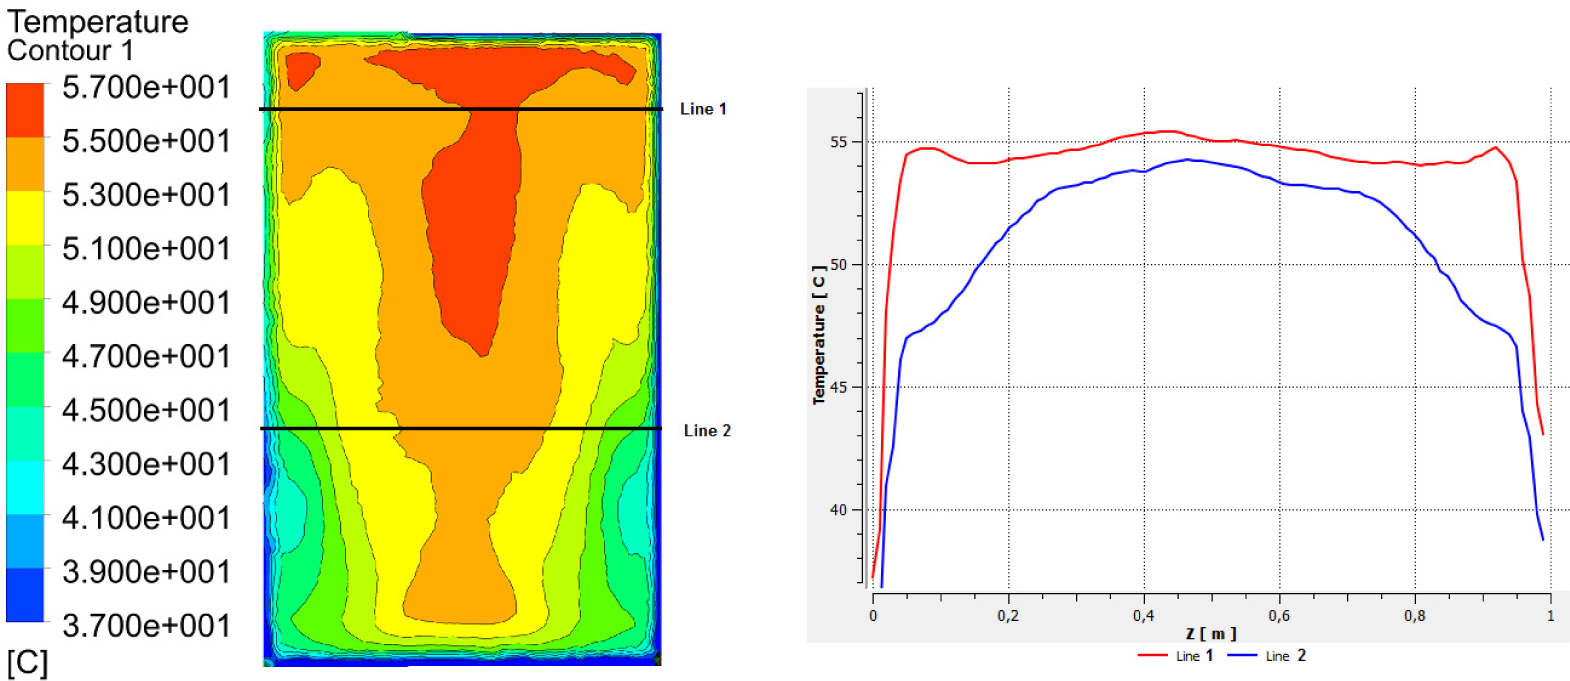
In model, there is sizeable heat dissipation at the edges of the PV module. In reality, this is not always the case, because the mechanical connection with the frame is usually done with insulating material. The lines placed in Figure 3 (and for which the temperature is extracted) correspond with the position of thermocouples placed on the back side of the panel which was tested under load in Grubišić Čabo et al. [24]. This was done in Grubišić Čabo et al. [24] in order to further prove the results of thermal imaging with numerical model results.
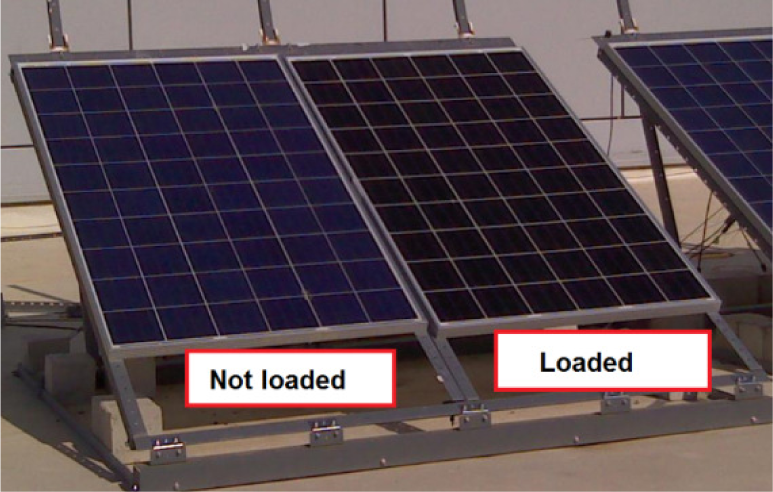
The second case covers the situation when one panel is loaded, i.e. there is an electrical flow which takes away the heat. In this setup, one panel is not under load, while the other is loaded with 4.7 a, 1 kW resistive load. This load is initially intended for several serially connected PV panels, but it is expected that the system will yield comparable results with this setup. The setup is positioned as presented in Figure 4.
Experimental setup
Measured results, which will be used in numerical model, are given in Table 4.
Measurement results
| Solar irradiance [W/m2] | 973 |
| Yielded electrical power [W] | 162 |
| Yielded electrical power per square meter (surface area of 1.35 m2) [W/m2] | 120 |
| Ambient temperature [°C] | 28 |
Following the previously described procedure, a similar approach as in first case was used.
Total solar irradiance of 973 W/m2 presents insolation intensity from the Sun. The reflection of frontal polypropylene surface can be approximated to 6%, while reflection from silicon cell is around 11%. This gives a heat load of 814 W/m2. If gained electricity is taken away from this heat load, a total heat load on the panel should be 694 W/m2. The radiative heat flow from the panel can be assumed at 40% of total heat flow. This gives a heat load of 416 W/m2, which will be used in the model.
To model the panel which is not under electrical load, gained electricity will not be subtracted from the heat load. Heat load will also be reduced by omitting radiative heat flow, which in total gives a heat load of 488 W/m2. The results of the model are presented in Figure 5.
Temperature distribution on the upper surface of the PV panel from the numerical simulation for two different heat loads of PV panel: 488 W/m2(a) and 416 W/m2(b)
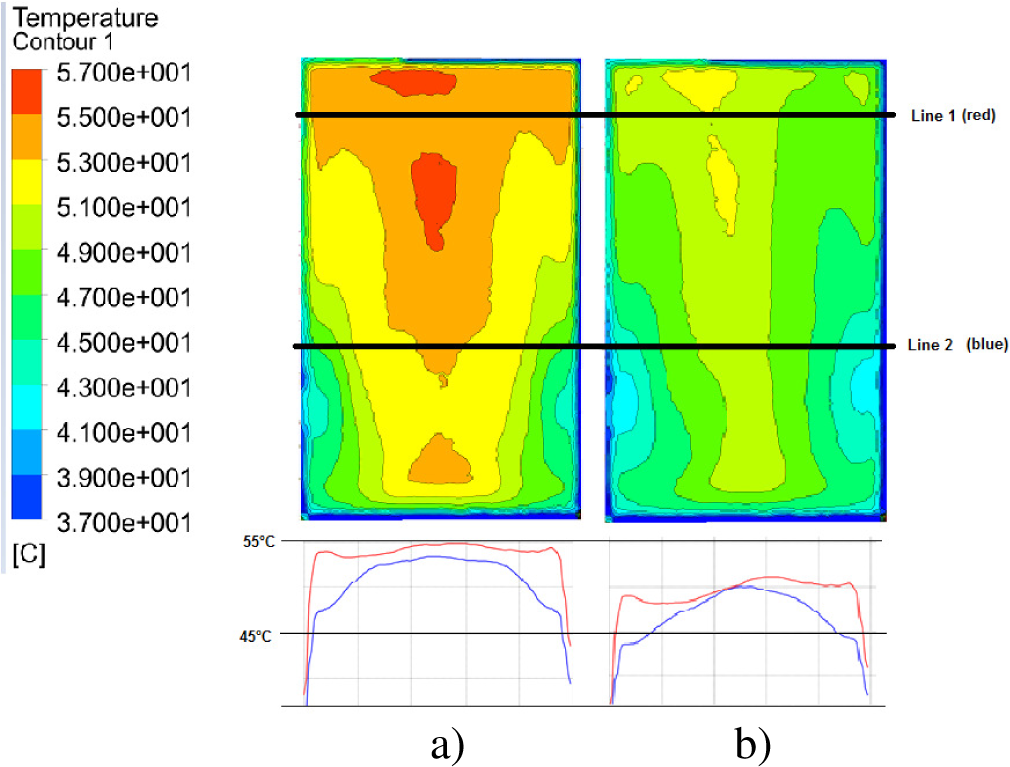
The results of numerical model show that the temperature of the loaded panel, for identical airflow conditions (2 m/s of frontal wind), goes down by up to 4 °C. This, however, strongly varies and depends of the observed area of the PV panel. The lines presented show characteristic parts of the panels.
Infra-Red Thermography (IRT) is a diagnostic procedure which helps monitoring the temperatures and heat flows of a specific system. The relevant wavelength range of electromagnetic irradiance which is taken into account at IR thermography is roughly between from 800 nm up to 14 µm [25], [26]. The irradiance detection by the IR thermography is done by IR camera, which picks up the electromagnetic waves emitted from the monitored object. The reflected electromagnetic waves are also collected, significantly influencing the measurement results, which are considered via specific reflection and emission coefficients. Accuracy of the measurements is additionally confirmed by placing calibrated markers characterised with well known emissivity on the panel surface. Markers are small enough to prevent panel shading. This way, reflection and emission coefficients are calibrated with sufficient degree of accuracy.
When PV panels are monitored, one needs to take into account the average emissivity of the front PV panel layer. In this case, a polycarbonate layer is compared with the material of known emissivity, and shown to have an emissivity factor of 0.95. Also, one should take into account the solar irradiance and try to avoid its reflection from the panel, since this would render the results unusable. It is because of this why specific measurement angle is used with respect to axis perpendicular to panel surface. Namely, reflections originating from the glass surface result in the surrounding objects with different temperatures being clearly visible in the thermograph. Aforementioned fact in general case results in misleading measurements. Consequently, one should not position the IR camera perpendicular to the module being inspected. An angle of 5-60° determined with respect to perpendicular axis is a valid measurement approach. It is always recommended to have an independent thermal probe measurement, with which IR thermography results can be quantitatively confirmed. Nevertheless, the thermography results can be compared with a high degree of accuracy, if the results are taken at the same time, from the same angle.
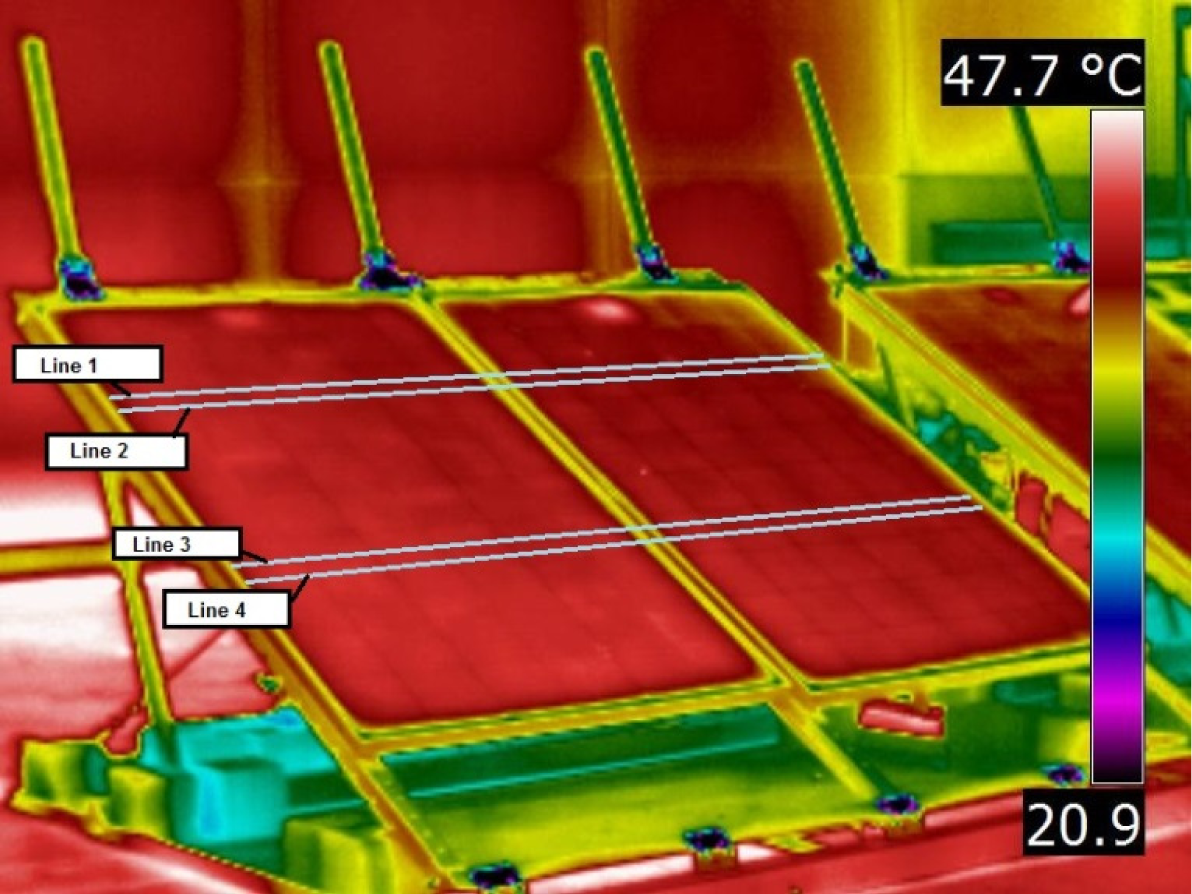
It is also important to notice that thermography is detecting the apparent temperature at the surface of the PV panel, although the heat source is actually from the silicon cell inside the panel. Thus, the thermal imaging gives information of the temperature of frontal layer, which is actually polycarbonate cover. In the range of observed wavelengths (7.5-13 μm), polycarbonate indeed shows high opaqueness. Polycarbonate is heated by silicon cell, and since it has low thermal conductivity, when compared to silicon cell, boundaries of silicon cells can be seen. This can clearly be seen on Figure 6.
For the first case, thermal imaging gives approximately the same temperature for both panels. The difference in temperature is less than 1 °C on average. The results of the first case are shown on Figure 6 and Figure 7.
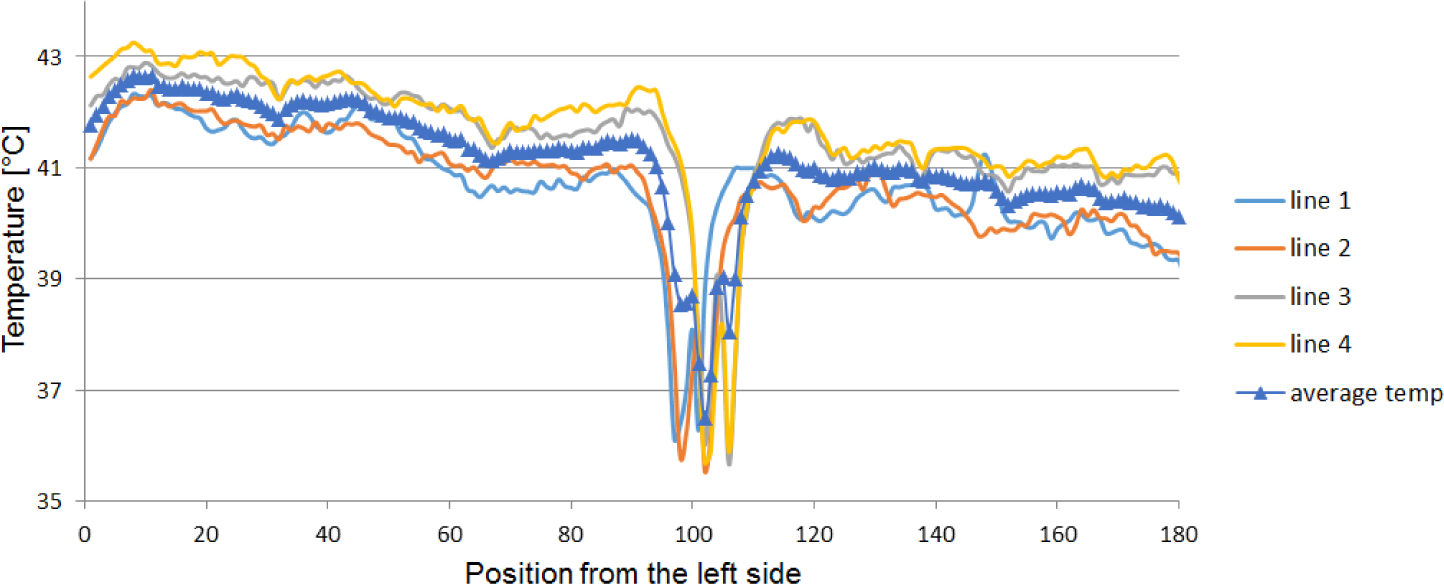
Analytical post-processing enables the determination of apparent temperature following the marked lines, as presented on Figure 6. This temperature is not quantitatively confirmed, but the comparison between temperatures can be defined as accurate. The result of the temperature analysis is given in Figure 7.
Note that the temperature difference of up to 1 °C can be a result of change in emissivity of PV surface with the angle of imaging. Nevertheless, it can also be a result of higher emmisivity for the PV panel on the right, because of different anti-reflective coating. Also, possible causes can be possible wind flow direction from the right side.
The panels are again analysed for second case, where one panel is loaded, and the other is not loaded. It can be clearly seen that the loaded panel is cooler than the non-loaded panel.
Thermal imaging from the front side for both panels
Temperature distribution on two non-loaded panels
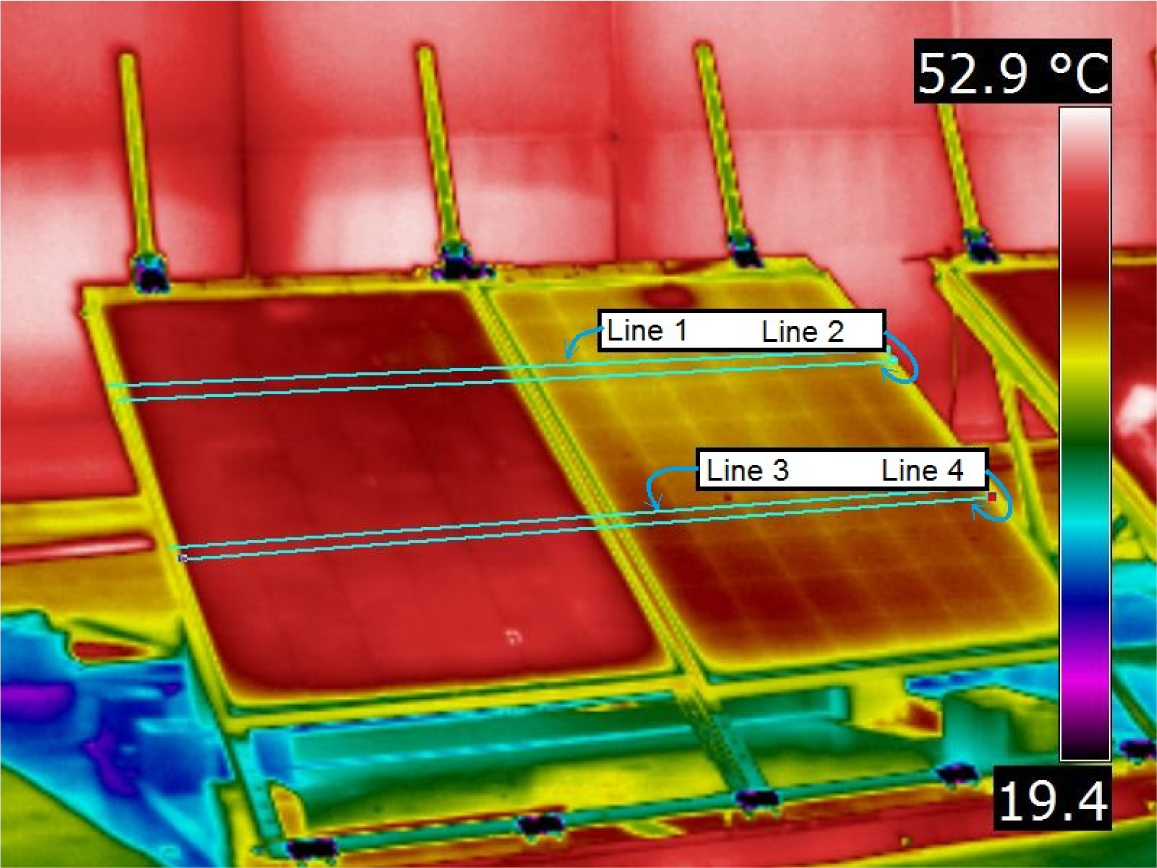
The measurement results are presented in Figure 8, where the cell boundaries can also clearly be seen.
Thermal imaging of the examined panels
The results of analytical post-processing can be seen on Figure 9.
Temperature distribution on loaded and non-loaded panel
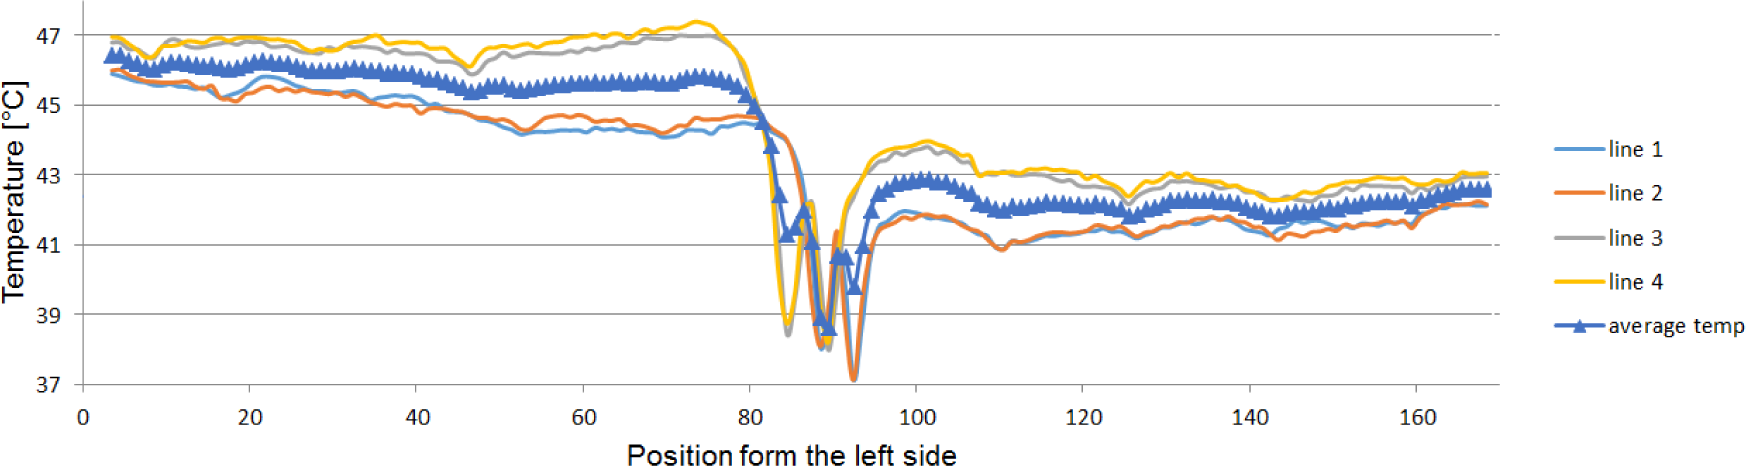
By the analysis of the data from Figure 9, it can be seen that operative, loaded PV panel has 3.6 °C lower surface temperature than non-loaded panel. When compared with numerical model, the same effect can be seen, which gives confidence in developed model and measurement process.
The results gained both from numerical modelling and thermal imaging require additional discussion and clarification. Namely, it can be seen that numerical modelling for the first case of measurement gives different results than thermal imaging. This is to be expected due to several reasons. The modelling of free-standing PV panel under operating conditions requires much more parameters in order to yield quantitatively accurate results. Also, specific wind conditions for observed case cannot be adequately defined.
The difference when compared to thermal imaging can be also attributed to the precision of its results. The accuracy of thermal imaging can easily vary because of the angle of the Sun, both to horizontal plane and its azimuth. Also, there is a significant role of measuring angle. All these parameters cannot be taken into account fully in this manuscript, since the purpose of the manuscript is to experimentally prove that there is a difference in temperature for operating and non-operating PV panel. To gain better results, much more measurements should be made and analysed, and model should be updated with more experimental data and validations.
Thermal imaging, on the other hand, gives relatively good estimation of temperature difference, given the circumstance that two compared surfaces have approximately the same emissivity factor. This is the case for both case 1 and case 2, where it can be seen that (Figure 7 and Figure 9) there is a slight difference between surface temperature of two non-operating panels. This difference increases significantly (by up to 4 °C) when one panel is under load. This effect is also shown in numerical model (although with different temperature intensities, which can be attributed to the previously explained issues).
Since the heat input in numerical model is decreased by the amount of gained electricity, and there is no significant temperature difference between the two non-operating panels, one could say with high certainty that there is indeed a drop in temperature directly related to the electricity yield of the panel.
To accurately define the amount of drop in temperature, and also the amount of dissipated heat, one should need to conduct additional measurements and modelling, especially of thermal imaging, where angle of incidence plays an important role of temperature determination. Also, it would be most beneficial to confirm thermal imaging data with thermocouple measurements.
The importance of this data, as explained in introduction, lies in the fact that in modelling of PV/T and BIPV hybrid systems, one should take into account the fact that electricity yield is actually cooling the PV panel, which surely affects the hybrid systems when it comes to thermal efficiency. Also, this presents a parameter which should be taken into account when system’s working point is planned. Obviously, the panel’s temperature depends of the amount of electricity that it yields (in comparison to incident solar irradiance). Since the panel’s efficiency also depends of its temperature (from 0.25%/°C to 0.5%/°C), it is obvious that for some working regimes, a ratio between solar irradiance and yielded electrical energy should also be taken into account, and potentially adjust working point of the PV system.
The manuscript deals in an effect of lower operating temperature in loaded PV panels. This is an expected effect, since electrical yield represents the energy sink, and therefore heat loss for the panel. In order to prove the effect, an experiment was done for two cases. First case included modelling and imaging two similar PV panels in non-operating conditions. Second case used the same two similar PV panels. One panel was loaded with the resistor, while the other was not loaded. After measurement, both panels were recorded with thermal imaging. Experimental results are used on development of numerical model, which is an extension of previously developed numerical model.
Both numerical model and thermal imaging give the same difference in operating temperature of loaded and non-loaded panel. The temperature difference is between 3 °C and 4 °C. It can be expected that this temperature difference can vary, depending of solar irradiance, ambient air temperature and PV system load. The data is useful when determining the work regime of hybrid systems such as PV/T systems. Also, the data could prove useful with analysis of PV panel lifetime, when considering an influence of panel temperature on its operational lifetime.
This work has been published under the support of Include Ltd., Research and Development Department.
- Fraunhofer Institute for Solar Energy Systems, ISE with Support of PSE GmbHFreiburg, Germany, 2020, https://www.ise.fraunhofer.de/content/dam/ise/de/documents/publications/studies/Photovoltaics-Report.pdf, [Accessed: 05-December-2018]
- ,
Comprehensive Analysis and General Economic-Environmental Evaluation of Cooling Techniques for Photovoltaic Panels, Part I: Passive Cooling Techniques ,Energy Conversion and Management , Vol. 149 ,pp 334-354 , 2017, https://doi.org/https://doi.org/10.1016/j.enconman.2017.07.022 - ,
Photovoltaic Panels: A Review of the Cooling Techniques ,Transactions of Famena , Vol. 40SI-1 ,pp 63-74 , 2016 - ,
Estimation of Photovoltaic Module Yearly Temperature and Performance Based on Nominal Operation Cell Temperature Calculations ,Renewable Energy , Vol. 29 (12),pp 1997-2010 , 2004, https://doi.org/https://doi.org/10.1016/j.renene.2004.03.010 - ,
Experimental and Numerical Investigation of a Backside Convective Cooling Mechanism on Photovoltaic Panels ,Energy , Vol. 111 ,pp 211-225 , 2016, https://doi.org/https://doi.org/10.1016/j.energy.2016.05.103 - ,
Parameter Extraction for Dynamic PV Thermal Model Using Particle Swarm Optimisation ,Applied Thermal Engineering , Vol. 100 ,pp 508-517 , 2016, https://doi.org/https://doi.org/10.1016/j.applthermaleng.2016.01.164 - ,
A Numerical and Experimental Study on a Heat Pipe PV/T System ,Solar Energy , Vol. 85 (5),pp 911-921 , 2011, https://doi.org/https://doi.org/10.1016/j.solener.2011.02.006 - ,
Comparative Assessments of the Performances of PV/T and Conventional Solar Plants ,Journal of Cleaner Production , Vol. 219 ,pp 304-315 , 2019, https://doi.org/https://doi.org/10.1016/j.jclepro.2019.02.038 - ,
The Thermal and Electrical Yield of a PV-Thermal Collector ,Solar Energy , Vol. 72 (2),pp 113-128 , 2002, https://doi.org/https://doi.org/10.1016/S0038-092X(01)00094-9 - ,
Energy Balance Model of Combined Photovoltaic Solar-Thermal System Incorporating Phase Change Material ,Solar Energy , Vol. 85 (7),pp 1440-1446 , 2011, https://doi.org/https://doi.org/10.1016/j.solener.2011.03.027 - ,
Energy and Thermo-Fluid Dynamics Evaluations of Photovoltaic Panels Cooled by Water and Air ,Solar Energy , Vol. 105 ,pp 147-156 , 2014, https://doi.org/https://doi.org/10.1016/j.solener.2014.03.034 - ,
Improving Photovoltaics Efficiency by Water Cooling: Modelling and Experimental Approach ,Energy , Vol. 137 ,pp 798-810 , 2017, https://doi.org/https://doi.org/10.1016/j.energy.2017.04.164 - ,
Fin-Cooled Photovoltaic Module Modelling ‒ Performances Mapping and Electric Efficiency Assessment Under Real Operating Conditions ,Energy , Vol. 167 ,pp 159-167 , 2019, https://doi.org/https://doi.org/10.1016/j.energy.2018.11.001 - ,
Performance Analysis of Passive Cooling for Photovoltaic Modules and Estimation of Energy-Saving Potential ,Solar Energy , Vol. 181 ,pp 70-82 , 2019, https://doi.org/https://doi.org/10.1016/j.solener.2019.01.014 - ,
Enhancement of Photovoltaic System Performance via Passive Cooling: Theory Versus Experiment ,Renewable Energy , Vol. 140 ,pp 88-103 , 2019, https://doi.org/https://doi.org/10.1016/j.renene.2019.03.048 - ,
Performance Evaluation of a PV (Photovoltaic) Module by Back Surface Water Cooling for Hot Climatic Conditions ,Energy , Vol. 59 ,pp 445-453 , 2013, https://doi.org/https://doi.org/10.1016/j.energy.2013.07.050 - , Cooling System for Photovoltaic Module, Recent Researches in Environmental and Geological Sciences, 2012
- ,
Efficiency Improvement of Photovoltaic Panels by Using Air Cooled Heat Sinks ,Energy Procedia , Vol. 85 ,pp 425-432 , 2016, https://doi.org/https://doi.org/10.1016/j.egypro.2015.12.223 - ,
An Improved Thermal and Electrical Model for a Solar Photovoltaic Thermal (PV/T) Air Collector ,Applied Energy , Vol. 87 (7),pp 2328-2339 , 2010, https://doi.org/https://doi.org/10.1016/j.apenergy.2010.01.001 - ,
Dynamic Performances Modelling of a Photovoltaic-Thermal Collector with Water Heating in Buildings ,Energy and Buildings , Vol. 66 ,pp 485-494 , 2013, https://doi.org/https://doi.org/10.1016/j.enbuild.2013.07.067 - ,
Improving Thermal and Electrical Efficiency in Photovoltaic Thermal Systems for Sustainable Cooling System Integration ,Journal of Sustainable Development of Energy, Water and Environment System , Vol. 6 (2),pp 305-322 , 2018, https://doi.org/https://doi.org/10.13044/j.sdewes.d5.0187 - ,
Passive Cooling of Building-Integrated Photovoltaics in Desert Conditions: Experiment and Modeling ,Energy , Vol. 170 ,pp 131-138 , 2019, https://doi.org/https://doi.org/10.1016/j.energy.2018.12.153 - ,
Electronic Color Charts for Dielectric Films on Silicon ,Optics Express , Vol. 12 (7),pp 1464-1469 , 2004, https://doi.org/https://doi.org/10.1364/OPEX.12.001464 - ,
Further Progress in the Research of Fin-Based Passive Cooling Technique for the Free-Standing Silicon Photovoltaic Panel ,International Journal of Energy Research , Vol. 43 (8),pp 3475-3495 , 2019, https://doi.org/https://doi.org/10.1002/er.4489 - , , Basics of Thermography with Applications, 2008
- , , Advances in Solid State Photon Detectors, 2009