


Concentrated solar power (CSP) technologies' importance alongside other renewable energy technologies arises with the increasing threat of a future environmental catastrophe lead by global warming. Therefore, the developments and enhancements in terms of the technical feasibility, reliability, and profitability of renewables are most crucial to increase the investments in such technologies for sustainable development. Although renewable energy is one of the main pillars of the solution, several challenges emerged, such as the mismatch between the supply and load throughout the day, as well as the problem associated with the grid in terms of loading. Furthermore, the fluctuation and uncertainty of the supply increase the challenges. As a result, extensive research was made in this field, including energy storage and energy management through the hybridization of renewable sources with either fossil fuels or total renewable hybridization. CSP technologies were not an exception, hybridization of parabolic troughs, solar towers, linear Fresnel, and solar dishes were also discussed [1].
CSP systems are heavily dependent on the direct normal irradiance (DNI), which is the source of energy received from the sun by the collectors. This dependence limits technology due to weather fluctuations and daily operational hours during daylight. In most CSP systems, the collectors receive the irradiance and direct it to a focal point in which it absorbed by a heat transfer fluid (HTF) and thereby supplies the heat to a Rankine cycle across a heat exchanger. Thus, CSP plants are generally equipped with either thermal energy storage or equipped with gas fire heaters and, in some cases, with both. By this integration, smooth operation with a continuous supply of power is assured. Several studies suggested integrating natural gas (NG) turbine units as a support or a combined solar hybrid plant with different configurations to increase the overall plant efficiency. Configurations such as hybridizing a steam power plant with a CSP regenerative system [2], Integrated solar combined cycle that is composed from a two stage CSP solar troughs [3], retrofitting gas turbines (GTs) to an established CSP plant [4], and an Organic Rankine cycle that uses solar power from a parabolic trough as a heat source and liquefied NG as a cooling agent that is also connected to a GT for electricity production[5]. Despite using fossil fuels in CSP plants as a reliable and flexible source of energy, this significantly increases the carbon dioxide emissions and thus increasing the carbon footprint of the plant. However, using biofuels to subsidize the fossil fuels in such plants will maintain the reliability and renewability with significant cuts in CO2 emissions. San Miguel and Corona [6] investigated and compared the environmental performance as well as the life cycle assessment of a hybrid parabolic trough CSP plant that runs with an auxiliary heater and a hybrid mode fuelled by NG versus biofuels. The study concluded that substituting NG with biogas when operating in an axillary mode would save 6 to 10% of greenhouse emissions. The authors showed that when operating the plant in hybrid mode with 12% of NG, the substitution with biomethane has a significant reduction of the impact of climate change, fossil fuel depletion, and natural land transformation [6].
Biomass is the raw material of biofuels that can be acquired from different kinds of resources. Depending on the given raw material and its components, a specific chemical building block can be obtained and converted to a particular product. Therefore, biomass can be classified into four generations[7]:
First-generation: edible crops such as sugarcane, corn, wheat, rice, etc;
Second-generation: plant or animal residues such as manure, crop waste;
Third-generation: algae, e.g., Chlorella Vulgaris, Botryococcus braunii;
Fourth-generation: non-edible crops, e.g., jatropha, castor, Karanja, etc.
Despite the controversy that some biomasses bring in terms of its environmental collateral damage, biomass has the highest share of renewables in the European Union, accounting for nearly 60% [8]. This is due to the high reliability and compatibility compared with other renewables. A technological assessment and review were performed on hybrid power generation assessing different solar-biomass systems, including parabolic trough, solar tower, and linear Fresnel in [9]. Climate data and economic performance were also considered in this study. Results indicate that biomass and CSP hybridization power plants are a viable substitute to fossil-fuelled thermal power assist especially parabolic troughs [9].
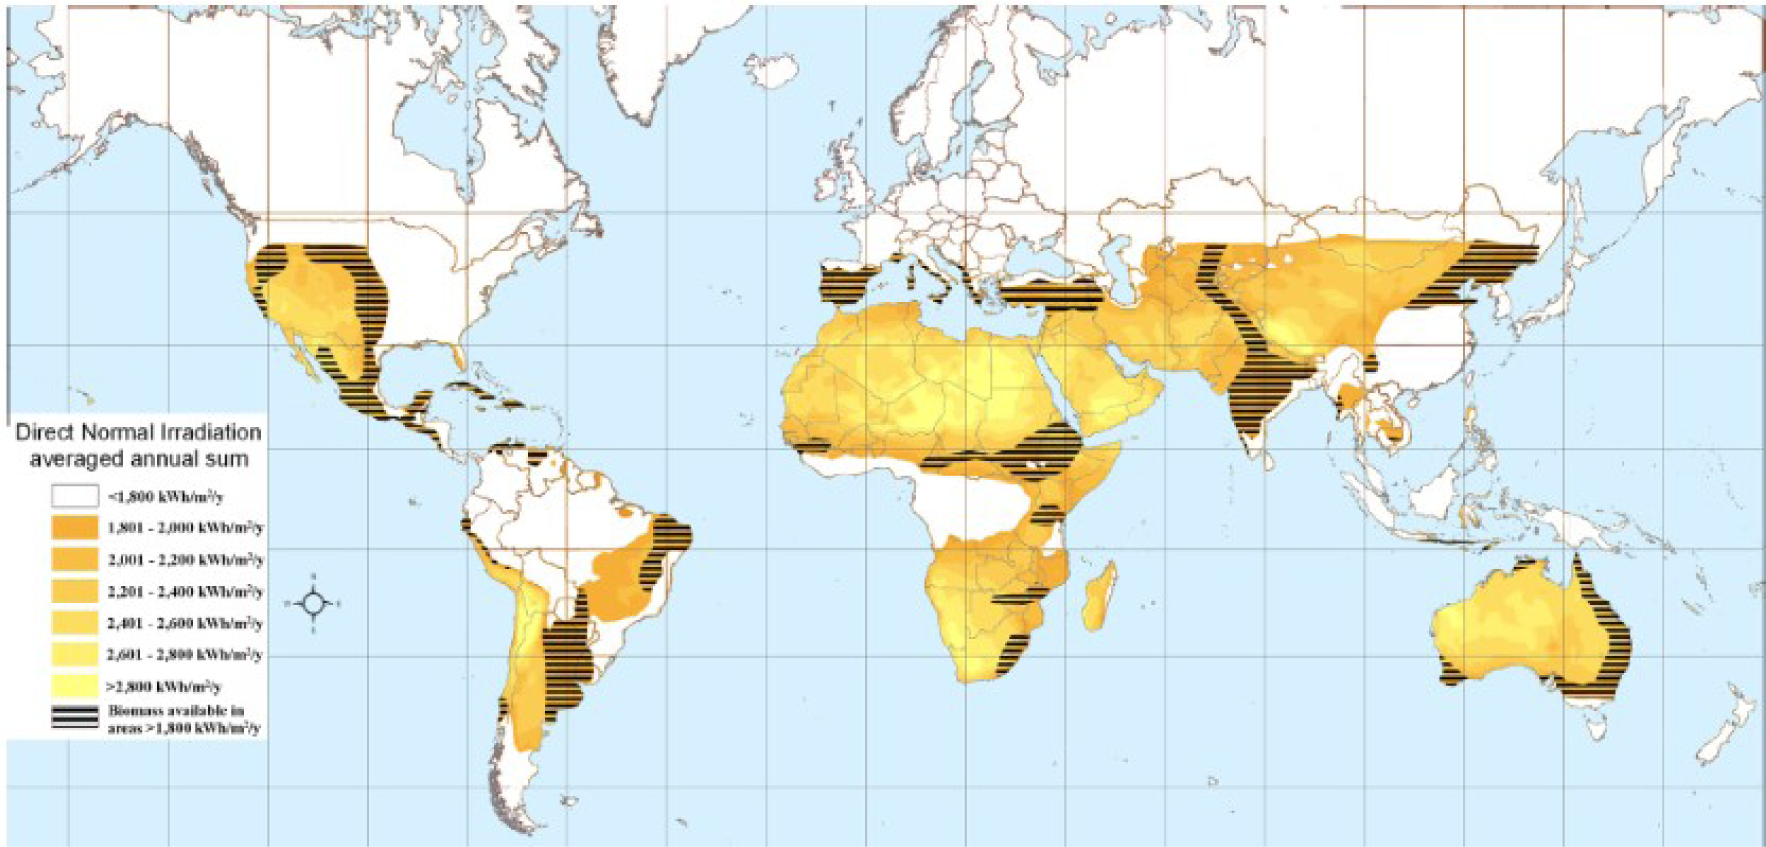
Figure 1 shows the possible potential for hybrid biomass and CSP plants around the globe. This advantage motivated many researchers to explore the feasibility of this technology in different case studies. Peterseim and his co-worker (2014) investigated the feasibility of increasing the overall efficiency of a conventional CSP plant by superheating the steam using external heating. An HTF loop was used to transfers heat from fire heaters that are fuelled by several fuels, including refuse-derived fuel and various types of forestry biomass [10]. Results showed a 10.5% increase in the net efficiency of the cycle and a reduction of $1.33 m/MWe of the specific investment [10]. The research team further investigated the feasibility of incorporating the same equipment on a Solar-tower CSP plant, and it showed a 43% decrease in the investment cost when compared to the stand-alone plant [11]. Another study proposed integrating a CSP unit into a biomass-based combined power plant with two configurations [12]. The first configuration used the parabolic troughs as a pre-heater to the working fluid by the HTF. In contrast, the latter took a fraction from the output of the condenser to the parabolic troughs and was sent directly to the expander. Results concluded that the Levelized cost of electricity (LCOE) for standard, first, and second proposed configurations was 79.34, 79.88 and 74.94 $/MWh respectively [12].
Potential regions for CSP-biomass hybrids plants worldwide [10]
A novel configuration of a combined cycle was also proposed in [13]. The study compared a stand-alone two-stage GT supplied by biofuel using gasified wood by combining a steam cycle and a solar tower field. The solar heat is integrated into the second stage of the GT, and the steam cycle acts as a bottoming cycle for the system. Adding the solar field integration enhanced power production by 25% and decreased CO2 emissions by 31% while integrating the steam bottoming cycle increased the overall power production by 51% with a 49% decrease in CO2 [13]. Moreover, a novel hybrid power plant consisting of a solar-tower and a NG turbine integrated with two supercritical CO2 bottoming cycles were proposed for power generation [14]. Furthermore, a study proposed a two-stage gasification process using parabolic troughs for pyrolysis in the first stage from corn straw to produce tar and char. The second stage uses a beam-down concentrated solar energy for tar cracking and char gasification to produce syngas to fuel a combined cycle [15]. Also, several studies discussed the performance of trigeneration and polygeneration of power, biomass processing, and heating/cooling applications. For instance, a study proposed a trigeneration system composing power generation, biomass gasification, and domestic heating/cooling [16]. A similar study also proposed a trigeneration system of power generation of 90 MWe, chilled water, and industrial process heat that is generated from a hybrid power cycle of a GT integrated with a CSP steam cycle [17]. Another study proposed a system to produce power, biomass gasification, and hydrogen production [18]. Similarly, a polygeneration system was also proposed by utilizing several CSP technologies to generate power and methanol [19]. The study was then further explored technically and economically in [20].
The present study aimed to study the feasibility of replacing the NG fire heaters that are used on Shams 1 CSP located in Abu Dhabi with different types of biofuels operated gas turbines (BFGT). The gas turbine exhaust gases will be used for superheating the CSP produced dry steam in one scenario, and it will be used to heat the HTF in the absence of the solar radiation in another scenario. The main objective is to develop a techno-economic model that will combine gas and steam thermodynamics analysis with the economic analysis of the combined plant. A comparison between the current plant design and the proposed integration design will be investigated for the proposal feasibility. Detailed description is given in the following section.
The theoretical foundations of this study are based on thermodynamics analysis including fuel energy conversion as well as economic feasibility study. Therefore, a thermodynamics model is developed on IPSEproTM software to calculate the plant power output and the overall thermal efficiency for three proposed CSP/BFGT modules with different biofuels. Economic analysis using cash flow based pm the net present value (NPV) and the internal rate of return (IRR) and Levelized Cost of Water (LCOW) will be implemented for feasibility of the proposed modules. Sensitivity analysis using minimum attractive rate of return (MARR) and Monte Carlo analysis are adapted to investigate the most sensitive variable among the considered variables. The following subsections will describe these methods as well as the data used for the analysis and the following results.
The thermodynamic modelling of the plant is based on evaluating the parameters and configuration of shams1 as a case study shown in Table 1 using a thermodynamic modelling interface (IPSEpro). The HTF used in Shams 1 is DowthermA [26], which is a widely used HTF in the industry. DowthermA is composed of Biphenyl (C12H10) and Diphenyl Oxide (C12H10O) where their thermal properties are obtained from the datasheet provided by the oil manufacturer [27]. The gas turbine unit in each case was modelled to meet the minimum load required for heating the steam/HTF. The assumptions made in the thermodynamic model are the following:
Gas and steam cycles friction, pressure drop, kinetic energy, and potential energy are neglected;
SSSF process analysis for all components;
Adiabatic power and pipeline components; therefore, no heat losses were considered;
Working fluid is saturated liquid at the exit of the condenser.
The following are the thermodynamics equations that have been used in the analysis where the thermal efficiency of the cycle is given by:
(1)
Conditions of the plant's steam cycle
| Parameter | Unit |
|---|---|
| CSP plant capacity (MW) | 100 |
| Maximum Steam Pressure (bar) | 150 |
| Condenser Pressure (mbar) | 150 |
| Steam turbine outlet steam quality (-) | 0.95 |
| Steam mass flow rate (kg/s) | 125 |
| HTF oil mass flow rate (kg/s) | 1173 |
| Maximum HTF temperature (°C) | 393 |
| Steam outlet temperature (°C) | 360 |
| Booster heater outlet temperature (°C) | 540 |
| Condenser outlet air temperature (°C) | 50 |
| Ambient temperature (°C) | 35 |
The hot gases heat rejection, , equals the steam heat reception, , in the heat exchangers:
(2)
The total output power is the sum of the work generated by the steam and gas turbine cycles:
(3)
The generated heat rate by the combustion can be expressed as:
(4)
Pump input power, for water and HTF fluids, is given by:
(5)
The mass balance of the RO plant:
(6)
Salt balance equation is given by:
(8)
The salt rejection equation is expressed by:
(9)
The power consumption of the distillation process is calculated based on the feed (f) and permeate (p) pumping power and the pump's efficiency:
(10)
The parameters used in the economic assessment were extracted from two sources, technical data from IPSEpro software and lifecycle costing from recent market studies, fuel cost, and electricity tariff. The gas turbine capital and operations and maintenance (O&M) costs data are based on the Energy Sector Management Assistance Program data shown in Table 2 and Table 3, respectively [28]. In addition, the heat exchanger cost estimation included approximations using a contingency factor. In regards to the RO plant, the costing was based on historical, tracked, and anticipated project data using the cost EPC forecast tool DESALDATA to estimate both the capital (CAPEX) and operation (OPEX) expenditures [29]. As for the biofuel prices, the Jatropha, Castor, and palm oils were taken from previous studies in [27][29]. The water and electricity tariff used in the economic analysis was the base rate of Abu Dhabi residences [33].
The economic analysis performed considers the best performing fuel as well as the lowest price among biofuels studied. Each alternative will be considered as mutually exclusive. Therefore, the study will include the economic effect of replacing the booster heater (alternative 1) and the HTF heater (alternative 2) independently with a biofuel-based gas turbine unit taking into account the RO plant integration. Another alternative is to include both cases in a single alternative to supply a RO plant and investigate if the LCOW will be reduced (alternative 3). These alternatives will be compared with the current plant design, which in this case, will be running the heaters with biofuels.
In this section, the analysis will cover three aspects:
Cashflow analysis based on the Net Present Value (NPV) and the Internal Rate of Return (IRR) as well as incremental IRR;
Levelized Cost of Water (LCOW);
Sensitivity analysis for the best alternative scenario by investigating the variation of the Minimum Attractive Rate of Return (MARR), fuel price, capital cost, operational costs, and water tariff;
Monte Carlo analysis to the most sensitive variables using the triangular method.
The analysis used a MARR of 10% as a baseline for this study. Furthermore, the following are the mathematical expressions for the present value worth and the LCOW:
(11)
(12)
Capital cost breakdown of the gas turbine integration depending on capacity
| Capacity | 5 MW | 25 MW |
|---|---|---|
| Cost Estimate Summary | U.S. (Thousands $) | |
| Civil | 400 | 1,260 |
| Gas Turbine | 2,920 | 9,770 |
| SCR | 300 | 970 |
| Gas Compressor | 640 | 1,000 |
| Electrical | 550 | 1,790 |
| Piping | 140 | 470 |
| Instruments and Controls | 90 | 240 |
| Balance of Plant/General Facilities | 340 | 890 |
| Total Direct Costs | 5,380 | 16,390 |
| Indirect Costs | 280 | 750 |
| Engineering and Home Office Costs | 630 | 1,680 |
| Process Contingency | 0 | 0 |
| Project Contingency | 940 | 2,820 |
| Total Plant Cost | 7,230 | 21,640 |
| Total Plant Cost per kW | 1,446 | 865.6 |
| Estimated Integrating Heat exchanger cost & installation | 357 | 446 |
| Total GT plant cost | $11,694,966 | $19,559,963 |
operational and variable costs of the gas turbine integration
| Gas CT First Year Annual O&M Expenses U.S. (Thousands $) | ||
|---|---|---|
| Facility Staff Labor Costs | 1330 | variable overhead |
| Consumables | 160 | variable overhead |
| Office Administration | 160 | fixed overhead |
| Maintenance & Minor Repairs | 510 | variable overhead |
| Corporate & Administrative Charges | 410 | Fixed cost |
| Total | 2570 | |
| Variable O&M and LTSA Costs | 0.91 | $/MWh |
Shams 1 is a 100 MW CSP plant located in Abu Dhabi, UAE. It is equipped with several NG-based fire heaters that serve as booster heaters for the steam cycle and as a heater for the HTF in the absence of solar energy. The design of this concept was employed before the commercialization of the TES. However, later on, the team studied the possibility of retrofitting a TES to the plant [21]. Furthermore, the feasibility of retrofitting GT units to substitute the fire heaters was studied [4]. In addition, running GTs on biofuels has been investigated in several studies and showed promising results; Sequera et al. [22] studied the emissions of using biofuels through a swirl-stabilized burner mimicking the combustion of a GT. Later on, Habib et al. [23] investigated the performance and emission characteristics of a number of biofuels in a small-scale GT engine. Similarly, Rehman et al. [24] studied the technical feasibility of running a GT on a jatropha oil based-biodiesel. Christopoulou and hassan [25] also examined several biofuels on a single shaft GT.
The study aims to increase the plant's efficiency and renewability by investigating the feasibility of retrofitting a biofuel operated GT with the CSP plant examining three types of biofuels, namely; Jatropha oil, Castor oil, and palm oil. The first two fuels are considered fourth-generation biofuels, while the third biofuel is an attractive option due to its availability in the region of the Shams 1 plant. The three biofuels are assessed in terms of their energy performance.
Figure 2 shows the current layout of Shams1. Solar collectors and the Gas-fire heaters heat the HTF to 393 °C depending on the operational time and the conditions before it supplies the steam cycle through the heat exchanger producing superheated steam. The steam is then further superheated to 540 °C by the booster heater before it enters the steam turbine. After expansion, the exhausted steam is condensed in an air-cooled condenser at 150 mbar. Direct fire heaters and booster heaters are fuelled by natural gas. The high-temperature flame due to natural gas combustion reaches around 1700 ?C, which might lead to chemical degradation of the HTF oil. Also, the oil flammability can put the heater in explosion risk. The replacement of the HTF fire heaters with biomass-based GT would serve as a topping cycle and will enable to utilize the flue gas with lower temperature compared to the direct flame and to match the heat required for the HTF. In contrast, the direct fire in the booster heater also degrades the superheater tubes. Similarly, avoiding direct heat by incorporating a GT unit will decrease the risk of the pipe burn. However, the required flue gas temperature for superheating the steam must be higher than 540 °C.
Shams1 schematic [4]
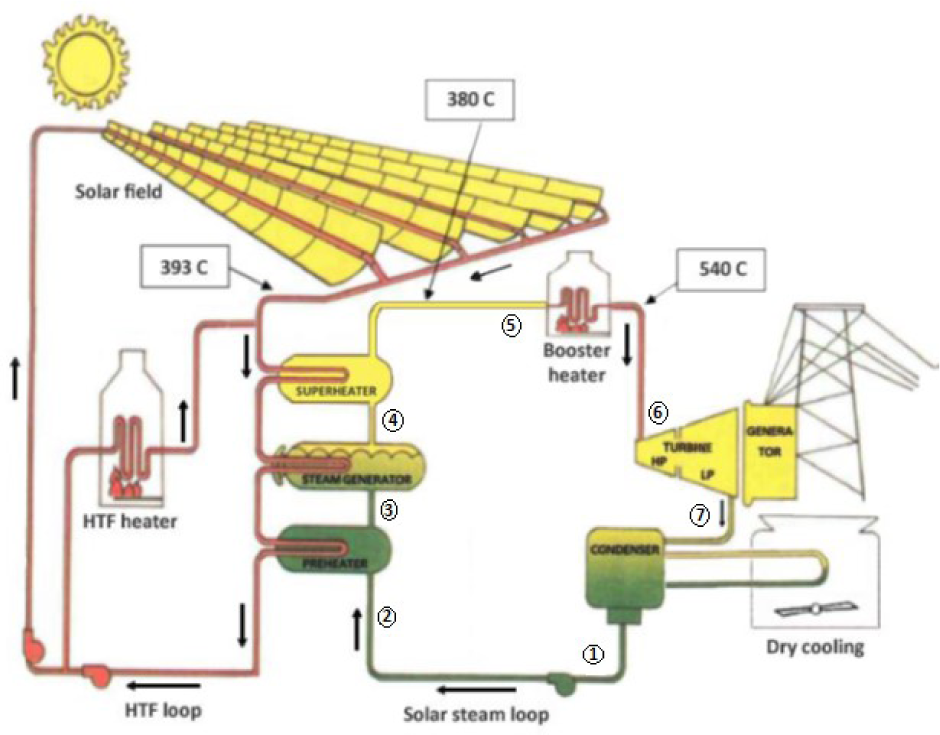
Figure 3a shows the schematic of replacing the direct-fire booster heaters with a gas turbine unit. The exhaust gases from the turbine outlet enter a heat exchanger to supply heat to superheat the saturated steam. Figure 3b shows the schematic of replacing the HTF heater with gas a turbine unit. In this case, the flue gases will be collected from the gas turbines and will run through a heat exchanger to heat the HTF. The power generated through the gas turbines is then used to desalinate seawater using a reverse osmosis (RO) plant equipped with an energy recovery unit that allows recovering pressure from the brine by positive-displacement, as shown in Figure 3c.
Schematic of proposed systems: replacement of booster heater with GT (a); replacement of HTF heater (b); RO plant equipped with an energy recovery system (c)
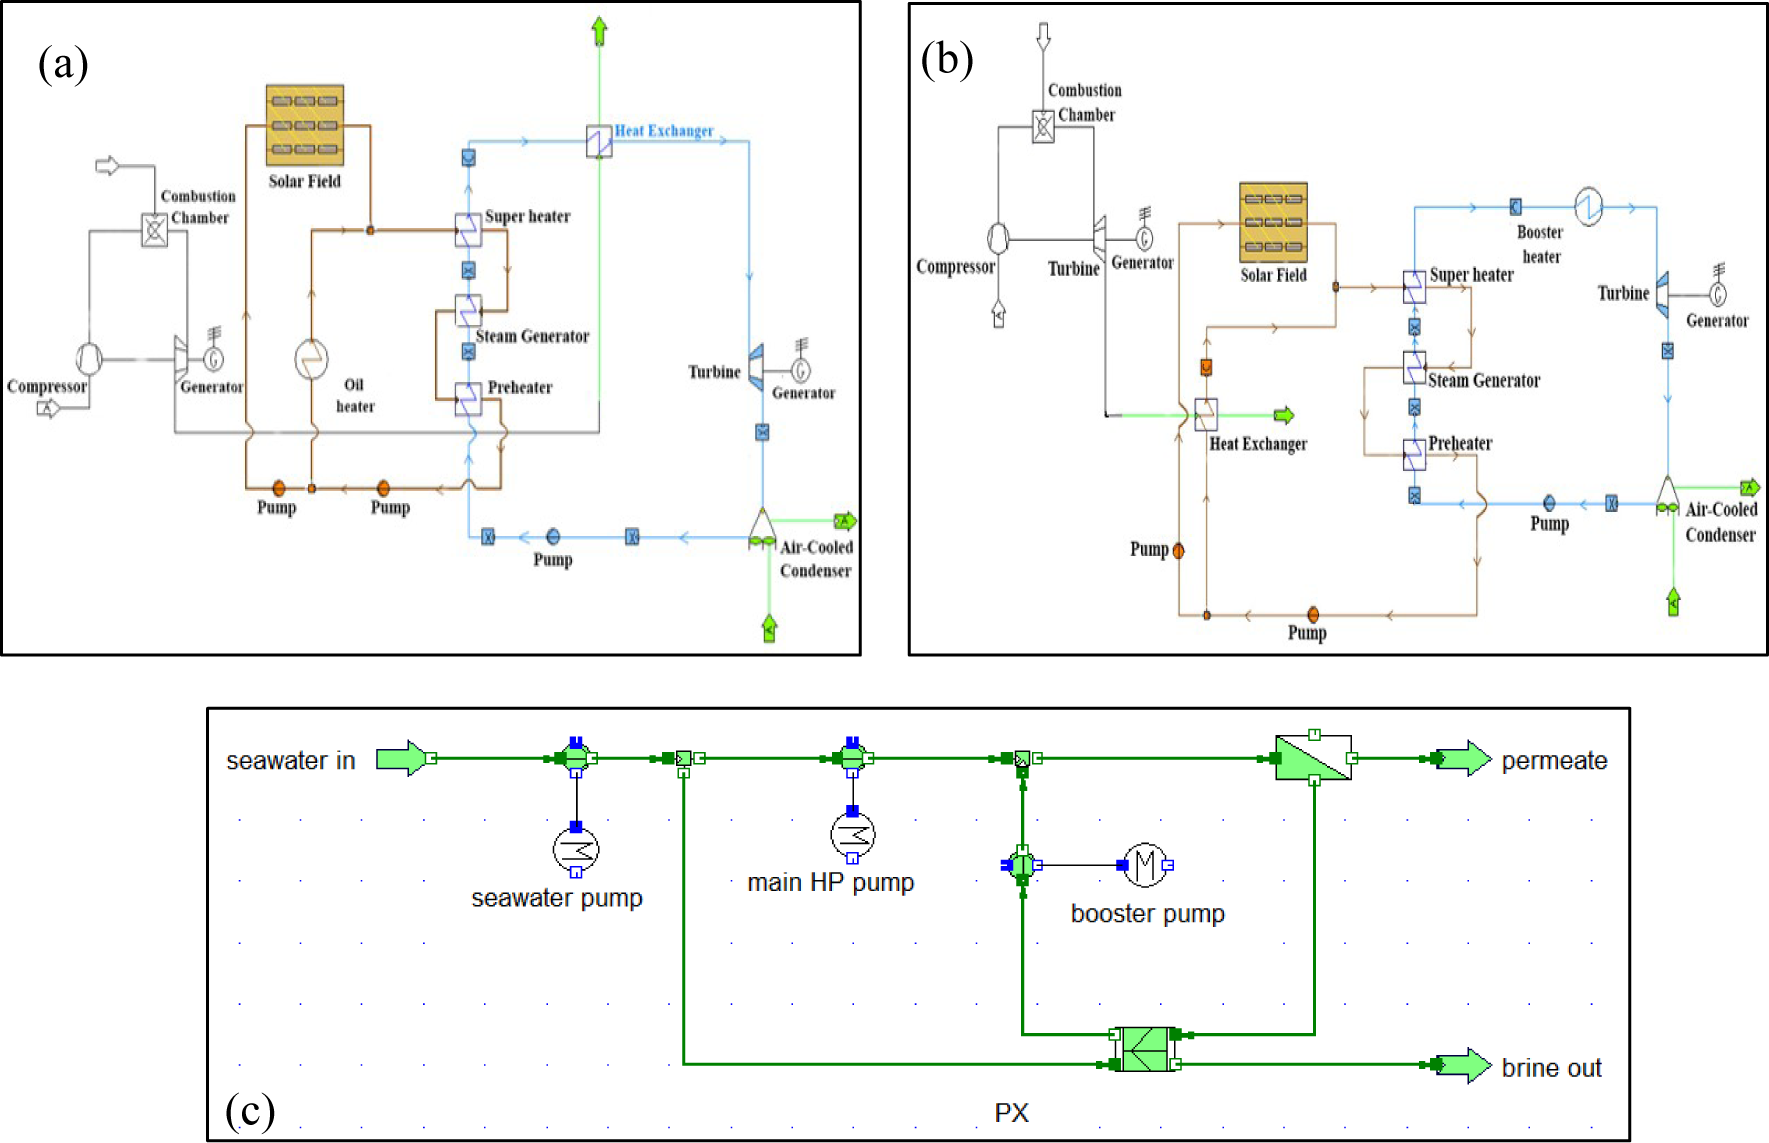
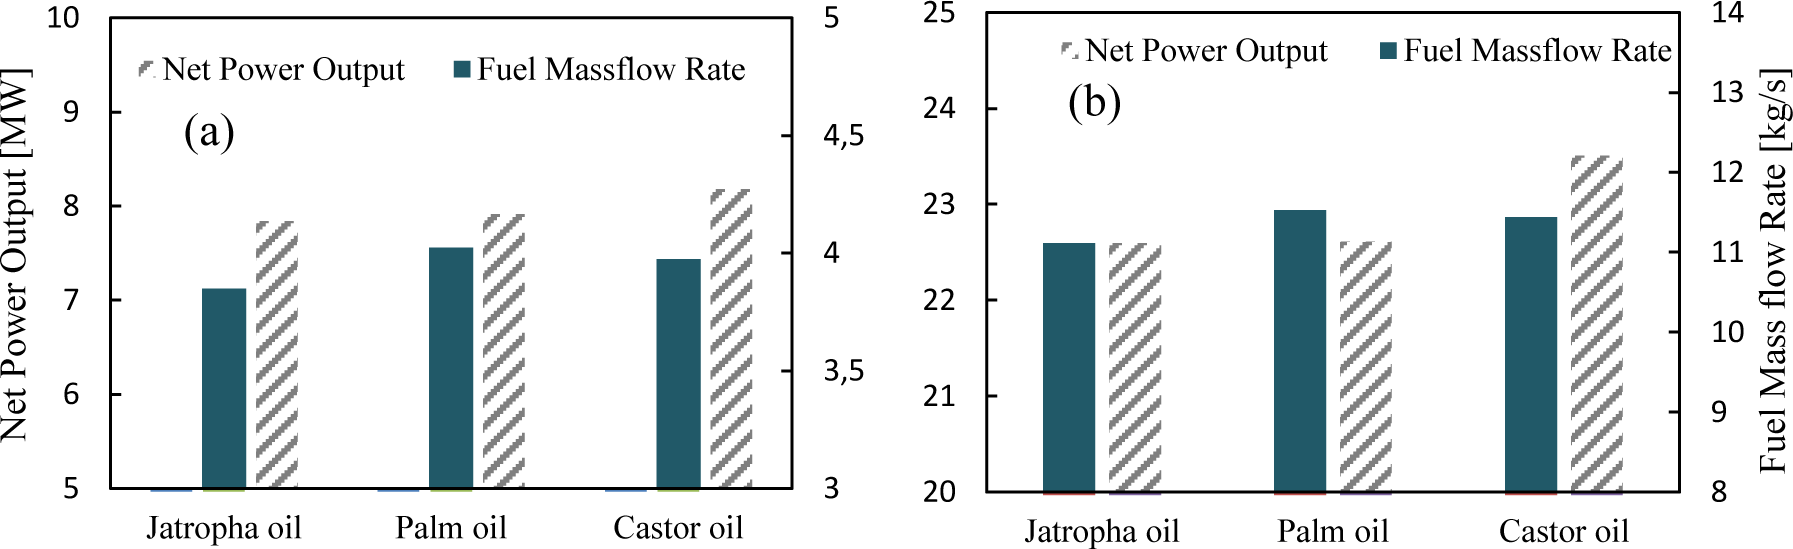
Figure 4 shows the results of the net power output for alternatives 2&3 with a minimum required biofuel mass flow rate to deliver the plant's nominal loads. The net power output for the booster gas turbine ranged between 7.8 and 8.2 MW, as shown in Figure 4a, whereas the net power output for the HTF gas turbine ranged between 22.6 and 23.5 MW, as shown in Figure 4b depending on the type of biofuel used. It can be seen that the difference in the biofuels performance in terms of the input mass flow and the net power output is rather insignificant. However, palm oil showed the highest mass flow rate despite the similar net power output, which depicts the least performance among the fuels. On the other hand, castor oil had the highest net power output among the biofuels.
Net power output and fuel mass flow rate of additional gas turbine unit using three biofuels for: (a) booster heater replacement; (b) HTF heater replacement
The power output from the gas turbines is used to simulate the water production using RO desalination plant on the same platform. Table 4 below shows the results of the simulation carried out to quantify the distillate water and CO2 emissions associated with the fuel combustion. The table displays both these variables by comparing them based on the fuel type as well as the base case (via the original fire-heaters). The water production that can be extracted through the power of the gas turbine equipped in the HTF loop is nearly double as much as the production of the booster loop. As a result of the minor difference between the fuel types in terms of power production, it can be noticed that it also has an insignificant difference in water production. However, Castor oil had a slightly higher water production in the HTF loop compared with the other two fuels with about 120k m3/day and, at the same time, lower CO2 emissions per kWh of power. Although Castor oil has better performance for this application, there is a significant disadvantage in terms of its price compared with the other fuels. However, the impact of the fuel price is further discussed in the next section of the economic analysis.
Summary results and comparison between the base case and retrofitting the new system in terms of water production and CO2 emissions for the three biofuels
| Water production GT-booster [m3/day] | Water production GT-HTF [m3/day] | CO2 emission booster heating [kgCO2/kWh] | CO2 emission HTF loop [kgCO2/kWh] | Fuel Price [$/liter] | ||
|---|---|---|---|---|---|---|
| Jatropha oil | without GT | - | - | 0.19 | 0.65 | 0.39 [7] |
| with GT | 58,752 | 112,680 | 0.35 | 0.89 | ||
| Palm oil | without GT | - | - | 0.21 | 0.69 | 0.57 [8] |
| with GT | 59,297 | 113,290 | 0.37 | 0.93 | ||
| Castor oil | without GT | - | - | 0.19 | 0.64 | 0.92 [9] |
| with GT | 61,376 | 119,682 | 0.34 | 0.86 |
After comparing the fuel types performance and prices, Jatropha oil seems the most attractive fuel option in terms of its price and its relative performance competitiveness. Therefore, jatropha oil is considered in the following analysis.
Table 5 shows the specifications of the three alternatives using jatropha oil. The minimum power capacity of the GT's to match the load of the heaters in the table below shows values closer to the cost presented in Table 2. Thus, the capital costs of the GT unit were approximated to be the same. The cost of the heat exchangers between the flue gases and the working fluids were also added to the total expenditure. The capital costs of the GTs are minor compared with the cost estimation of the RO plant using the CAPEX & OPEX method. The capital cost for utilizing the power produced by the booster GT, the oil heat GT, and considering both combined gives a capital cost of around 87M, 145M, and 205M, respectively.
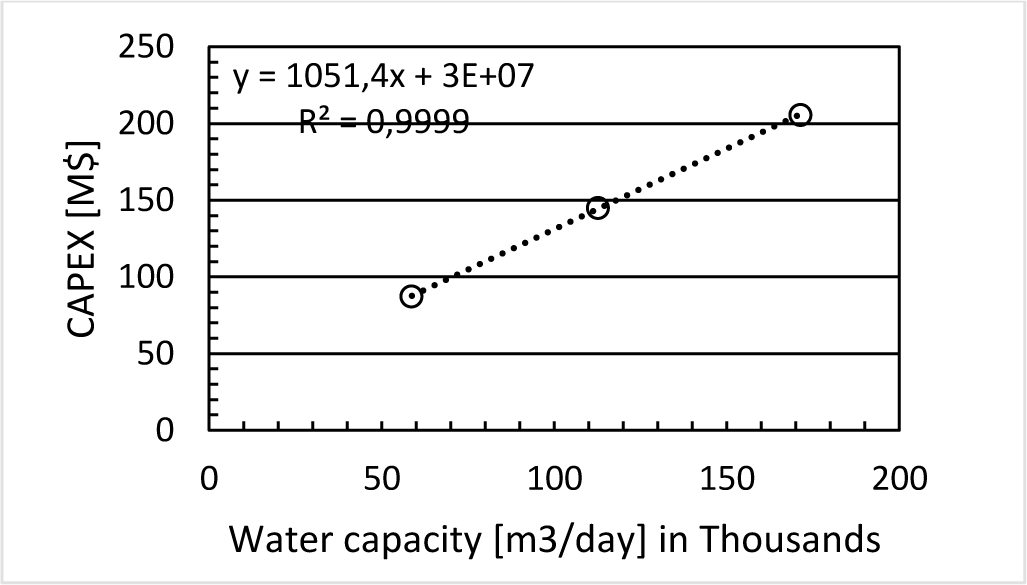
Figure 5 clearly shows the linear relation between the capacity of the RO and the capital cost in the range of design points. In regards to the LCOW of the three alternatives compared to the water tariff in Abu Dhabi ($2.136 per cubic meter) [33], all the prices were lower, especially alternatives 2 & 3. At the same time, the booster GT was relatively higher. However, this factor alone is not an indication of the feasibility of an alternative; thus, the cash flow analysis is essential.
Cost and specifications of the three alternatives
| Alt. 1 | Alt. 2 | Alt 3 | |
| GT Capacity [MW] | 7.8 | 22.6 | 30.4 |
| Operation [hrs/ year] | 8640 | 5840 | |
| Estimated heat exchanger total cost [$] | 297,400 | 446,100 | 743,500 |
| GT total plant cost [$] [28] | 11,280,000 | 19,563,000 | 31,254,929 |
| Estimated Life [years] | 15 | ||
| Alt. 1 | Alt. 2 | Alt 3 | |
| GT Operation. Admin, Maintenance, etc [$]/year | 2,631,000 | 2,748,000 | 5,325,529 |
| RO capital cost [M$] | 87 | 145 | 205 |
| RO operation cost [$] | 5,059,076 | 8,225,757 | 11,348,061 |
| LCOW [$/m3] | 0.8 | 0.71 | 0.75 |
RO capital cost in USD vs. water capacity
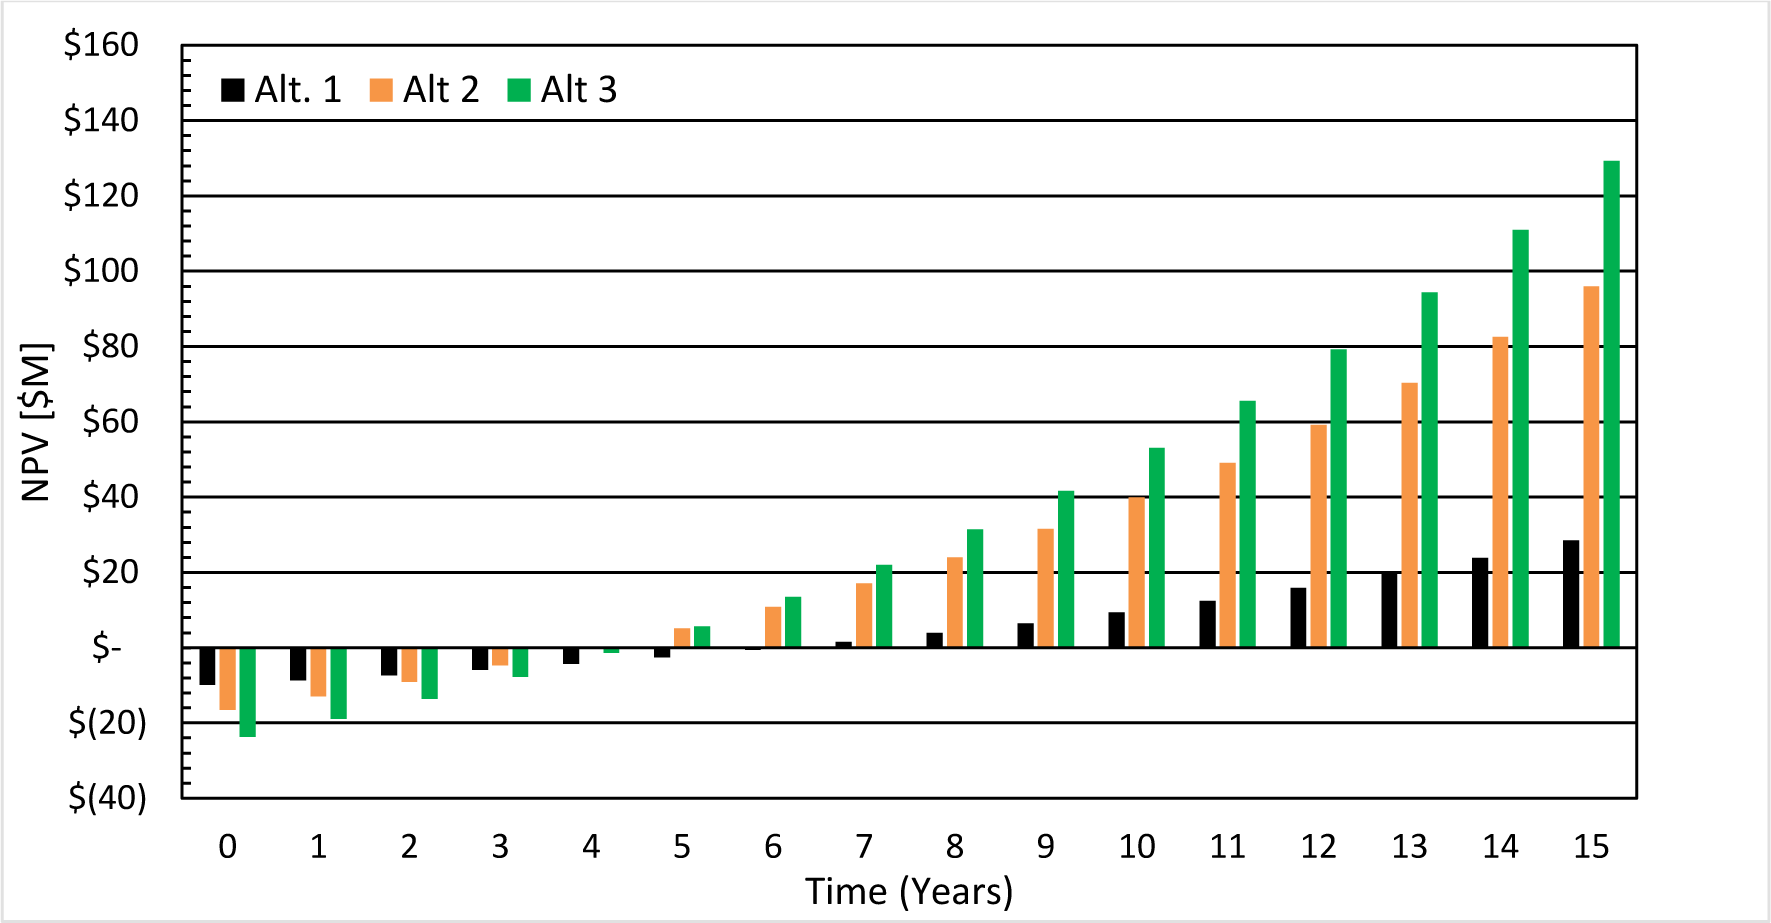
The cashflow diagram of the three alternatives is presented in Figure 6. All alternative showed positive NPVs by the end of the plants lifecycle. Alternative 1 has a payback peroid of 7 years with a total NPV of $68M. In contrast, both alternatives 2 & 3 showed relatively higher values of NPV while both having a payback period of 5 years which is considered feasible especially with the high-income rate. Similarly, all three alternatives in ascending order had higher IRR compared to the base of the MARR with values of 21%, 31%, and 30% respectively. In such cases, a mandatory Incremental IRR analysis is required due to the fact that all IRR values were higher than MARR and choosing the highest IRR sometimes give misleading decision. The results of using the incremental IRR shows that alternative 3 is the most profitable alternative. Furthermore, a sensitivity analysis is also required to assess the best alternative, which in this case, is alternative 3. This is done by analysing the impact and sensitivity of the most significant variables that would affect the precision of the overall costing.
Cash flow diagram for: (a) Alternative 1; (b) Alternative 2; (c) Alternative 3
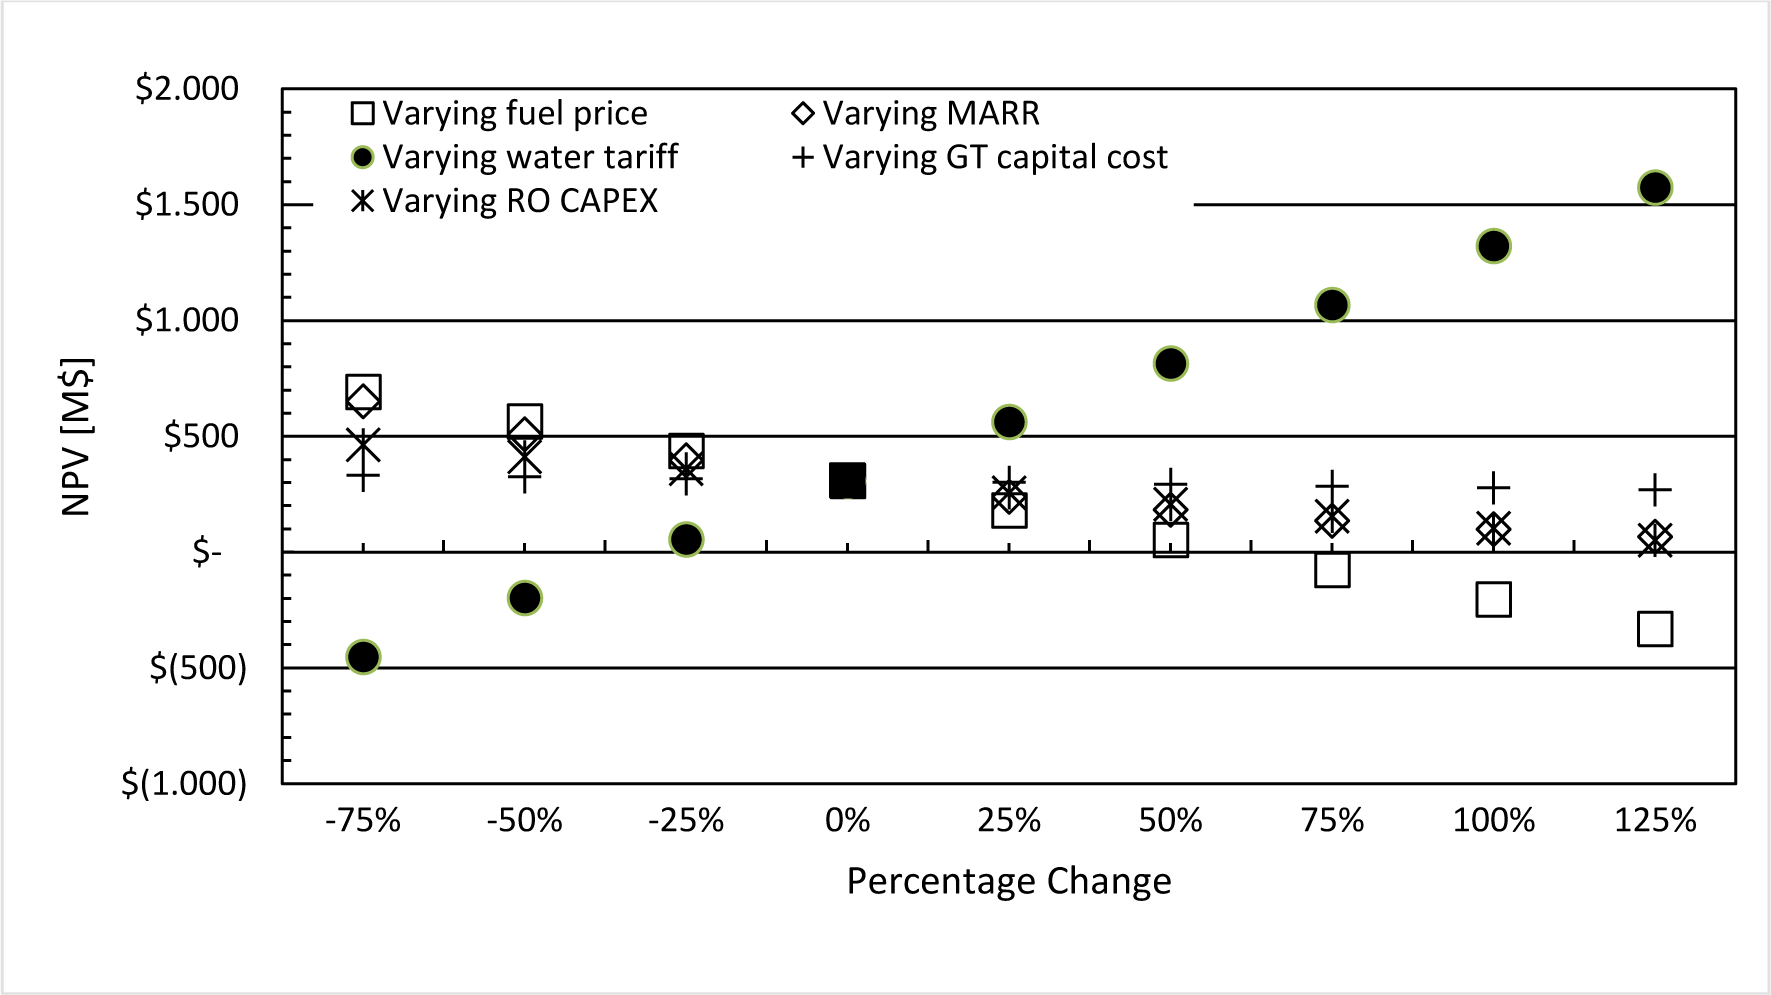
The sensitivity analysis was performed to assess variables that might alter the results significantly, which include MARR, CAPEX, fuel price, and water tariff. These variables were varied accordingly from -75% to 125% with an increment of 25%. The results of the variation are shown in Figure 7, where it can be noticed that water tariff was the most significant variable since it determines the revenue of the project. As the water tariff increases, the NPV increases significantly. In contrast, the fuel cost was the second most sensitive variable as any increase in the fuel price by approximately 60% would result in a negative NPV. The sensitivity of the CAPEX of the RO and MARR had similar sensitivity profiles where an increase of either variable by 130% will result in a zero NPV. On the contrary, varying the capital cost of the GT showed no significance on the NPV compared to the other factors where it can be noticed from its horizontal slope as well as its positive NPV throughout the profile.
Sensitivity analysis for alternative 2
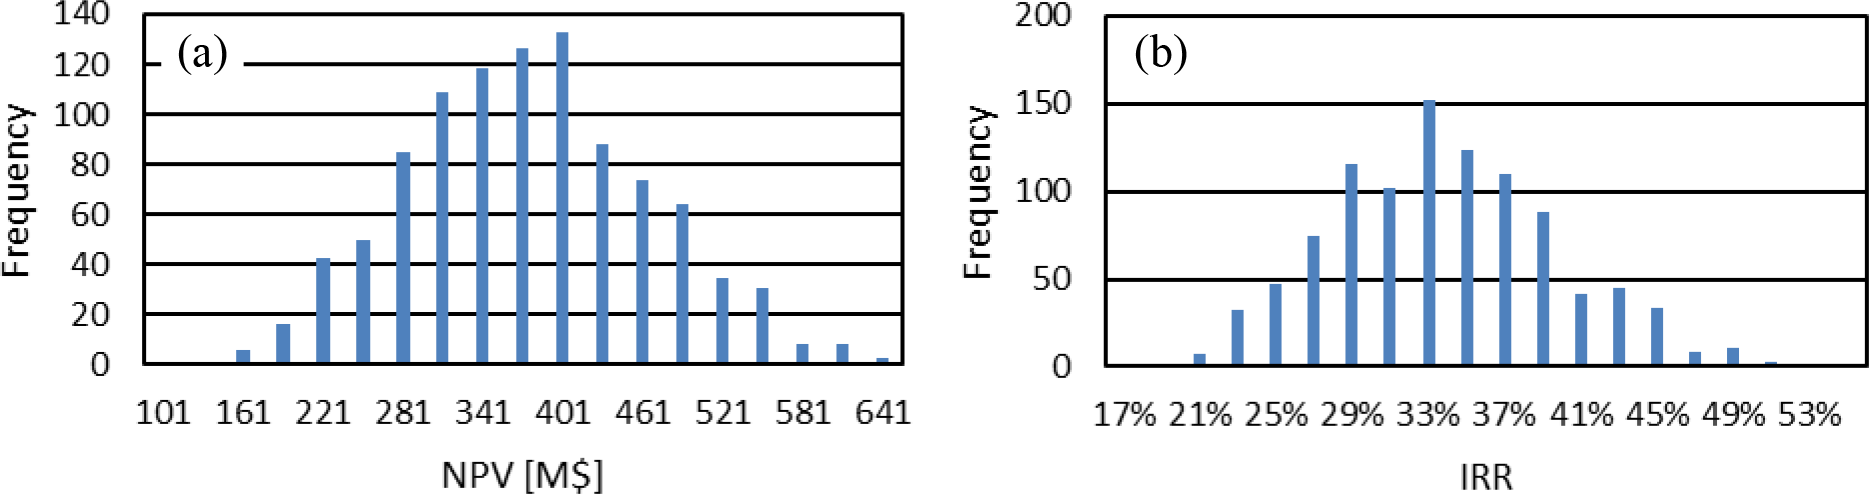
The significant factors discussed in the previous section are further studied using the Monte Carlo simulation. This simulation comprises combining random variations of the variables within a specific range shown in Table 6, generating 1000 combinations of NPVs and IRRs. The values of the ranges specified below are discussed further in the discussion section. The Monte Carlo simulation results are illustrated in a histogram shown in Figure 8 for both the NPV & IRR. The reliability of the simulation was ensured minimal with stability of 98%. Therefore, it can be observed in Figure 8a, that all of the values calculated for the NPV remained positive. Moreover, most of the NPVs calculated were larger than the NPV estimated by the cashflow analysis; thus, it is most likely that the project might have a shorter payback period. On the other hand, 75% of the IRR values were higher than the value obtained in the estimated cash flow analysis.
Variables to be considered in the Monte Carlo simulations
| Variable | Low% | Hi% |
|---|---|---|
| fuel price variation | -30% | 30% |
| Water Tariff variation | -10% | 20% |
| RO capital cost variation | -20% | 20% |
Monte Carlo simulation histogram for: (a) NPV frequency; (b) IRR frequency
The purpose of this work was to assess the feasibility of replacing the gas-fire heaters with a cogeneration system of power and water production in shams 1 CSP plant as a case study. The proposed study will have a solution for current technical issues regarding the direct fire-heating of both the steam & HTF as mentioned in detail in the system description. Unlike the previous study in [4], the suggested design was meant to install the unit with a minimum load required for heating the fluids while increasing the renewability of the system. This suggestion was carried out by studying three biofuels on two alternatives: (1) integrating the cogeneration unit in replacement of the booster heater and (2) integrating the cogeneration unit in replacement of the HTF heater. After identifying the most suited biofuel, an economic analysis was conducted to the mentioned alternatives with the addition of alternative (3), which was a combination of the two GT integrations stated above to facilitate a single RO plant. The economic analysis included a cash flow analysis, a sensitivity analysis, and a Monte Carlo simulation to derive various iterations.
Castor oil showed slightly better performance over jatropha and palm oils. However, castor oil cannot be adopted due to its relatively high-cost since fuel prices showed high sensitivity to the feasibility of the project. Alternative (1) proved to be the least feasible due to the low output compared to the high total capital cost ($1480/m3/day). On the other hand, the expenditure per unit cost for replacing the HTF was ($1287/m3/day) due to the higher capacity where water generation was larger than alternative 1 due to the high load required to heat the HTF loop. As for alternative 3, increasing the capacity of the plant would result in an enhanced NPV although having a similar IRR of alternative 2. Hence, alternative 3 can be considered to be a more viable option. It is important to note that the LCOW in the three alternatives were lower than the water tariff of Abu Dhabi given in Table 5; nevertheless, the high capital costs of these alternatives give it a disadvantage in terms of investment.
Thus, considering alternative 3, Monte Carlo simulation was conducted by changing the significant cost variables mentioned in Table 6.
In general, the fuel price is governed by the extraction technology available, as well as other factors such as transportation. The cost of transportation has not been considered in the cash flow analysis, but it has been accommodated in the simulation by increasing fuel cost percentage by 30%. On the other hand, biofuel prices are affected by other factors such as fossil fuel prices, policies, and feedstock availability. Even though the biofuels price is expected to decrease in the next decade [34], the water tariff, as the source of income for the project, may remain the same. However, the variation put forward in this study is for anticipating the future change in the tariff, noting that it is more likely to increase.
Furthermore, the RO capital cost was subjected to variations (were set to ±20%) in case of costs overrun or underrun. Given the inputs of the UAE as a case study, the project did show promising results with the current situation. Furthermore, in some developing countries, the infrastructure in some rural regions cannot facilitate water collection; however, such regions are abundant in feedstocks and biomass. Therefore, such technologies might have significant enhancements in the infrastructure depending on the location, country, conditions, and inputs, it will have a different impact on the feasibility of the project.
This study was conducted to assess the feasibility of replacing the gas-fire heaters in CSP plants with a biofuel cogeneration system of power and water production to increase the plant's overall performance and renewability. The main findings of this paper are summarized as follows: Firstly, Jatropha oil was found to be suitable for this application due to its relatively low price. Although castor oil had a better performance that can generate a maximum water production of 181 thousand m3/day Secondly, replacing the booster heater with the cogeneration integration proved to be feasible with a 7-year payback period, whereas replacing the HTF heater had a shorter period of 5 years. Lastly, the feasibility of the project is subjectively determined by several factors in which they vary by country and location. This work can be extended to analysing various biofuels such as algae and other non-edible biomass. Also, conducting similar studies on developing countries such as Brazil and India since they face water shortages and have abundance in biomass. Finally, a further investigation to assess the potential of other applications such as biomass gasification can be conducted.
| CFt | future value | [$] |
| CV | calorific value | [kJ/kg] |
| cp | heat capacity | [kJ/kg] |
| h | specific enthalpy | [kJ/kg] |
| mass flow rate | [kg/s] | |
| p | pressure | [kPa] |
| heat rate | [kW] | |
| r | interest rate | [%] |
| S | concentration (salinity) | [kg/m3] |
| T | temperature | [oC] |
| t | no of years | [-] |
| volumetric flow rate | [m3/s] | |
| v | specific volume | [m3/kg] |
| work rate (power) | [kW] | |
| Grek leters | ||
| ∆p | pressure drop | [kPa] |
| ζ | pump's overall efficiency | [%] |
| ƞ | thermal efficiency | [%] |
| Subscripts and superscripts | |
| b | brine |
| f | feed |
| p | permeate |
| Abbreviations | |
| CAPEX | Capital Expenditure |
| CSI | Concentrated Solar Power |
| DNI | Direct Normal Irradiance |
| GT | Gas Turbine |
| HTF | Heat Transfer Fluid |
| IRR | Internal Rate of Return |
| LCOE | Levelized Cost of Electricity |
| LCOW | Levelized Cost of Water |
| MARR | Minimum Attractive Rate of Return |
| NG | Natural Gas |
| NPV | Net Present Value |
| O&M | Operational and Maintenance |
| OPEX | Operational Expenditure |
| RO | Reverse Osmosis |
| SS | Steady State |
| SF | Steady Flow |
- ,
A review of concentrated solar power hybrid technologies ,Appl. Therm. Eng. , Vol. 127 ,pp 602-637 , 2017, https://doi.org/https://doi.org/10.1016/j.applthermaleng.2017.08.038 - ,
Solar-assisted steam power plant retrofitted with regenerative system using Parabolic Trough Solar Collectors ,Energy Reports , Vol. 6 ,pp 124-133 , 2020, https://doi.org/https://doi.org/10.1016/j.egyr.2019.12.019 - ,
Thermodynamic analysis of a novel integrated solar combined cycle ,Appl. Energy , Vol. 122 ,pp 133-142 , 2014, https://doi.org/https://doi.org/10.1016/j.apenergy.2014.02.017 - ,
Retrofitting gas turbine units parabolic trough concentrated solar power for sustainable electricity generation ,ASME International Mechanical Engineering Congress and Exposition, Proceedings (IMECE) , Vol. 6A-144113 , 2018, https://doi.org/https://doi.org/10.1115/IMECE2018-87673 - ,
Thermoeconomic analysis and optimization of a regenerative two-stage organic Rankine cycle coupled with liquefied natural gas and solar energy ,Energy , Vol. 126 ,pp 899-914 , 2017, https://doi.org/https://doi.org/10.1016/j.energy.2017.03.064 - ,
Hybridizing concentrated solar power (CSP) with biogas and biomethane as an alternative to natural gas: Analysis of environmental performance using LCA ,Renew. Energy , Vol. 66 ,pp 580-587 , 2014, https://doi.org/https://doi.org/10.1016/j.renene.2013.12.023 - ,
Sustainable biorefineries: What was learned from the design, analysis and implementation ,J. Sustain. Dev. Energy, Water Environ. Syst. , Vol. 8 (1),pp 88-117 , 2020, https://doi.org/https://doi.org/10.13044/j.sdewes.d7.0268 - ,
Brief on biomass for energy in the European Union , 2019, https://doi.org/https://doi.org/10.2760/546943 - ,
Technological assessment of different solar-biomass systems for hybrid power generation in Europe ,Renew. Sustain. Energy Rev. , Vol. 68 ,pp 1115-1129 , 2017, https://doi.org/https://doi.org/10.1016/j.rser.2016.08.016 - ,
Increasing the efficiency of parabolic trough plants using thermal oil through external superheating with biomass ,Energy Convers. Manag. , Vol. 77 ,pp 784-793 , 2014, https://doi.org/https://doi.org/10.1016/j.enconman.2013.10.022 - ,
Solar tower-biomass hybrid plants - Maximizing plant performance ,Energy Procedia , Vol. 49 (0),pp 1197-1206 , 2014, https://doi.org/https://doi.org/10.1016/j.egypro.2014.03.129 - ,
Proposal and analysis of two novel integrated configurations for hybrid solar-biomass power generation systems: Thermodynamic and economic evaluation ,Energy Convers. Manag. , Vol. 160 (October 2017),pp 411-425 , 2018, https://doi.org/https://doi.org/10.1016/j.enconman.2018.01.061 - ,
Power generation enhancement in a biomass-based combined cycle using solar energy: Thermodynamic and environmental analysis ,Appl. Therm. Eng. , Vol. 153 (January),pp 128-141 , 2019, https://doi.org/https://doi.org/10.1016/j.applthermaleng.2019.02.112 - ,
Novel hybrid solar tower-gas turbine combined power cycles using supercritical carbon dioxide bottoming cycles ,Appl. Therm. Eng. , Vol. 178 ,pp 115588 , 2020, https://doi.org/https://doi.org/10.1016/j.applthermaleng.2020.115588 - ,
New solar-biomass power generation system integrated a two-stage gasifier ,Appl. Energy , Vol. 194 ,pp 310-319 , 2017, https://doi.org/https://doi.org/10.1016/j.apenergy.2016.06.081 - ,
Analysis of a feasible trigeneration system taking solar energy and biomass as co-feeds ,Energy Convers. Manag. , Vol. 122 ,pp 74-84 , 2016, https://doi.org/https://doi.org/10.1016/j.enconman.2016.05.063 - ,
A novel integrated solar gas turbine trigeneration system for production of power, heat and cooling: Thermodynamic-economic-environmental analysis ,Renew. Energy , Vol. 152 ,pp 925-941 , 2020, https://doi.org/https://doi.org/10.1016/j.renene.2020.01.088 - ,
Optimal coupling of a biomass based polygeneration system with a concentrated solar power facility for the constant production of electricity over a year ,Comput. Chem. Eng. , Vol. 72 ,pp 273-283 , 2015, https://doi.org/https://doi.org/10.1016/j.compchemeng.2013.11.006 - ,
Performance analysis of a polygeneration system for methanol production and power generation with solar-biomass thermal gasification ,Energy Procedia , Vol. 61 ,pp 1561-1564 , 2014, https://doi.org/https://doi.org/10.1016/j.egypro.2014.12.170 - ,
A polygeneration system for the methanol production and the power generation with the solar-biomass thermal gasification ,Energy Convers. Manag. , Vol. 102 ,pp 190-201 , 2015, https://doi.org/https://doi.org/10.1016/j.enconman.2015.02.031 - ,
Techno-economic assessment of substituting natural gas based heater with thermal energy storage system in parabolic trough concentrated solar power plant ,Renew. Energy , Vol. 75 ,pp 152-164 , 2015, https://doi.org/https://doi.org/10.1016/J.RENENE.2014.09.025, Mar. - ,
Combustion performance of liquid biofuels in a swirl-stabilized burner ,J. Eng. Gas Turbines Power , Vol. 130 (3),pp 1-9 , 2008, https://doi.org/https://doi.org/10.1115/1.2836747 - ,
Performance and emission characteristics of biofuel in a small-scale gas turbine engine ,Appl. Energy , Vol. 87 (5),pp 1701-1709 , 2010, https://doi.org/https://doi.org/10.1016/j.apenergy.2009.10.024 - ,
Alternative fuel for gas turbine: Esterified jatropha oil-diesel blend ,Renew. Energy , Vol. 36 (10),pp 26352640 , 2011, https://doi.org/https://doi.org/10.1016/j.renene.2010.06.013, Oct. - ,
Performance Analysis Of A Single Shaft Gas Turbine Using Biofuels , 2016, https://doi.org/https://doi.org/10.21608/amme.2016.35276 - ,
DOWTHERM A ,Synthetic organicheat transfer fluidLiquid and Vapor Phase Data , - ,
A Product Technical Data DOWTHERM A Heat Transfer Fluid , http://www.dow.com/heattrans - ,
Energy Sector Management Assistance Program Study of Equipment Prices in the Power Sector , 2009https://esmap.org/sites/default/files/esmap-files/TR122-09_GBL_Study_of_Equipment_Prices_in_the_Power_Sector.pdf - ,
Home - DesalData , https://www.desaldata.com/?utm_campaign=1801430_DD Webinar Jan 2020 - 1st Email to DD Subs&utm_medium=email&utm_source=Global Water Intelligence&dm_i=3KBM,12LZQ,55E2M8,3Q6XO,1 - ,
Economics of biodiesel production from Jatropha oil ,J. Agric. Technol. , Vol. 8 (82),pp 657-662 , 2012 - ,
Simulation and cost estimate for biodiesel production using castor oil ,Chem. Eng. Res. Des. , Vol. 88 (56),pp 626-632 , 2010, https://doi.org/https://doi.org/10.1016/j.cherd.2009.09.015 - ,
Cost competitiveness of palm oil biodiesel production in Indonesia ,Energy , Vol. 170 ,pp 62-72 , 2019, https://doi.org/https://doi.org/10.1016/j.energy.2018.12.115 - ,
Home - Residential Rates And Tariffs 2018 , https://www.addc.ae/en-US/residential/Pages/RatesAndTariffs2018.aspx - ,
Recensione: OECD-FAO Agricultural Outlook 2008-2017 ,Economia & Diritto Agroalimentare ,pp 191206 , 2018