


As in other semi-arid regions of the world, the Brazilian semi-arid region is characterized by a dry climate, high temperatures and unpredictable rainfall, with an annual average of less than 800 mm [1]. Additionally, it has water deficiency, high evaporative demand, shallow soils and social organization in addition to high levels of insolation [2].
The growth of renewable energies, mainly solar energy in the context of the Brazilian semi-arid region can make important contributions both at a regional level and in a broader scope, the energy matrix can benefit from the gains, due to the decentralization of conventional sources [3]. Also, there are environmental benefits; a greater share of renewable resources is in line with the objectives of reducing polluting emissions mitigating climate change and global warming. It is important to note that one of the 17 sustainable development goals of the UN 2030 agenda addresses the issues of affordable reliable modern and clean energy for all (SDG 7) [4], [5]. Renewable sources are key elements to support sustainable development [6] and can also make a social contribution to people living in poorer areas, such as indigenous peoples, isolated communities, rural settlements, etc. [7].
The Brazilian semi-arid region has a high incidence of solar radiation, an average of 5.90 kWh/m2 day. This high solar potential can be used to develop isolated solar systems or systems connected to the grid. These energy systems offer economic and social benefits to people in poor communities around the world [8], [9], helping in this way to achieve SDG 1 (End poverty in all its forms, everywhere). In this context, research regarding the use of solar technology has already been carried out [10], [11]. Recently, Jean and Brasil Jr. [12] concluded that an isolated system (battery/photovoltaic) brought electricity to a small village of 26 families in Haiti, benefiting education, health, agriculture and consequently, the income of the farmers. Shezan et al. [13] simulated a photovoltaic/wind system to satisfy a load of 80 kWh/d in a community in Indonesia. They concluded that the optimized Net Present Cost (NPC) would be US$ 160,626.00 a reduction of 29.65% compared to conventional systems and the local cost of energy (COE) would be 0.43 US$/kWh. The system could still reduce 16 tons of CO2 per year. Another study by Arcela et al. [14] in a semi-arid rural community showed that a solar photovoltaic system connected to the grid in low-income properties could reduce energy bills by 46%.
According to Vieira et al. [15], Grid-connected solar photovoltaic systems are seen as a form of distributed solar generation (DSG) and contribute to providing energy close to the point of consumption [16], [17]. These systems are easily adapted to local architecture as long as there is an incidence of sunlight [18].
The literature shows that these systems constitute micro and mini-power generation plants connected to the national electricity system [15], [19]-[21]. These micro and mini plants can generate energy credits during periods when generation is greater than consumption. According to Benalcázar et al. [17], in several investigations, mechanisms of these systems were found, such as: i) Feed-in Tariff [22], [23], where the distribution company should acquire the energy generated from photovoltaic generation units; ii) net energy balance or “Net metering” (NMe) [23]-[25] that calculates the difference between the energy consumed by the user from the grid and the energy received from a photovoltaic generation unit and; iii) balance Net Billing or “Net Billing” (NBi) [26] values separately and with a different price for the energies described in NMe. In Argentina, for example, Law 27.424 was created that allows a residential user to become a user/generator and still establishes the mechanism of Net Billing (NBi) or net billing balance as a remuneration structure [16], [27]. In Ecuador, the government through the Electricity Regulation and Control Agency (ARCONEL) has similar and ambitious initiatives [17]. In Brazil, the current legislation (resolution 687/2015 of the National Energy Regulation Agency - ANEEL) only allows obtaining energy credits to reduce their consumption in the system; the sale of this credit or surplus to individuals is not allowed [28].
The towns of the Brazilian semi-arid region suffer the main effects of the drought which hinders the development of agriculture and livestock which in turn causes a shortage of income for the population, hunger, poverty together with the lack of electricity in some communities and consequently, rural exodus. Thus, this research proposes to model a solar photovoltaic system connected to the electrical grid (micro-grid) to meet the demands for electrical loads on the properties of rural farmers in the Brazilian semi-arid region and to sell the surplus in order to generate income for farming families. This scenario shows a veiled exclusion of this type of consumer, as does the current Brazilian legislation. It is important to note that the literature does not show any research on this.
In order to improve the energy sustainability of small communities and rural settlements already electrified through the conventional grid in Brazil, this research presents an energy modeling considering the large solar potential and the use of the conventional grid.
To model the system, two computational tools were considered, HOMER (Hybrid Optimization of Multiple Energy Resources) and SAM (System Advisor Model). The HOMER computational tool is a computational model developed to design microenergy systems [29]. This tool was used to model the system. Developed by the National Renewable Energy Laboratory (NREL), the System Advisor Model is a computational modeling tool for renewable energy systems. SAM uses a general purpose commercial TRNSYS for simulations of Concentrating Solar Power Systems (CSP) or Solar Photovoltaic System (PV) connected to the grid and wind systems. In this research, SAM was used to compare HOMER’s results.
The modeling was carried out in such a way that the system can buy and sell energy for the grid depending on the time of day and climatic conditions. For example, on rainy and/or cloudy days, periods without solar radiation, the system will use the grid. The purchase price of electricity from the grid may include an energy charge based on the amount of energy consumed in a billing period and a demand charge based on peak demand in the billing period. Thus, if purchases exceed sales, the consumer pays the concessionaire an amount proportional to those purchases. Otherwise, the concessionaire would pay the consumer an amount equal to the grid’s net sales times the resale rate, as evidenced in the sales scenarios for the research. Some sales scenarios were carried out varying the value of the energy tariff in kWh in the target region of this research on a scale from 50% to 100%. Note that 100% represents the full amount of the local energy tariff. In other scenarios, 80%, 70%, 60% and 50% of the total value of the local energy tariff were considered.
As previously reported (in the introduction), in Brazil the legislation does not allow the sale of electricity by individuals [28]. In this research, it is assumed that the surplus energy was allowed to be commercialized in the grid, a scenario that goes against the law, with a focus on promoting social well-being. Some variables were considered, such as the value of the energy from the grid that the energy concessionaire requires for the purchased energy (US$/kWh), and the demand rate for the amount that the concessionaire charges (US$/kWh/month). Finally, the resale fee, which is the price that the concessionaire would pay for the energy available to be sold to the grid (US$/kWh).
To determine the required power load and demand from the power grid, the following equations are used [30]:
(1)
(2)
where, Egridpurchases,i,j is the amount of energy purchase from the grid in month j during the time that rate i applies (kWh). Cpower,i is the grid power price for rate i (US$/kWh). Egridsales,i,j, is the amount of energy sold to the grid in month j during the time that rate i applies (kWh). Csellback,i, is the sellback rate for rate i (US$/kWh). Pgrid,peak,i,j, is the peak hourly grid demand in month j during the time that rate i applies (kWh). Cdemand,i, is the grid demand rate for rate i (US$/kW/month).
To determine the PV array power output the eq. (3) is used [30]. It is important to highlight that some variables were considered in order to minimize the generation error. These variables refer to the location, angles of direction and inclination, in addition to the conditions regarding the installation.
(3)
To determine the surface temperature, the eq. (4) [31] was considered:
(4)
where, YPV is the rated capacity of the PV array, meaning its power output under standard test conditions (kW). fPV is the PV derating factor (%). is the solar radiation incident on the PV array in the current time step (kW/m2). is the incident radiation at standard test conditions (1 kW/m2). αP is the temperature coefficient of power (%/°C) and TC is the PV cell temperature in the current time step (°C).
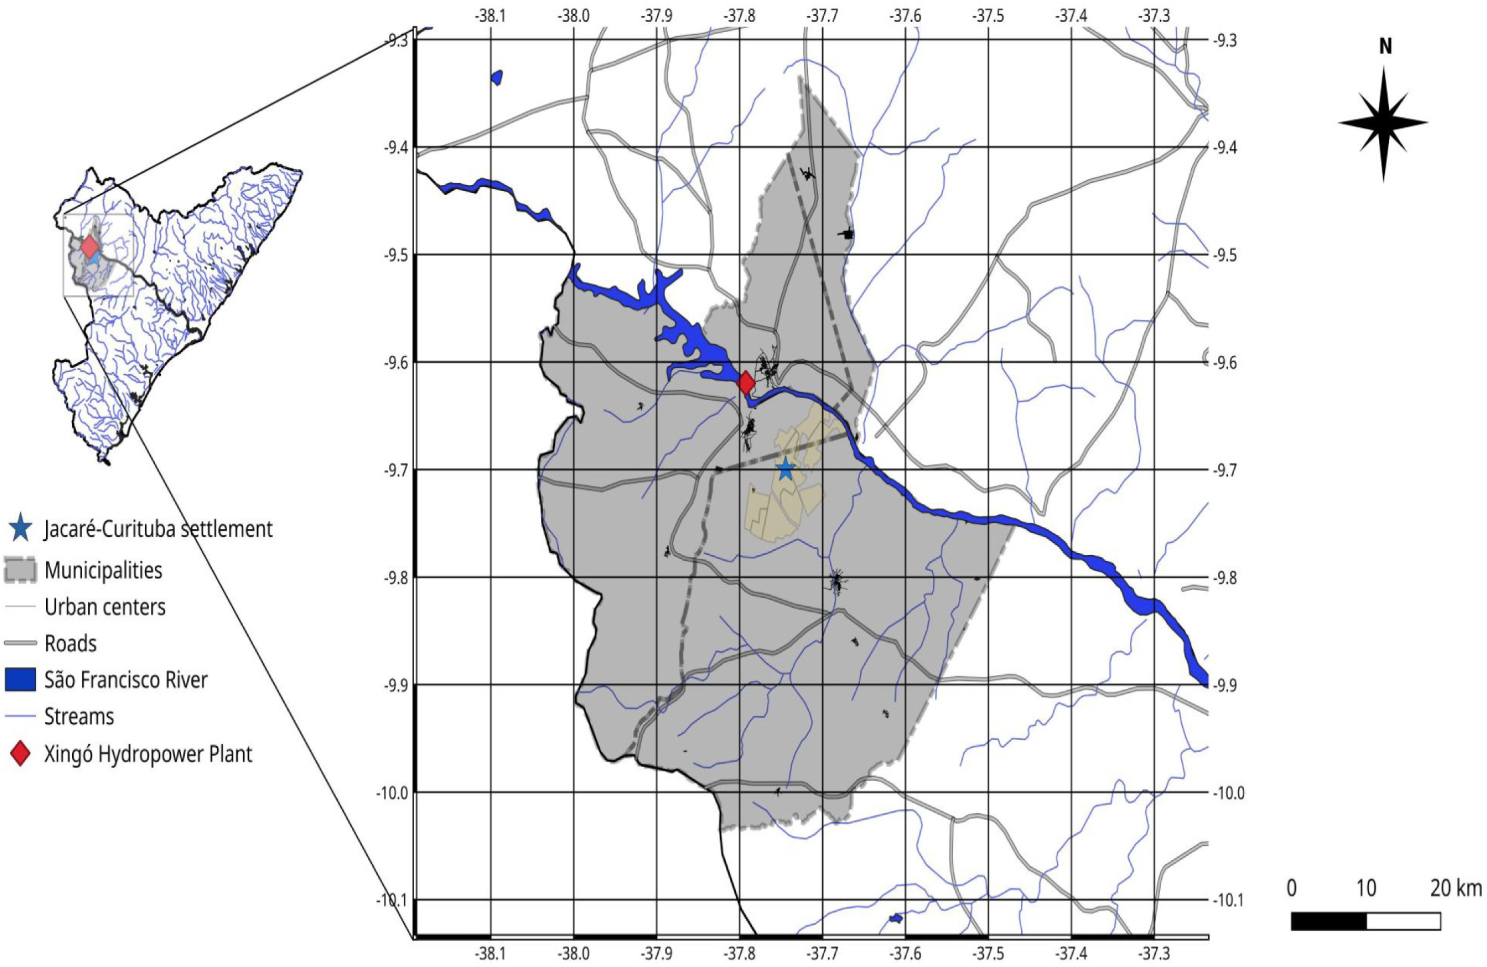
The rural settlement of “Jacaré-Curituba” is located in the northwest of Sergipe State, in the Brazilian semi-arid region. It is located at the geographic coordinates of 9º 42’ S latitude and 37º 44’ W longitude (Figure 1). The average annual temperature in the region is around 25.3 °C. The hottest season runs from early October to March, with an average temperature above 34°C. The season considered milder remains from early June to mid-August, with an average temperature of 19 °C. There is little rainfall throughout the year, the average annual rainfall is 510.15 mm. The settlement has a total area of 3,105 ha. It is considered the largest irrigated settlement destined for agrarian reform in Latin America, with 1,860 ha irrigated. It has 720 families of which 686 families have access to irrigation.
There is electricity in the settlement, but due to lack of income, families suffer to pay energy bills. The cost of local energy is 0.13 US$/kWh, which is considered high for local living standards. Within the settlement, there is a cooperative, the Agroindustrial Production and Commercialization Cooperative of the Sergipe State (COOPAC). COOPAC processes the cassava and the products are peeled cassava roots ready for cooking, cakes and cassava flour.
Location of the settlement “Jacaré-Curituba”
In order to know the structure of the settlement, collect data and information, technical visits were scheduled, and two visits have already been carried out. In the first technical visit, a group of 10 families was interviewed and in the second 20 families were interviewed. The group of 10 families from the first visit is a pilot that has already had the data processed. To apply the research methodology this group was chosen.
This group of 10 families is called in the survey as “Family Unit”. The energy consumption determined here refers only to the Family Unit. Besides, COOPAC, which is owned by families, is also included in the calculations. Table 1 shows the daily consumption values. The total monthly electrical load demand is 2,350 kWh.
Electricity consumption of consumer units
Consumer Unit |
Gadgets |
Power (W) |
Consumption (kWh/d) |
|---|---|---|---|
COOPAC |
Cold chamber |
1,500 |
36 |
Centrifugal |
700 |
2.8 | |
Sealer |
100 |
0.4 | |
Freezer |
300 |
7.2 | |
Food processor |
120 |
0.6 | |
Blender |
200 |
0.8 | |
| Family Unit | Computer |
180 |
1.08 |
Fan |
50 |
0.15 | |
Stereo |
15 |
0.03 | |
Color TV (18") |
130 |
0.52 | |
Fluorescent lamps |
20 |
0.48 | |
Fridge |
80 |
1.76 | |
Total |
51.82 |
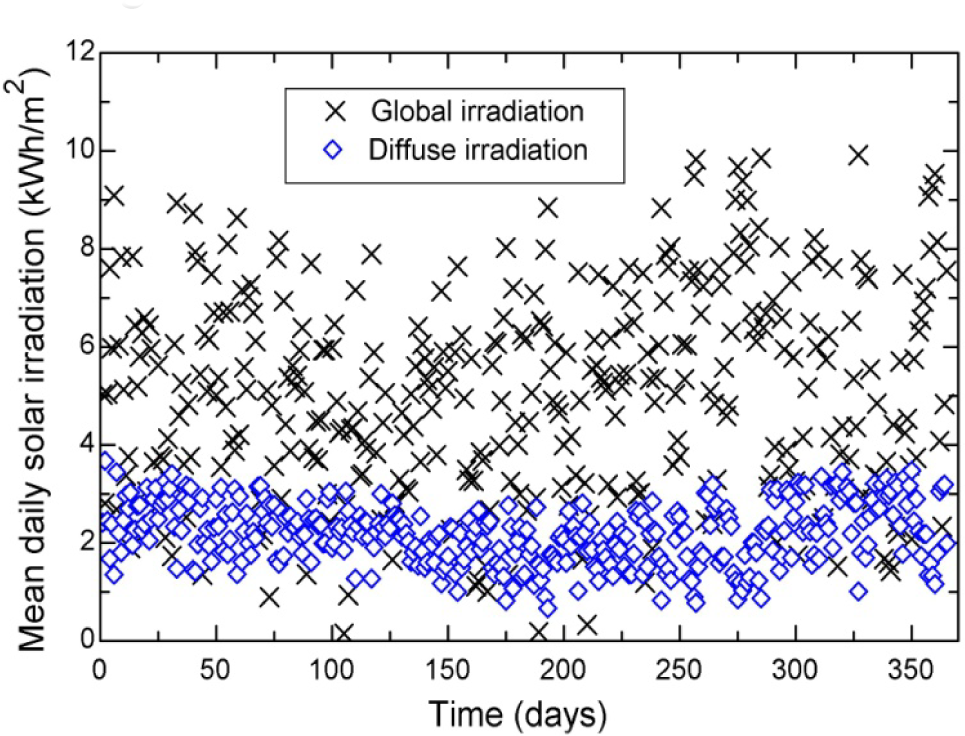
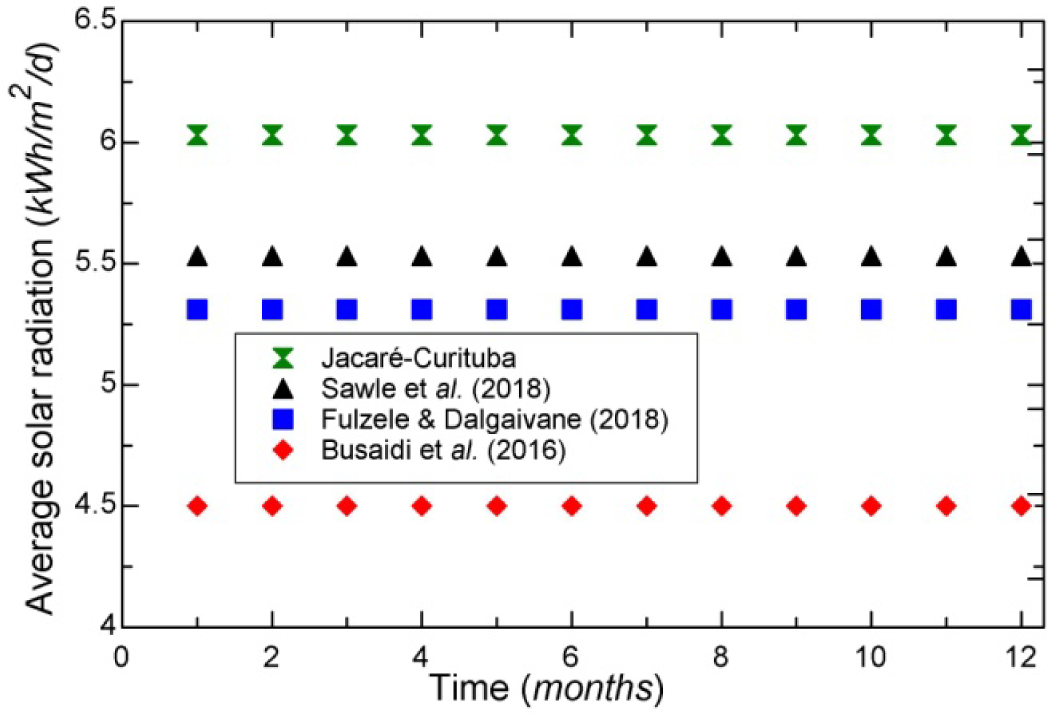
Figure 2 indicates the daily behavior of global and diffuse solar irradiation throughout the year in the settlement. Note that the global average daily irradiance is 6.03 kWh/m2 and can be onsidered high compared to other studies. Sawle et al. [32] in Barwani, India; Fulzele and Daigavane [33] in the Yavatmal district of India and Busaidi et al. [34] in Oman, found respectively values of 5.53 kWh/m2 d, 5.31 kWh/m2 d and 4.50 kWh/m2 d (Figure 3). For comparison, it can be seen that these values in these researches are lower than the value of solar irradiation in the location of this research, which shows the feasibility of developing the photovoltaic system in the region.
Daily behavior of global and diffuse solar irradiation
Comparison of global solar irradiation
In this section the search results are presented. In the first subsection, the generation potential of the PV system is described. The following two subsections show the behavior of buying and selling energy on the grid. Next, the energy balance is presented, comparing sales and purchases on the grid. The last subsection deals with the cash flow, the financial gains that could be obtained from the sale of the energy balance on the grid.
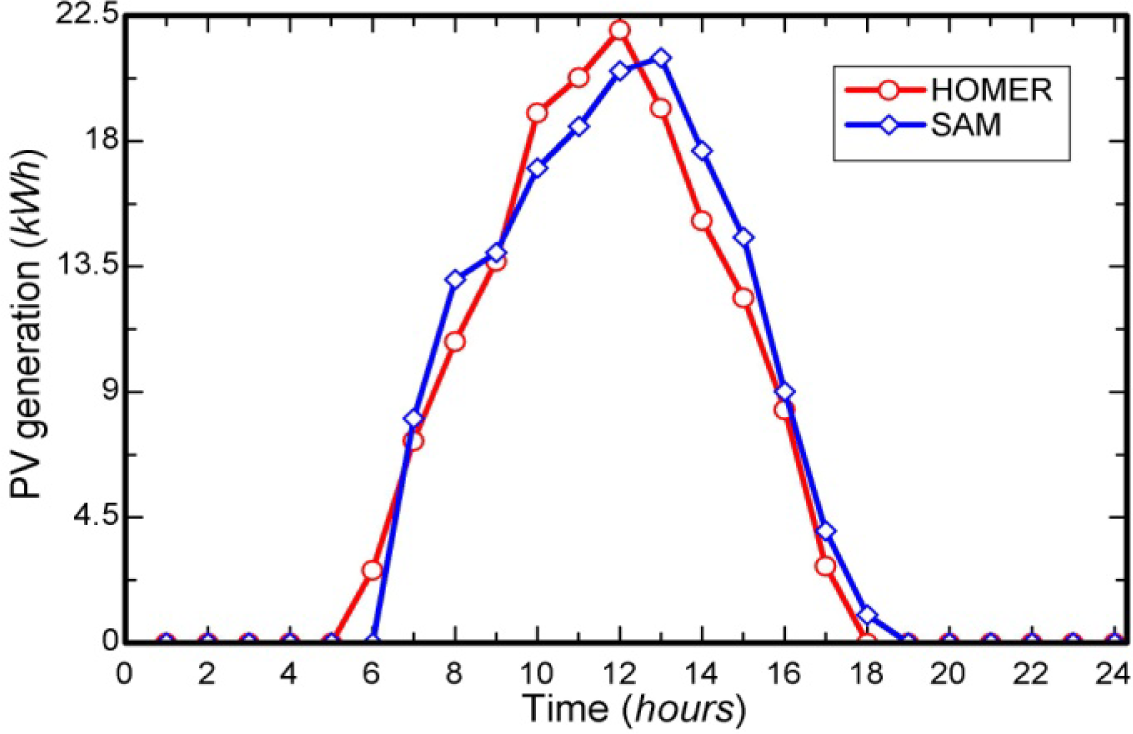
Figure 4 and Figure 5 show respectively, the hourly and monthly production in kWh of the PV. According to HOMER’s results, the system generates at least 3,500 kWh in June (less solar radiation), an increase of 48.90% concerning the electrical load and a maximum of 5,500 kWh in October, an increase of 134% with the electrical load from the strong solar radiation of that month. The SAM results as can be seen in Figure 4 follow the same trend as the HOMER results. In Figure 5, the monthly PV values in SAM are slightly higher compared to HOMER.
PV hourly generation
PV monthly generation
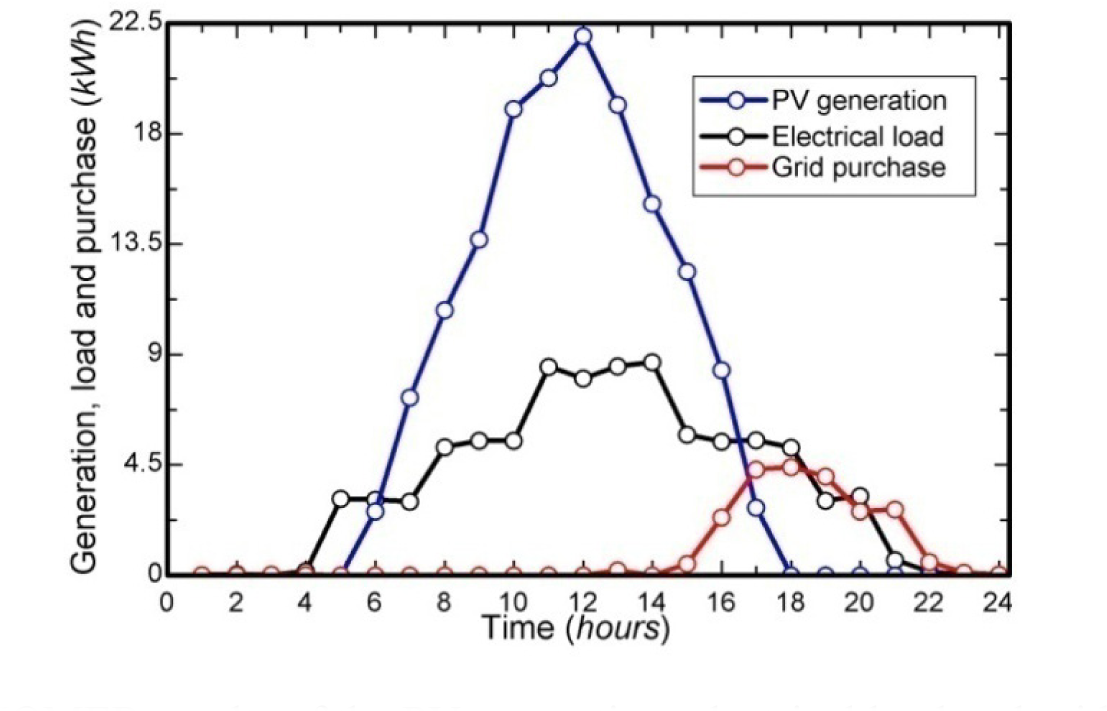
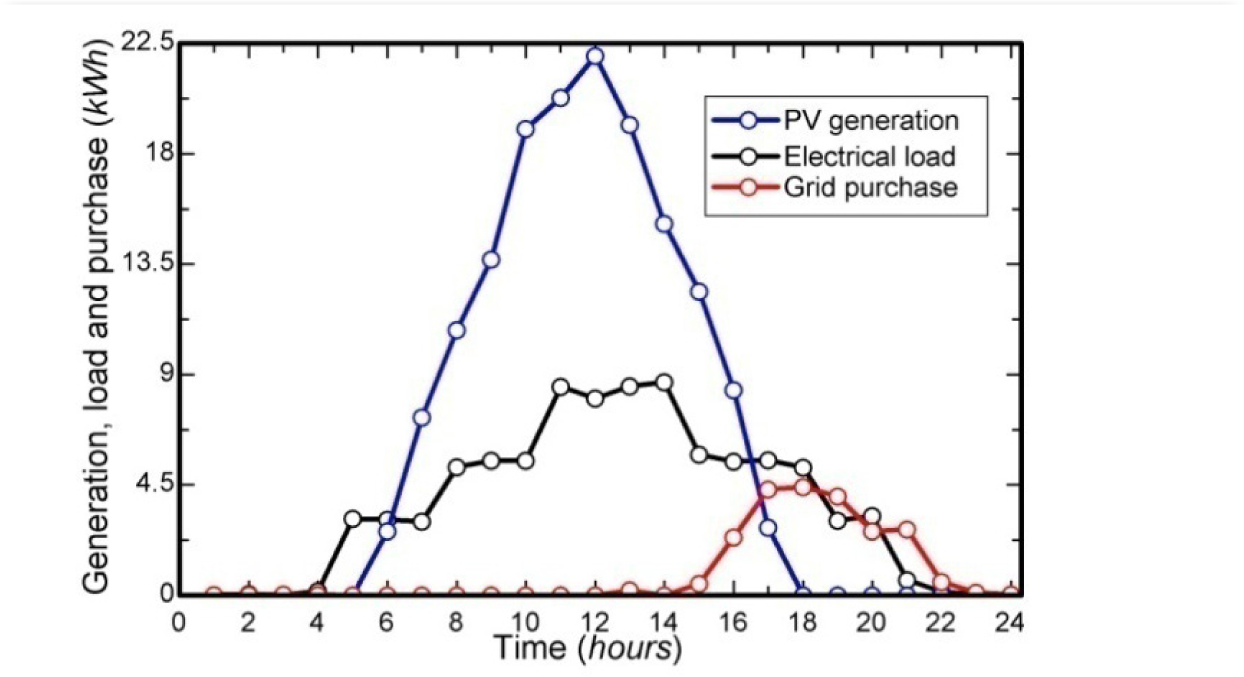
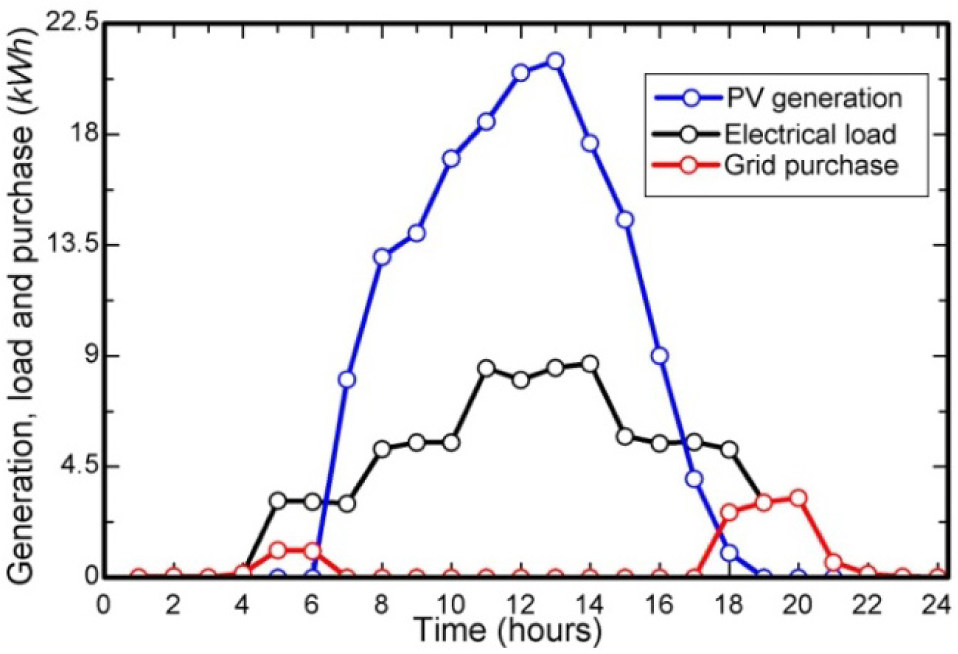
In months with less solar radiation or times without solar radiation, such as at night and on cloudy or rainy days, energy consumption can be higher than PV production. Therefore, the necessary difference would be recovered through the grid. As can be seen in the graph in Figure 6, for a typical day, the purchase of energy in the grid is due to the need for consumption in that period, in certain periods the need to purchase tends to zero and in others it may reach up to 4.50 kWh, depending on the consumption in that period. Figure 7 shows the monthly variation of online purchases. What can be observed is that in June, July and August the purchase on the grid is greater, this is due to the decrease in the average solar radiation that impacts the production of the PV. Figure 8 (HOMER results) and Figure 9 (SAM results) show the hourly behavior of PV generation and the electrical load to be covered, which consequently impacts the purchase of energy in the grid.
Hourly purchase of energy in the grid

Monthly purchase of energy in the grid
HOMER results of the PV generation, electrical load and grid purchase
SAM results of the PV generation, electrical load and grid purchase
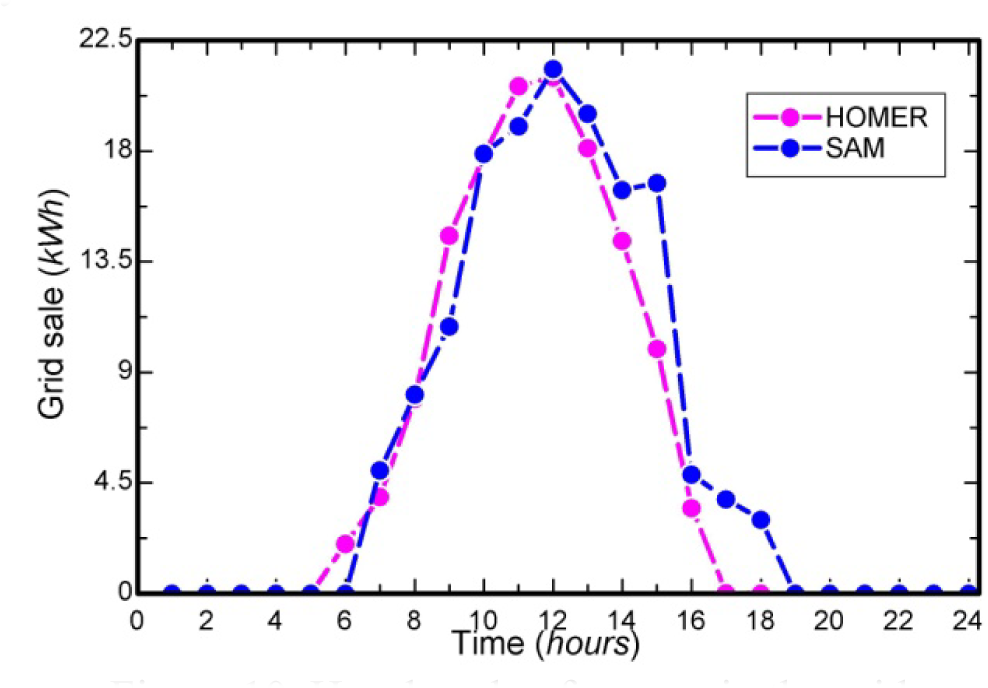
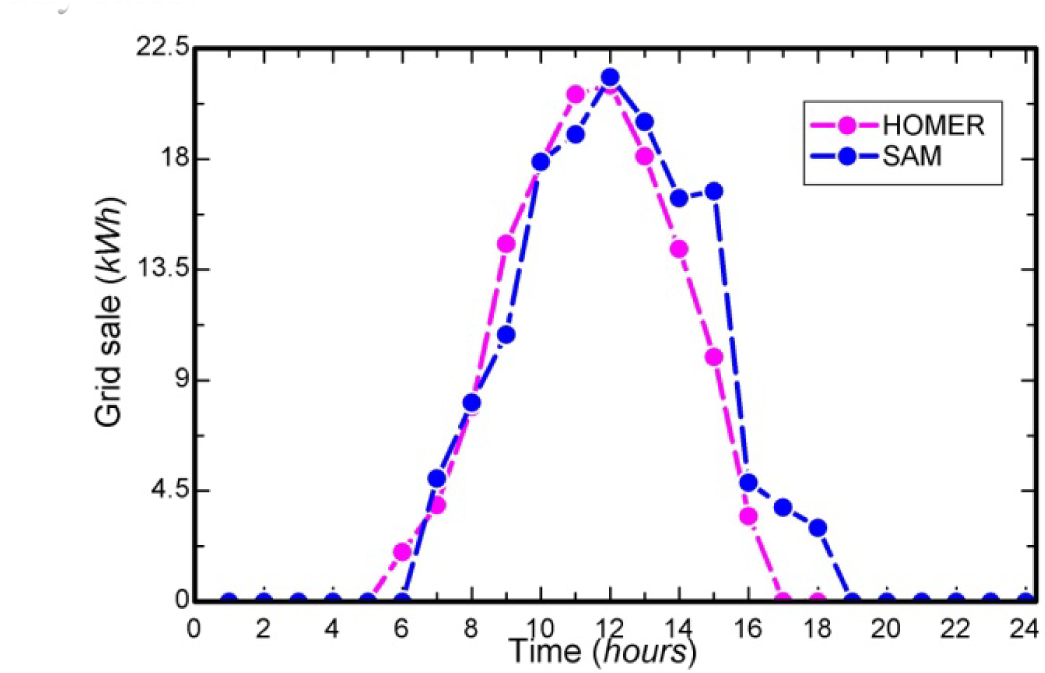
Due to the lower level of solar radiation in certain periods, it would be necessary to acquire energy on the grid. Likewise, if the opposite occurs, the inverter sends the excess energy to the grid, thus generating energy credits. These credits would be sold to the local concessionaire. Figure 10 and Figure 11 show the amount of energy that would be sold per hour and month on the grid. In Figure 10, from HOMER’s results, it can be seen that from 05:00 in the morning the system starts generating credits on the grid, the peak is at noon and the credits continue to be generated until 17:30. Figure 11 (HOMER results) shows the monthly average of energy credit that would be generated and sold in the grid is high, with a maximum value of 3,250 kWh in October and 1,750 kWh of the minimum value in June, which are respectively the months with greater and less solar radiation in the locality. As for SAM’s results, it follows the same trend, with slightly higher monthly sales.
Hourly sale of energy in the grid
Monthly sale of energy in the grid
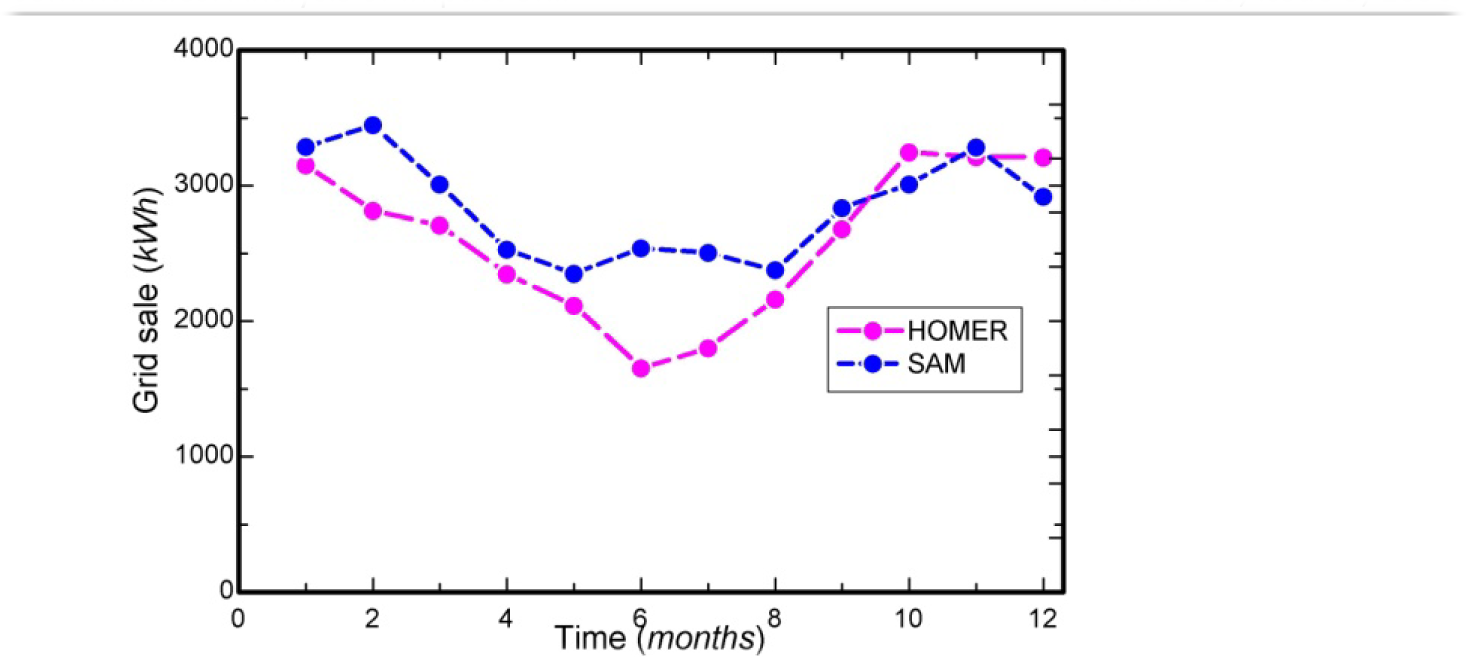
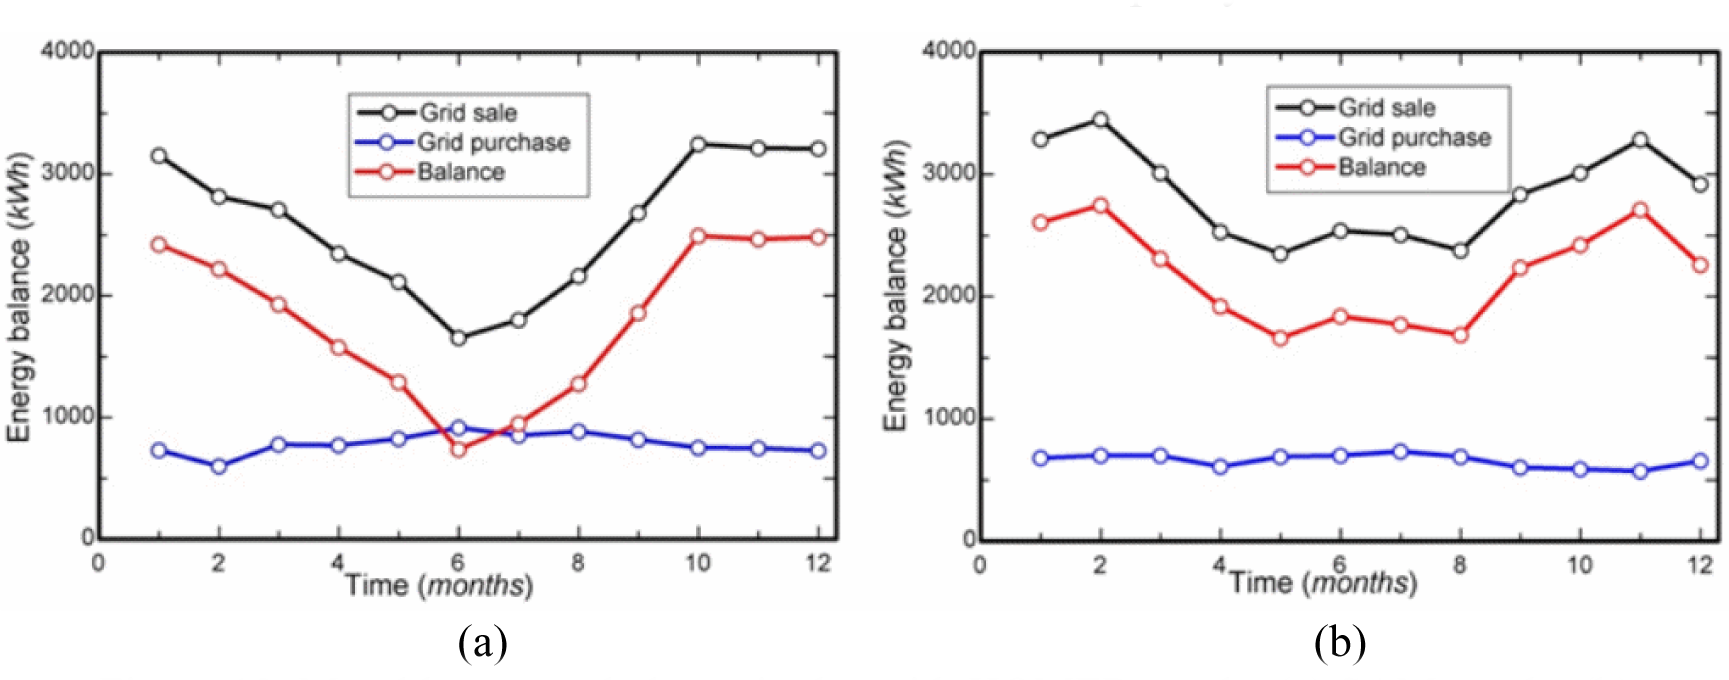
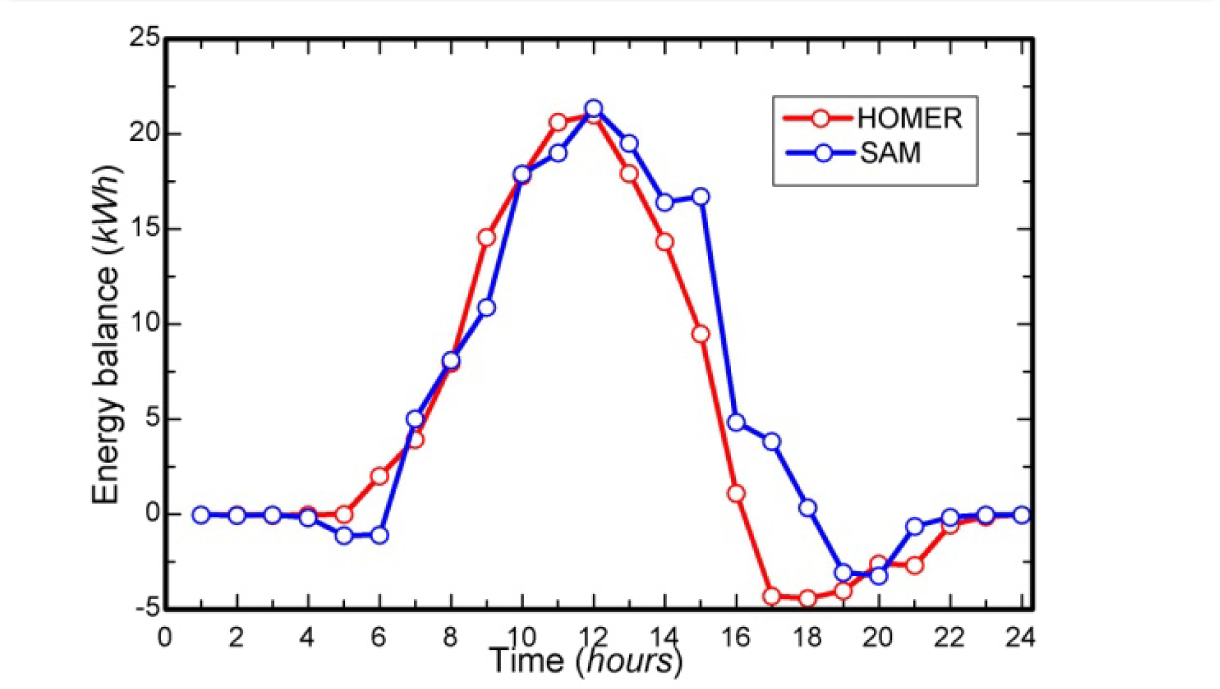
Figure 12a and Figure 13a (HOMER results) show the hourly and monthly energy balance. It is observed that in Figure 12a, in the period from 05:30 to 17:00 there was a considerable positive balance of energy sales on the grid, in that period there would be no need to buy energy. However, the balance is negative from 17:00 to 22:00 due to the lack of PV generation, the system uses the grid. The monthly balance is positive and high during practically the whole year, highlighting the months from October to January in which the payment can reach up to 2,500 kWh (Figure 13a). In June the balance is lower (value slightly above 500 kWh) due to lower generation in that month (Figure 13a).
Hourly energy balance in the grid: HOMER results (a) and SAM results (b)
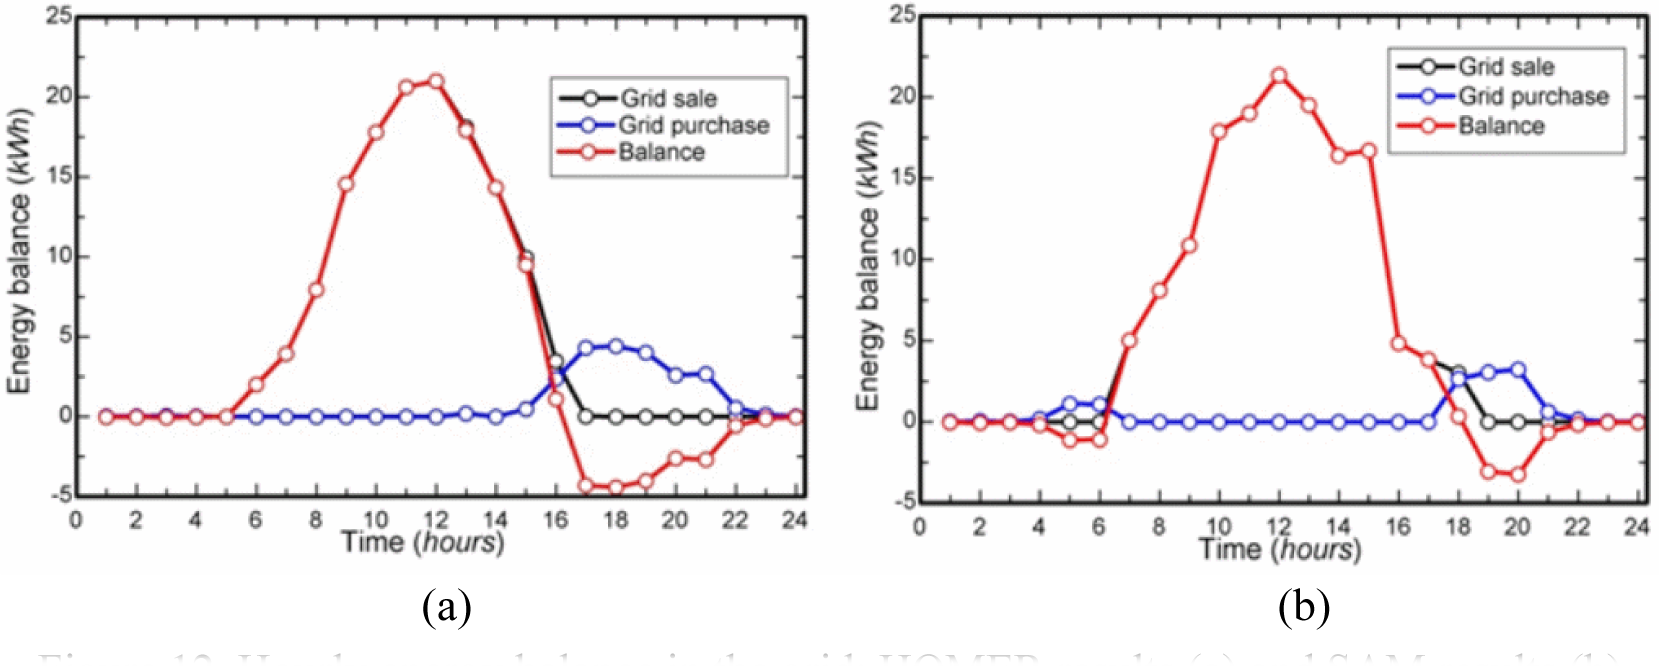
Figure 12b and Figure 13b show the hourly and monthly energy balance of the SAM results. It is observed that these SAM results follow the same trend as the HOMER results, with only a small discrepancy in the hourly energy balance (Figure 12b). It can be observed that between 04:00 and 06:00 the energy balance becomes negative. The Figure 14, hourly energy balance for HOMER and SAM results shows this small discrepancy well.
Monthly energy balance in the grid: HOMER results (a) SAM results (b)
Hourly energy balance for HOMER and SAM results
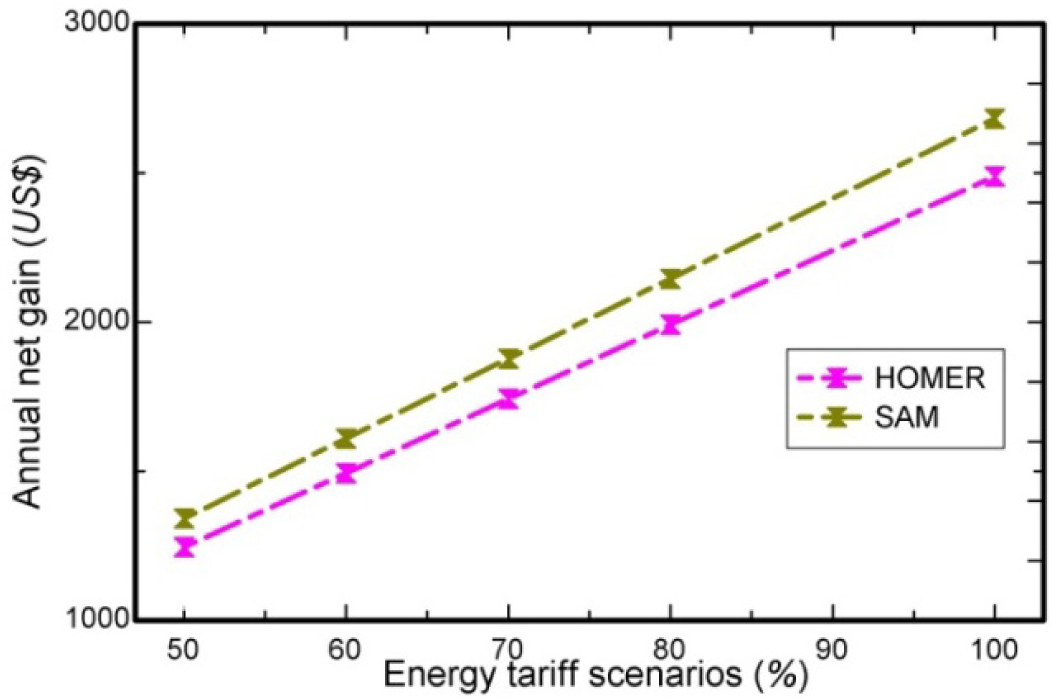
As previously shown, sales scenarios were carried out varying the value of the region’s energy tariff. In Figure 15 the annual net gain that could be obtained is shown, the variation of the values is linear. It is noted that the sale of energy in the grid could bring an annual gain that varies between US$ 1,244.64 (50%) to US$ 2,489.28 (100%) in the simulation carried out through the HOMER software. In the SAM simulation, the annual profit varies between US$ 1,340.75 (50%) and US$ 2,681.50 (100%). Table 2 shows in more detail according to the variation in the sale price of the rate.
Earnings in dollars (US $) obtained due to the sale of energy in the grid
Computational tools |
Variables |
50% |
60% |
70% |
80% |
100% |
|---|---|---|---|---|---|---|
HOMER |
Sale |
1,726.7 |
2,072.1 |
2,417.4 |
2,762.8 |
3,453.5 |
Purchase |
964.20 |
964.20 |
964.20 |
964.20 |
964.20 | |
Annual gain |
1,244.6 |
1,493.6 |
1,742.5 |
1,991.4 |
2,489.3 | |
SAM |
Sale |
1,747.1 |
2,096.5 |
2,445.9 |
2,795.3 |
3,494.1 |
Purchase |
812.64 |
812.64 |
812.64 |
812.64 |
812.64 | |
Annual gain |
1,340.8 |
1,608.9 |
1,877.1 |
2,145.2 |
2,681.5 |
Gain with the sale of energy in grid
In Figure 5, it was possible to observe that the PV system could provide a minimum of almost 49% and a maximum of 134% concerning the electrical load to be met according to the results of HOMER. SAM results follow the same trend. These results point to a scenario in which there would be a surplus that would be passed on to the grid as determined by current legislation [28]. However, focusing on the research objectives, a scenario that goes against the law, the surplus would be sold to the grid (Figure 11), differently the research by Benalcázar et al. [17], Orioli and Di Gangi [23], Cadavid et al. [24] and Sajjad et al. [25].
It is also important to note that in certain periods such as the night, cloudy and/or rainy periods, the generation of the system would be less about the electrical load or even zero. During these periods the grid can meet the needs of the electrical load, buying energy on the grid. In this research, starting at 15:00, the purchase period starts and runs until 23:00 according to the need for electrical load in the homes of settled families (Figure 6), HOMER results. SAM results show that purchases start from 04:00 until 07:00. These grid purchases result in a monthly average of 650 kWh (HOMER results) and an average of 750 kWh/month (SAM results) (Figure 7).
With the purchase and sale of energy for the grid, a positive balance was created in this way, as shown in Figure 12b and Figure 14 [23]-[25]. In Table 2, it was possible to see the annual variation of a gain scenario, in which there would be a minimum of US$ 1,244.64 (50%) and a maximum of US$ 2,489.28 (100%) for HOMER results (Figure 15). For SAM results, the minimum would be US$ 1,340.75 (50%) and the maximum US$ 2,681.50 (100%) (Figure 15). SAM values compared to HOMER show a slight increase of 7.7%. Despite this small increase, the two tools follow the same trend and show consistent results. In addition, the two tools show a promising gain scenario, an alternative income, which would be important for the maintenance of low-income families, who live below the poverty line [29] or even who live on unprofitable agriculture.
It is also important to consider that, in addition to these economic and social issues, the focus of solar energy with a social nature in the research highlights a situation that reinforces the actions of the policies for preserving the environment and the UN 2030 agenda, clean, accessible, modern and reliable for all (SDG 7) [4], [5].
Brazilian semi-arid lands have low agricultural productivity and are highly devalued. Furthermore, the economic level of the region reflects important social differences. The contradictions and social injustices that permeate the region can even be seen in access to income. More than 1.5 million families depend on the benefits of government social programs. Social programs tend to have several shortcomings, in addition to being costly to the public purse. Therefore, new income-generating initiatives are needed to improve people’s lives.
In this way, this research modeled a photovoltaic solar system connected to the electrical network (micro-grid) that has an excess that, if sold, could bring an alternative social income to low-income families. The HOMER and SAM computational tools were used to model the system.
Although the SAM values compared to the HOMER software showed slightly higher results, it could be noted that the results of the two tools had the same trend, which in fact indicates the consistency of the results.
The main results of this research show that to meet the monthly demand of 2,350 kWh from the Family Unit and COOPAC of the rural settlement of “Jacaré-Curituba”, the photovoltaic system connected to the grid could produce at least 3,500 kWh/month and a maximum of 5,500 kWh/month. In this way, the surplus would be marketed and families would have another income alternative to improve their social living conditions. This alternative seeks long-term benefits and could even replace other cash transfer programs or policies that lack complementary policies. In addition to the social benefits, there are environmental benefits from the use of renewable sources and the diversification of the energy matrix.
Finally, the idea behind this research looks viable and promising. However, first of all, it would be necessary to change the current legislation, that is, to allow people in low-income situations and who live in remote communities, the possibility of selling the surplus energy generated in their own homes. The methodology used in this research can be replicated for all the families of the settlement as well as in other regions that have similar characteristics.
- , , Climatologia: Nocoes Basicas e Climas Do Brasil, 2007
- , , Proceedings of the Congresso Nacional da Diversidade do Semiarido (CONADIS), 2018
- , http://repositorio.ipea.gov.br/bitstream/11058/9680/1/TD_2541.pdf
- ,
Lighting the World: the first application of an open source, spatial electrification tool (OnSSET) on Sub-Saharan Africa, Environm ,Res. Lett. , Vol. 12 (8), 2017, https://doi.org/https://doi.org/10.1088/1748-9326/aa7b29 - ,
A GIS for Rural Electrification Strategies in the Brazilian Amazon ,Pap. in Appl. Geogr. , 2021, https://doi.org/https://doi.org/10.1080/23754931.2020.1870539 - ,
Low carbon transition through renewables sources - An overview of the renewable energy program in the state of Minas Gerais ,J. Sustain. Dev. Energy Water Environ. Syst. , Vol. 2 ,pp 252-267 , 2020, https://doi.org/https://doi.org/10.13044/j.sdewes.d7.0295 - ,
Techno-economic analysis of a PV-wind-battery for a remote community in Haiti, C ,Stud. in Chem. and Environm. Eng. , Vol. 2 ,pp 100044 , 2020, https://doi.org/https://doi.org/10.1016/j.cscee.2020.100044 - ,
Sustainable performance challenges of rural microgrids: Analysis of incentives and policy framework in Indonesia ,Ener. for Sustain. Develop. , Vol. 53 ,pp 57-70 , 2019, https://doi.org/https://doi.org/10.1016/j.esd.2019.08.003 - ,
Evaluating economic feasibility and maximization of social welfare of photovoltaic projects developed for the Brazilian northeastern coast: An attribute agreement analysis ,Renew. and Sustain. Ener. Rev. , Vol. 123 ,pp 109786 , 20182020, https://doi.org/https://doi.org/10.1016/j.rser.2020.109786 - ,
Optimum design of hybrid renewable energy system through load forecasting and different operating strategies for rural electrification, Sustain ,Ener. Technol. and Assessm. , Vol. 37 ,pp 100613 , 2020, https://doi.org/https://doi.org/10.1016/j.seta.2019.100613 - ,
Key technology development needs and applicability analysis of renewable energy hybrid technologies in off-grid areas for the Rwanda power sector ,Heliyon , Vol. 6 (1),pp 03300 , 2020, https://doi.org/https://doi.org/10.1016/j.heliyon.2020.e03300 - Simulacion De Un Sistema Fotovoltaico Para Una Comunidad En Haiti, 2020, http://enerlac.olade.org/index.php/ENERLAC/article/view/123
- ,
Performance investigation of an advanced hybrid renewable energy system in indonesia, Environm ,Prog. and Sustain. Ener. , Vol. 37 (4),pp 1424-1432 , 2018, https://doi.org/https://doi.org/10.1002/ep.12790 - , , Proceedings of the 25th ABCM International Congress of Mechanical Engineering, 2019
- ,
Analysis of the Power Quality of a Grid-Connected Photovoltaic System ,IEEE Lat. Amer. Trans. , Vol. 18 (4),pp 714-721 , 2020, https://doi.org/https://doi.org/10.1109/TLA.2020.9082214 - ,
Economic Analysis of Rooftop Solar PV Systems in Argentina ,IEEE Lat. Amer. Trans. , Vol. 18 (1),pp 32-42 , 2020, https://doi.org/https://doi.org/10.1109/TLA.2020.9049459 - ,
Distributed Photovoltaic Generation in Ecuador: Economic Analysis and Incentives Mechanisms ,IEEE Lat. Amer. Trans. , Vol. 18 (3),pp 564-572 , 2020, https://doi.org/https://doi.org/10.1109/TLA.2020.9082728 - , , Energia Solar Fotovoltaica, 2015
- ,
Comparing solar data from NWP models for Brazilian territory ,IEEE Lat. Amer. Trans. , Vol. 18 (5),pp 899-906 , 2020, https://doi.org/https://doi.org/10.1109/TLA.2020.9082918 - ,
Geracao Fotovoltaica Distribuida: Estudo De Caso Para Consumidores Residenciais De Salvador - Ba ,Rev. Bras. de Energ. Renov. , Vol. 5 (1),pp 164-180 , 2016, https://doi.org/https://doi.org/10.5380/rber.v5i1.45270 - ,
Interconnected Microgrid Systems for Remote Areas ,ust. Dev. in Ener. Syst., January ,pp 1-231 , 2017, https://doi.org/https://doi.org/10.1007/978-3-319-54808-1_3 - ,
The recent change in the italian policies for photovoltaics: Effects on the energy demand coverage of grid-connected PV systems installed in urban contexts ,Energies , Vol. 93 (11),pp 1989-2005 , 2016, https://doi.org/https://doi.org/10.3390/en9110944 - ,
Six-years-long effects of the Italian policies for photovoltaics on the grid parity of grid-connected photovoltaic systems installed in urban contexts ,Energy , Vol. 130 ,pp 55-75 , 2017, https://doi.org/https://doi.org/10.1016/j.energy.2017.04.069 - ,
Financial analysis of photovoltaic configurations for Colombian households ,IEEE Lat. Amer. Trans. , Vol. 13 (12),pp 3832-3837 , 2015, https://doi.org/https://doi.org/10.1109/TLA.2015.7404916 - ,
Net-Metering Benefits for Residential Customers: The Economic Advantages of a Proposed User-Centric Model in Italy ,IEEE Ind. Appl. Mag. , Vol. 24 (4),pp 39-49 , 2018, https://doi.org/https://doi.org/10.1109/MIAS.2017.2740459 - ,
Analisis economico de la generacion solar distribuida y de los mecanismos regulatorios de incentivos em Argentina, Proceedings of the Congresso Internacional de Distribuicion Electrica (CIDEL) ,Buenos Aires, Argentina ,pp 24-26 , 2018 - Regimen De Fomento A La Generacion Distribuida De Energia Renovable Integrada A La Red Electrica Publica, 2018, http://extwprlegs1.fao.org/docs/pdf/arg180862.pdf
- , , Resolucao Normativa ANEEL No 482/2012 e No 687/2015: Micro e Minigeracao Distribuidas de Fontes Renovaveis Ou Cogeracao Qualificada e Inclusive Fornecer o Excedente Para a Rede de Distribuicao de Sua Localidade, 2015
- , , Micropower system modeling, 2006
- , 2016, www.homerenergy.com
- ,
Economic evaluation of renewable energy systems for the optimal planning and design in Korea - a case study ,J. of Sustain. Dev. of Ener., Wat. and Envir. Syst. , Vol. 6 (4),pp 725-741 , 2018, https://doi.org/https://doi.org/10.13044/j.sdewes.d6.0216 - ,
Review of hybrid renewable energy systems with comparative analysis of off-grid hybrid system ,Renew. and Sustain. Ener. Rev. , Vol. 81 ,pp 2217-2235 , 2018, https://doi.org/https://doi.org/10.1016/j.rser.2017.06.033 - ,
Design and Optimization of Hybrid PV-Wind Renewable Energy System ,Materials Today: Proceedings , Vol. 5 (1),pp 810-818 , 2018, https://doi.org/https://doi.org/10.1016/j.matpr.2017.11.151 - ,
A review of optimum sizing of hybrid PV-Wind renewable energy systems in Oman ,Renew. and Sust. Ener. Rev. , Vol. 53 ,pp 185-193 , 2016, https://doi.org/https://doi.org/10.1016/j.rser.2015.08.039